Optimization and validation of a new 3D-US imaging
robot to detect, localize and quantify lower limb arterial
stenoses
par
Marie-Ange Janvier
Institut de génie biomédical Faculté de Médecine
Thèse présentée à la Faculté des études supérieures et postdoctorales en vue de l’obtention du grade de Philosophiae Doctor (Ph.D.)
en génie biomédical
Octobre, 2010
Université de Montréal
Faculté des études supérieures et postdoctorales
Cette thèse intitulée:
Optimisation and validation of a new 3D-US imaging robot to detect, localize and quantify lower limb arterial stenoses
présentée par : Marie-Ange Janvier
a été évaluée par un jury composé des personnes suivantes :
Rick Hoge, président-rapporteur Guy Cloutier, directeur de recherche Gilles Soulez, co-directeur de recherche
Farida Chériet, membre du jury Ilian Bonev, examinateur externe
Résumé
L’athérosclérose est une maladie qui cause, par l’accumulation de plaques lipidiques, le durcissement de la paroi des artères et le rétrécissement de la lumière. Ces lésions sont généralement localisées sur les segments artériels coronariens, carotidiens, aortiques, rénaux, digestifs et périphériques. En ce qui concerne l’atteinte périphérique, celle des membres inférieurs est particulièrement fréquente. En effet, la sévérité de ces lésions artérielles est souvent évaluée par le degré d’une sténose (réduction >50 % du diamètre de la lumière) en angiographie, imagerie par résonnance magnétique (IRM), tomodensitométrie ou échographie. Cependant, pour planifier une intervention chirurgicale, une représentation géométrique artérielle 3D est notamment préférable. Les méthodes d’imagerie par coupe (IRM et tomodensitométrie) sont très performantes pour générer une imagerie tridimensionnelle de bonne qualité mais leurs utilisations sont dispendieuses et invasives pour les patients.
L’échographie 3D peut constituer une avenue très prometteuse en imagerie pour la localisation et la quantification des sténoses. Cette modalité d’imagerie offre des avantages distincts tels la commodité, des coûts peu élevés pour un diagnostic non invasif (sans irradiation ni agent de contraste néphrotoxique) et aussi l’option d’analyse en Doppler pour quantifier le flux sanguin. Étant donné que les robots médicaux ont déjà été utilisés avec succès en chirurgie et en orthopédie, notre équipe a conçu un nouveau système robotique d’échographie 3D pour détecter et quantifier les sténoses des membres inférieurs. Avec cette nouvelle technologie, un radiologue fait l’apprentissage manuel au robot d’un balayage échographique du vaisseau concerné. Par la suite, le robot répète à très haute précision la trajectoire apprise, contrôle simultanément le processus d’acquisition d’images échographiques à un pas d’échantillonnage constant et conserve de façon sécuritaire la force appliquée par la sonde sur la peau du patient. Par conséquent, la reconstruction d’une géométrie artérielle 3D des membres inférieurs à partir de ce système pourrait permettre une localisation et une quantification des sténoses à très grande fiabilité. L’objectif de ce projet de recherche consistait donc à valider et optimiser ce système robotisé d’imagerie échographique 3D.
La fiabilité d’une géométrie reconstruite en 3D à partir d’un système référentiel robotique dépend beaucoup de la précision du positionnement et de la procédure de calibration. De ce fait, la précision pour le positionnement du bras robotique fut évaluée à travers son espace de travail avec un fantôme spécialement conçu pour simuler la configuration des artères des membres inférieurs (article 1 - chapitre 3). De plus, un fantôme de fils croisés en forme de Z a été conçu pour assurer une calibration précise du système robotique (article 2 - chapitre 4). Ces méthodes optimales ont été utilisées pour valider le système pour l’application clinique et trouver la transformation qui convertit les coordonnées de l’image échographique 2D dans le référentiel cartésien du bras robotisé. À partir de ces résultats, tout objet balayé par le système robotique peut être caractérisé pour une reconstruction 3D adéquate.
Des fantômes vasculaires compatibles avec plusieurs modalités d’imagerie ont été utilisés pour simuler différentes représentations artérielles des membres inférieurs (article 2 - chapitre 4, article 3 - chapitre 5). La validation des géométries reconstruites a été effectuée à l`aide d`analyses comparatives. La précision pour localiser et quantifier les sténoses avec ce système robotisé d’imagerie échographique 3D a aussi été déterminée. Ces évaluations ont été réalisées in vivo pour percevoir le potentiel de l’utilisation d’un tel système en clinique (article 3- chapitre 5).
Mots-clés : Système d’échographie 3D, sténoses, calibration, robotique médicale, fantôme
Abstract
Atherosclerosis is a disease caused by the accumulation of lipid deposits inducing the remodeling and hardening of the vessel wall, which leads to a progressive narrowing of arteries. These lesions are generally located on the coronary, carotid, aortic, renal, digestive and peripheral arteries. With regards to peripheral vessels, lower limb arteries are frequently affected. The severity of arterial lesions are evaluated by the stenosis degree (reduction > 50.0 % of the lumen diameter) using angiography, magnetic resonance angiography (MRA), computed tomography (CT) and ultrasound (US). However, to plan a surgical therapeutic intervention, a 3D arterial geometric representation is notably preferable. Imaging methods such as MRA and CT are very efficient to generate a three-dimensional imaging of good quality even though their use is expensive and invasive for patients.
3D-ultrasound can be perceived as a promising avenue in imaging for the location and the quantification of stenoses. This non invasive, non allergic (i.e, nephrotoxic contrast agent) and non-radioactive imaging modality offers distinct advantages in convenience, low cost and also multiple diagnostic options to quantify blood flow in Doppler. Since medical robots already have been used with success in surgery and orthopedics, our team has conceived a new medical 3D-US robotic imaging system to localize and quantify arterial stenoses in lower limb vessels. With this new technology, a clinician manually teaches the robotic arm the scanning path. Then, the robotic arm repeats with high precision the taught trajectory and controls simultaneously the ultrasound image acquisition process at even sampling and preserves safely the force applied by the US probe. Consequently, the reconstruction of a lower limb arterial geometry in 3D with this system could allow the location and quantification of stenoses with high accuracy. The objective of this research project consisted in validating and optimizing this 3D-ultrasound imaging robotic system.
The reliability of a 3D reconstructed geometry obtained with 2D-US images captured with a robotic system depends considerably on the positioning accuracy and the calibration procedure. Thus, the positioning accuracy of the robotic arm was evaluated in the workspace with a lower limb-mimicking phantom design (article 1 - chapter 3). In
addition, a Z-phantom was designed to assure a precise calibration of the robotic system. These optimal methods were used to validate the system for the clinical application and to find the transformation which converts image coordinates of a 2D-ultrasound image into the robotic arm referential. From these results, all objects scanned by the robotic system can be adequately reconstructed in 3D.
Multimodal imaging vascular phantoms of lower limb arteries were used to evaluate the accuracy of the 3D representations (article 2 - chapter 4, article 3 - chapter 5). The validation of the reconstructed geometry with this system was performed by comparing surface points with the manufacturing vascular phantom file surface points. The accuracy to localize and quantify stenoses with the 3D-ultrasound robotic imaging system was also determined. These same evaluations were analyzed in vivo to perceive the feasibility of the study.
Keywords: 3D-US system, stenoses, calibration, medical robotics, calibration phantom,
Table of contents
Résumé………..iii
Abstract ………..v
Table of contents ………..vii
List of tables ………xiii
List of figures ………..xiv
List of appendices ………..xvii
List of abbreviations ……….xviii
Acknowledgments ……….xxiv
Chapter 1 ... 1
Atherosclerosis ... 1
1.1 Introduction... 1
1.2 Pathogenesis of atherosclerosis... 1
1.3 Stenotic lesion characterization ... 5
1.4 Lower limb peripheral arterial diseases... 6
1.4.1. Symptoms ... 7
1.4.2. Risk Factors... 9
1.5 Diagnostic methods ... 11
1.5.1 Non-invasive screening methods ... 11
1.5.1.1 Ankle brachial index... 11
1.5.1.2 Tests and exercises ... 12
1.5.1.3 Duplex ultrasound (US) ... 14
1.5.2 Invasive diagnostic methods ... 17
1.5.2.1 Digital subtraction angiography (DSA) ... 17
1.5.2.2 Computed tomography angiography (CTA) ... 19
1.5.2.3 Magnetic resonance angiography (MRA)... 20
1.5.2.4 Other technologies ... 22
1.6 Therapeutic interventions ... 23
1.6.2 Invasive treatment ... 25
1.7 Summary... 27
Chapter 2 ... 31
Literature review of 3D-US imaging systems ... 31
2.1 3D-US imaging system... 31
2.2 3D Sensorless systems... 32
2.2.1 Pseudo tracking ... 32
2.2.2 Decorrelation techniques ... 32
2.2.3 Integrated position sensors and 3D probes ... 33
2.3 3D Sensor based systems... 36
2.3.1 Articulated arm... 36
2.3.2 Acoustics... 37
2.3.3 Linear step motors ... 38
2.3.4 Electromagnetic sensors ... 39 2.3.5 Optical sensors ... 40 2.3.6 Hybrid sensors... 41 2.4 US robotic developments... 42 2.4.1 Telemedicine ... 42 2.4.2 Brachytherapy ... 44 2.4.3 Cardiovascular diseases ... 45
2.5 Prototype 3D-US medical robot... 48
2.7 Objectives ... 49
2.7.1 Thesis Plan ... 49
Chapter 3 ... 51
Performance evaluation of a medical robotic 3D-ultrasound imaging system ... 51
3.1 Forward... 51
3.2 Abstract... 52
3.3 Introduction... 52
3.4 Materials ... 56
3.4.2 Phantom model... 60
3.5 Methods ... 62
3.5.1 SP calibration ... 63
3.5.2 SP calibration precision ... 64
3.5.3 Performance evaluation of the robot ... 65
3.5.3.1 Position and inter-distance accuracies ... 66
3.5.3.2 Teach/replay repeatability... 67
3.5.3.3 Statistical analyses ... 67
3.5.4 3D-US reconstruction of a vascular phantom from a robot scan ... 67
3.5.4.1 Calibration with a cross-wire ... 68
3.5.4.2 3D-US reconstruction ... 69 3.5.4.3 Quantification of stenoses ... 70 3.6 Results ... 70 3.6.1 SP calibration ... 70 3.6.2 SP calibration precision ... 71 3.6.3 Performance evaluation ... 72 3.6.3.1 Positioning accuracy ... 72 3.6.3.2 Inter-distance accuracy ... 73 3.6.3.3 Teach/replay repeatability... 74
3.6.4 3D-US reconstruction of a vascular phantom from a robot scan ... 75
3.6.4.1 Calibration with the cross-wire phantom... 75
3.6.4.2 3D-US reconstruction ... 75
3.6.4.3 Stenosis evaluation ... 76
3.7 Discussion... 77
3.7.1 SP calibration and precision... 77
3.7.2 Performance evaluation ... 77
3.7.2.1 Positioning accuracy ... 77
3.7.2.2 Inter-distance accuracy ... 78
3.7.2.3 Teach/replay repeatability... 78
3.7.4 Advantages and limitations of our robotic system ... 81
3.7.4.1 Performance... 81
3.7.4.2 Design ... 82
3.7.5 3D-reconstruction of a vascular phantom from a robot scan... 83
3.7.5.1 Calibration with a cross-wire and 3D-US reconstruction ... 83
3.7.5.2 Stenosis evaluation ... 84
3.8 Conclusion ... 84
Chapter 4 ... 86
Validation of 3D reconstructions of a mimicked femoral artery with an ultrasound imaging robotic system... 86
4.1 Forward... 86
4.2 Abstract... 86
4.3 Introduction... 87
4.4 Materials and methods... 89
4.4.1 Prototype medical robotic 3D-US imaging system... 89
4.4.2 Calibration procedure ... 91
4.4.2.1 Calibration phantom, experimental set-up, data acquisition and processing 91 4.4.2.2 Calibration equations ... 93
4.4.2.3 Calibration performance evaluation with the Z-phantom... 95
4.4.3 3D reconstruction performance evaluation on a lower limb-mimicking artery.. 96
4.4.3.1 Vascular phantom geometry and experimental set-up... 96
4.4.3.2 3D-US reconstruction process... 96
4.4.3.3 3D reconstruction performance evaluation ... 97
4.4.4 Statistical analysis ... 97
4.5 Results ... 98
4.5.1 Calibration performance evaluation with the Z-phantom... 98
4.5.2 3D reconstruction performance evaluated on a lower limb-mimicking artery ... 99
4.6 Discussion...103
4.6.1 Calibration performance evaluation ...103
4.6.2 3D reconstruction performance evaluation on a lower limb-mimicking artery.107
4.6.2.1 Comparison with the literature ...109
4.7 Conclusion ...111
A 3D ultrasound imaging robotic system to detect and quantify lower limb arterial stenoses: in vivo feasibility...113
5.1 Forward...113
5.2 Abstract...114
5.3 Introduction...114
5.4 Materials and methods...117
5.4.1 3D-US imaging robotic system...117
5.4.2 In vitro analysis of a realistic vessel segment ...118
5.4.2.1 Vascular phantom and experimental set-up: ...118
5.4.2.2 3D-US vessel representation ...119
5.4.2.3 CTA representation of the vessel...120
5.4.2.4 Geometric evaluation of 3D vessel representations...120
5.4.3 In vivo feasibility study ...122
5.4.3.1 3D-US Imaging robotic system: experimental set-up, data acquisition and processing ...122
5.4.3.2 CTA: experimental set-up, data acquisition and processing ...123
5.4.3.3 geometric evaluation of 3D vessel representations ...123
5.4.3 Statistical analysis ...123
5.5 Results ...124
5.5.1 In vitro analysis of a short, realistic vessel segment ...124
5.5.1.1 Comparative analyses of 3D vessel representations ...124
5.5.1.2 Localization and quantification of stenoses ...127
5.5.2 In vivo feasibility study ...128
5.6 Discussion...132
5.6.1 Analyses of 3D vessel representations ...132
5.6.2 Analyses of localization and quantification of stenoses ...134
5.6.3.1 Analyses of 3D vessel sepresentations ...135
5.6.3.2 Analyses of localization and quantification of stenoses ...136
5.7 Conclusion ...138
Discussion ...139
6.1 Summary and original contributions ...139
6.1.1 Calibration...140
6.1.1.1 Robot kinematics calibration...140
6.1.1.2 US image calibration ...141
6.1.1.3 Image registration ...143
6.1.2 Geometric evaluations of 3D vessel representations...144
6.2 Future research...146
6.2.1 New robotic design...146
6.2.2 3D Image processing ...148
6.2.3 Clinical benefits...150
6.3 Conclusion ...151
List of tables
Table 1: Classifications of peripheral arterial diseases according to Rutherford categories
and Fontaine’s grades [21]. ... 9
Table 2: Spherical pointer (SP) calibration results ... 71
Table 3: Robot positioning accuracy ... 73
Table 4: Robot inter-distance accuracy... 74
Table 5: Robot teach/replay repeatability ... 75
Table 6 : Vascular phantom 3D reconstruction results ... 76
Table 7: Calibration precision ... 98
Table 8: Reconstruction accuracy... 99
Table 9: Comparative analysis of 3D-reconstructed surfaces ...125
Table 10: Quantification of stenoses of the realistic vascular phantom ...128
Table 11: Lengths of stenoses of the realistic vascular phantom ...128
Table 12: Comparative analysis of 3D-reconstructed surfaces of the Middle segment of the patient’s right femoral artery ...129
List of figures
Figure 1.1: Atherosclerosis plaque progression. ... 2 Figure 1.2: a) Histology of initial smooth muscle cells trapped into the lipid core of a type
IV lesion and macrophage foam cells (fo) overlying the core on the side towards the arterial lumen. b) Atherosclerosis pathogenesis. ... 3
Figure 1.3: Pathways of atherosclerosis progression and regression. The order in which
distinct lesion types usually develop is designated with the numerals I to VIII. The diagram lists the main histological characteristics of each sequential step (lesion type). Thick or thin arrows differentiate between the relative ease with which lesions develop in specific locations, or they indicate the relative frequency and importance of a specific pathway section... 4
Figure 1.4: Atherosclerosis plaque progression ... 5 Figure 1.5: In the guidelines to evaluate the severity of stenosis, NASCET and ECST
measurement methods are used. ... 6
Figure 1.6: Complete anterior view of lower limbs peripheral arteries and veins. ... 7
Figure 1.7: Screening of PAD with the ankle-brachial index (ABI) test.
(DP = dorsalis pedis, PT = posterior tibial). ... 12
Figure 1.8: Pulse volume recordings of a patient presenting a PAD in its left leg. ... 14 Figure 1.9: a) Diagnostic US imaging system. b) US probe scanning the lower limb (leg).
c) Color Doppler superimposed on a B-mode arterial image in cross-sectional view. 15
Figure 1.10 : Duplex scanning: a) longitudinal view of the common femoral artery in
pulsed wave Doppler US. b) Corresponding spectral density waveform... 16
Figure 1.11: DSA diagnosis: a) the fluroscopic equipment and b) an angiogram of lower
limb arteries with a stenosis on the right leg. ... 18
Figure 1.12: a) A CTA medical imaging equipment. b) A 3D surface rendered view of
lower limb arteries with CTA. ... 19
Figure 1.13: a) MRI system. b) MRA combined views of different portions of the lower
Figure 1.14: Invasive therapeutic interventions: balloon angioplasty and stenting………26
Figure 2.1: Speckle decorrelation technique ………. 33
Figure 2.2: Integrated position sensor probes …...….34
Figure 2.3: 2D linear probe array and the process to acquire a 3D volume is shown …....35
Figure 2.4: FARO articulated arm.………..37
Figure 2.5: Linear Stepper Motor System………... 38
Figure 2.6: AC electromagnetic tracking device by Polhemus ………...40
Figure 2.7: Optical tracking system with 2 cameras from Polaris NDI ………..41
Figure 2.8: OTELO: the mobile tele-echography system using an ultra-light robot……...43
Figure 2.9: Brachytherapy treatment ………..44
Figure 2.10: Hippocrate robot ………...45
Figure 2.11: UBC Image-guided robot-assisted diagnostic ultrasound ………..47
Figure 2.12: The 3D-ultrasound (US) robotic imaging system ………..48
Figure 3.1: The 3D-ultrasound (US) robotic imaging system ………....56
Figure 3.2: The 3D-ultrasonic robotic system block diagram ………....59
Figure 3.3: The lower limb mimicking phantom ………....60
Figure 3.4: The spherical pointer ………....61
Figure 3.5: The designated experimental zone in the robot workspace ………...62
Figure 3.6: The three referential coordinate systems in this study ………...63
Figure 3.7: The symmetric cylindrical vascular phantom ………...68
Figure 3.8: The precision histogram of the robot scanner ………...71
Figure 3.9: The 3D–ultrasound reconstructed phantom with double stenoses ………...76
Figure 4.1: Overview of the prototype medical robotic 3D-US imaging system ……...90
Figure 4.2: A complete view of the calibration phantom ………...90
Figure 4.3: Top view of the Z-phantom ………...91
Figure 4.4: The coordinate system involved in the calibration method ………...92
Figure 4.5: Examples of 3D-reconstructed vascular geometries with axisymmetric double stenoses (S1 and S2) ………...100
Figure 4.6: Reconstruction errors with respect to the axisymmetric cylindrical gold standard model ………...101
Figure 4.7: Mean areas of 3D-reconstructed vascular geometries with respect to gold
standard dimension at different US image settings ………....102
Figure 5.1: F3 CRS robotic arm used in the 3D-ultrasound (US) imaging robotic
system...117
Figure 5.2: CAD representation of a realistic vascular phantom embodying an iliac artery
with 2 severe stenoses (S1 and S2).………...119
Figure 5.3: 3D vessel representations of the realistic vascular phantom with 2 severe
stenoses (S1 and S2) illustrated by (a) 3D-US, (b) CTA, and (c) the CAD file …………..124
Figure 5.4: Comparative analysis between 3D vessel representations of the realistic
vascular phantom with 2 severe stenoses (S1 and S2)………....126
Figure 5.5: Lumen cross-sectional area, obtained from 3D vessel representations of the
short, realistic vascular phantom ………...127
Figure 5.6: A volume rendering 3D reformation of the CTA on patient’s right femoral
artery ……...……….129
Figure 5.7: Entire CTA vessel representation of the patient’s right femoral artery with
corresponding 3D-US segment in B-mode ………...130
Figure 5.8: The corresponding cross-sectional lumen area of the CTA 3D vessel
representation of the patient’s right femoral artery is analysed with (a) B-mode and (b) color Doppler ……….131
Figure 6.1: New parallel robot architecture for 3D-US medical imaging ………147 Figure A.13: Resolution of the US beam in 3D space ………xxvii
List of appendices
Appendix 1: US image characteristics………xxv Appendix 2: Conference proceedings ……….xxviii Appendix 3: Authors and editors authorizations ………...xxix
List of abbreviations
1.5D One and a half dimensions
2D Two dimensions 3D Three dimensions * Pondering parameter α Pondering parameter β Pondering parameter δ Pondering parameter ξ Pondering parameter γ Pondering parameter
ABI Ankle brachial index
AC Alternating current
ACE Angiotensin-converting enzyme
ref
A Reference vessel area (or diameter) in a non diseased zone
min
A Minimal vessel area (or diameter) in a stenotic zone
B Reconstruction surface
CAD Coronary artery disease
CAD-file Computer assisted design file
CCD Charged coupled device
CT Computed tomography
CTA Computed tomography angiography
CVD Cerebrovascular disease
rms
C Calibration precision
D Diameter
DC Direct current
DOF Degrees of freedom
k j i
E,, Surface map reconstruction error in i, j and k directions
ECST European carotid surgery trial
EM Electromagnetic
FDA Food and drug administration
FOV Field-of-view
F/T Force/torque
G Lower limb mimicking phantom referential coordinate
system
k
G Ground truth position vector of target point k from the phantom
I US image coordinate system
IMT Intima-media thickness
IntDist Inter-distance accuracy
teach
IntDist Inter-distance accuracy in teach mode
replay
IntDist Inter-distance accuracy in replay mode
IVUS Intravascular ultrasonography
IRED Infra-red emitting diode
L Robot workspace experimental zones index
L1, L2 Length of the first and second stenoses
LS Inter-distance length
LDL Low-density lipoproteins
LED Light emitting diode
M Target holes index of a path in a phantom
mg I/ml Iohexol organic molecule express in terms of the concentration of Iode
) , , (i j k
M Surface map points of the reconstructed vessels
MIP Maximum intensity projection
MPR Multiplanar reconstruction
MRI Magnetic resonance imaging
N Sample of images
NASCET North American symptomatic carotid endarterectomy trial
base robot phantom
offset − The position offset of the phantom with respect to the
robot base
p Statistic probability
P US probe coordinate system
base robot effector end
P −
− Position vector of the robot end-effector to its base
referential
base robot phantom
P − Position vector of the phantom to the robot-base
base robot k i phantom
P , − Position vector transformed into the phantom
referential of target point k for the SP configuration i
effector end SP
P − Translation vector of SP in the end-effector referential
base robot SP
P − Position vector of the SP center of gravity to the
robot-base referential k i teach base robot SP
P − , Teach position vector with respect to the robot
referential of target point k for the SP configuration i
k i replay base robot SP
P − , Replay position vector with respect to the robot
referential of target point k for the SP configuration i
PAD Peripheral arterial disease
Ps Positioning accuracy
PTA Percutaneous transluminal angioplasty
PVR Pulse-volume recordings
R Robot coordinate system
ROI Region of interest
Rpt Teach/replay repeatability base robot effector end R −
− Euler rotation matrice that transforms the end-effector
orientation into the robot referential S1, S2 First and second stenoses
Sarea Stenosis quantification in area reduction
) , , (i j k
S Surface map points of the reference vessel geometry
SP Spherical pointer
x
s ,sy Scaling parameters in an image
T SP calibration configuration positions index
I
PT Calibration transformation of image I in US probe P phantom
base robot
T − Transformation (rotation and translation) of the
phantom with respect to the robot-base referential
P
RT Transformation of US probe P into the robot
referential R
base robot USprobe
T − Transformation of the US probe with respect to the robot referential
USprobe image
T Transformation of the image with respect to the US probe
R
zT Transformation of robot referential R into the
Z-phantom
TRUS Trans-rectal ultrasound
URS Ultrasound robotic scanner
US Ultrasound
k
u ,vk Column and row indices for each image k
v/v Volume concentration
B
xk, yk ,zk Point in the kth US image localized into the
Z-phantom referential
Z Z-phantom coordinate system
i
σ Standard deviations of the reconstructed points for an US image i k j i x ,, 2 σ , k j i y, , 2
σ , σz2i,j,k Variance for SP calibration configuration positions i in the x, y and z directions for the experimental zone j and target point k.
To my mother, my true inspiration
‘Only God Himself fully appreciates the influence of a Christian mother in the
molding of character in her children.’ Billy Graham
Acknowledgments
First and foremost, I want to thank my Lord and Savior Jesus Christ for leading me the opportunity of pursuing a Ph.D. in biomedical engineering, an emerging multidisciplinary field of my highest interest. He has provided me with faith, strength, courage, perseverance and determination to fulfill this work throughout all the challenges faced in this journey. Without His utmost council this work would have never been accomplished.
I am also grateful to Dr. Guy Cloutier, my research supervisor who has welcomed me with open arms into his Laboratory of Biorheology and Medical Ultrasonics (LBUM), has directed my thesis work and has offered financial support. During the past 7 years at the M.Sc. and Ph.D. levels, he has molded me with important research skills, enlightened me to have a broader perspective for my work and encouraged me to have critical thinking. Also, because of the independence he has granted me throughout these years, I have been able to develop a sense of autonomy and confidence to carry any endeavour in my life. In addition, on various occasions he gave me the opportunity to present my work at numerous well renowned national and international conferences.
I am thankful to Dr. Louise Allard who has helped me shaped my research work into applicable contributions. She has invested a considerable amount of time and effort in directing and reviewing my research. In addition to research coordination, Dr Allard provides a framework of commitment and dedication, coupled with utmost kindness, which allowed me to persevere and develop confidence in my abilities.
This project could not have been produced without the collaboration of a multidisciplinary team of experts. I am thankful to Dr. Pascal Bigras and Dr. Simon Lessard for their counsel on robots. They both provided a strong foundation to build my project. I am also thankful to Dr. Gilles Soulez, my co-supervisor, especially for his expertise on the clinical application which was very resourceful and instrumental for my
research work. I am also grateful for his perspective and enthusiasm that were very encouraging throughout the project. Because of all of you, this project has continuity.
I have also much appreciated the collaboration and support of my fellow colleagues past and present at the LBUM laboratory. The numerous discussions shared throughout the international themed dinners have provided me with much perspective on life essentials. These precious moments I will take with me forever. I would like to thank more particularly, Boris Chayer who along with his good humour and remarkable personality has prepared most of the phantoms necessary for my project. I am also indebted to Zhao Qin, Isabelle Renaud, Dr. Claude Kauffmann, Dr. Marie-Hélène Roy Cardinal and Dr. Marianne Fenech for all their support and technical skills that benefited the advancement of my research.
On a personal level, I am grateful to my mother Arnouse, my true inspiration and biggest supporter. Her continual encouragement and love gave me the wind I needed under my wings to fly with a gaze fix at the horizon instead of the shore. Also, I could not have completed this work without the patience and understanding of my sister Florence. Your friendship has helped me grow into a better person. Finally, I want to thank all my other family members and friends that encouraged me throughout this process. Your kind words have given me the support to complete this thesis.
This work was supported in part by the Canadian Institutes of Health Research (CIHR) under grant MOP #53244 and studentship awards from the Fonds de la recherche sur la nature et les technologies du Québec, TD Canada Trust, the Institute of Biomedical Engineering at Université de Montréal, the Quebec Black Medical Association and the End of Study Grant from the Faculty of Graduate and Postgraduate Studies at Université de Montréal.
Atherosclerosis
Problems are not stop signs, they are guidelines.
Robert H. Schuller
This chapter presents the clinical context behind this thesis. Atherosclerosis disease and its progression into stenotic lesions are first described, while the manifestation of this pathology in lower limb arteries follows. Various diagnostic methods of peripheral arterial disease and common therapies are also discussed. The chapter ends with a short summary.
1.1 Introduction
Cardiovascular diseases are one of the leading causes of death in developed countries and that affect particularly the elderly [1]. These pathologies rank high in terms of cost in health care [2] (both direct and indirect) to the nation’s economy as their prevalence is expected to increase with the aging population.
Atherosclerosis is a cardiovascular disease that leads to the hardening and remodelling of the arterial walls due to fatty cells deposition. This process can progressively narrow the lumen and affect the arteries supplying blood to the heart (causing coronary artery disease or CAD), the brain (causing cerebrovascular disease or CVD) and/or the legs (causing peripheral arterial disease or PAD) [3-5]. This pathology is a complex process that involves endothelial dysfunction, lipid metabolic disturbances, platelet activation, thrombosis, oxidative stress production, vascular smooth muscle activation, altered matrix metabolism, remodelling, genetic factors and inflammation [6].
1.2 Pathogenesis of atherosclerosis
Narrowing of arteries caused by atherosclerosis is usually initiated when the intimal endothelium becomes dysfunctional (see Fig. 1.1) [7]. This inner membrane of arteries is
significantly responsible for the vascular equilibrium (i.e., homeostasis). In normal function, the endothelium provides a permeability barrier for nutrient delivery and waste removal, reduces clotting (i.e., coagulation or thrombosis formation) in inflammation (i.e., injury or infection) and finally regulates the vascular tone.
Figure 1.1:Atherosclerosis plaque progression.1
Endothelial dysfunction develops frequently in arterial bifurcations and branch locations [6], where disturbed blood flow occurs [7]. Low-density lipoproteins (LDL) (i.e., cholesterol) circulating in the blood stream can easily deposit in the arterial wall or be trapped in the sub endothelial space [4]. When free radicals oxidize cholesterol, the endothelial cells become intoxicated. Cigarette smoking, hypertension, diabetes mellitus and obesity are all, factors that create these toxins [7]. After damages of endothelial cells, atheroprotective mechanisms are triggered and inflammation is signalled [4]. Hence, white blood cell recruitment (i.e., monocytes, macrophages and leukocytes etc.) for massive accumulation of cholesterol are initiated, which starts the process of atherosclerosis at these sites (see Fig. 1.1).
1 Source: http://s3.images.com/huge.96.481111.JPG (Accessed: 12/06/2009). Fibrous cap
Lipids, calcium, cellular debris Macrophages
transformed into foam cells
Smooth muscle cells
Damaged endothelium
(a) (b)
Figure 1.2: (a) Histology of initial smooth muscle cells trapped into the lipid core of a type IV lesion and macrophage foam cells (fo) overlying the core on the side towards the arterial lumen.2 (b) Atherosclerosis
pathogenesis.3
When the white blood cells are ingested with cholesterol, they have a foamy cytoplasm. From that point, they are called foam cells, where they accumulate in the sub endothelial tissue to form an inflammatory lesion referred to as the fatty streak [6, 7]. Foam cells generate growth factors and cytokines that make them become necrotic over time [7, 8]. Cholesterol, foam cells and debris continue to adhere to the necrotic tissue in addition to a large number of smooth muscle cells filled with lipids that multiply and form an extracellular matrix. This is when the fatty streak becomes a highly cellular advanced lesion
called the fibroproliferative atheroma (i.e., atheroma plaque). This lesion illustrated in Fig. 1.2a contains a lipid core covered by a fibrous cap that is growing in size [6, 8]. The
complete structural disorganization and thickening of the vessel wall is showed on histology hallmarks. Important characteristics of atherosclerosis histological compositions [9] are classified in lesion types I-VIII (see Fig. 1.3).
2 Source: [8] H. C. Stary "Atlas of Atherosclerosis Progression and Regression," Second ed, T. P. P.
Group, Ed. London: Richmond House, 2004.
3 Source : http://www.arnoldehret.org/images/cutsectionofartery.gif (Accessed: 10/05/2010). Lipid core Foam cells
Proteoglycan-rich layer (pgi) near the lumen of the
artery
Tear in artery wall Macrophage cell Cholesterol deposits Red blood cell Macrophage foam cell Fat deposits
Figure 1.3: Pathways of atherosclerosis progression and regression. The order in which distinct lesion types usually develop is designated with the numerals I to VIII. The diagram lists the main histological characteristics of each sequential step (lesion type). Thick or thin arrows differentiate between the relative ease with which lesions develop in specific locations, or they indicate the relative frequency and importance of a specific pathway section.4
Initially, arteries will compensate for atherosclerosis growth by remodelling. Consequently, blood vessels increase in size in order to improve the vascular flow. Nevertheless, the arterial wall hardens and can no longer compensate for atherosclerosis development, thus in advanced lesions, the arterial lumen is often invaded, which narrows and decreases the arterial blood flow. These particular lesions can become more complex and calcification can occur to the atherosclerosis plaque (see Fig. 1.4).
4 Source : [8] H. C. Stary "Atlas of Atherosclerosis Progression and Regression," Second ed, T. P. P.
Figure 1.4: Atherosclerosis plaque progression5
Severe arterial events can occur if the plaque fibrous cap is disrupted [6] or obstructs the arterial wall (see Fig. 1.4). Plaque rupture can take place through different mechanisms that include inflammation [7, 8]. Exposed necrotic lipid core and subendothelial tissue lead to platelet aggregation. Subsequently, thrombus formation and flow occlusion arise. At this advanced stage, the pathology can cause a stroke or a myocardial infarction and/or limb ischemia.
1.3 Stenotic lesion characterization
Occlusions in arteries are called stenotic lesions (or stenoses). A severe stenosis is defined by clinicians as more than 50.0 % reduction of the arterial diameter. Generally, NASCET (North American Symptomatic Carotid Endarterectomy Trial) and ECST (European Carotid Surgery Trial) guidelines are used by clinicians to quantify carotid stenosis with percentage ratio on angiograms (i.e., images of the lumen artery); this method is also applicable to other arteries and imaging modalities [10-12].
Figure 1.5: In the guidelines to evaluate the severity of stenosis, NASCET and ECST measurement methods are used.6
Usually, the numerator is the narrowest diameter difference (i.e., stenosis) for both methods. The denominator is either the distal artery (for NASCET) or the estimated diameter of unseen stenosis outer walls (for ECST) (Fig. 1.5). While both methods are used for different diagnostic imaging technologies, each present their own set of errors. NASCET, the most commonly used technique, is more representative of the luminal narrowing but can underestimate the lesion in case of near occlusions or diffuse atheromatous infiltration [10, 11]. Likewise, ECST has the subjective bias of measuring an unseen artery [10]. Regardless of the method, the degree of stenosis correlates with blood flow velocity and symptoms that can be used to identify the severity of impaired arterial lesions [6, 13].
1.4 Lower limb peripheral arterial diseases
Atherosclerosis is a systematic disease that progresses in most medium-size vessels of the lower extremity, such as the aorto-iliac and infrainguinal system [9, 16-18]. This disease is more prevalent in the femoral and popliteal arteries (80 % - 90 % of symptomatic patients), tibial and peroneal arteries (40 % - 50 % of symptomatic patients), in the aorta and iliac artery (30% of symptomatic patients) [8, 14]. Atherosclerosis mainly develops in 5 Source: http://multivu.prnewswire.com/mnr/uaa/37598/images/37598-hi-Athero_Progression.jpg (Accessed:
10/05/2010) % 100 ⋅ − C A C ECST-method: % 100 ⋅ − B A B NASCET-method:
the arterial system compared to the veins because more oxygen is available in arteries to oxidized cholesterol (see lower limb vessel anatomy in Fig. 1.6). When a cardiovascular event (i.e., myocardial infarction, stroke) occurs in other vascular regions (i.e., coronary and carotid arteries), PAD is often present symptomatically or asymptomatically [3, 7, 15, 16].
Occlusions in lower limb peripheral arteries contribute to diminished blood supply, causing decreased oxygen and nutrient supply in distal tissues and muscles. If occlusions further progress and/or perpetuate, cell injury can cause severe tissue ischemia or furthermore, tissue breakdown which can lead to a cardiovascular event, amputation and even death.
Figure 1.6: Complete anterior view of lower limb peripheral arteries and veins.7
1.4.1. Symptoms
Most PAD are diagnosed when severe symptoms are present because in early stages of the disease, they are usually silent [17]. When stenotic lesions are severe, intermittent claudication symptoms may appear in hips, buttocks, calves and arch of the foot and even 6 Source: http://www.tidsskriftet.no/index.php?seks_id=1181296&a=fig&art_id=1181232 (Accessed:
22/07/2009).
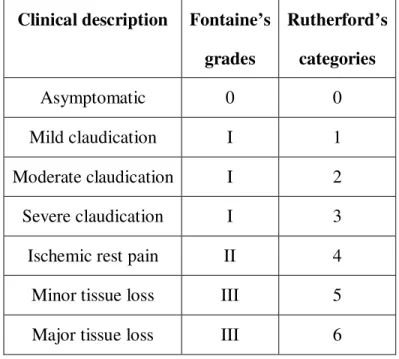
sometimes produce erectile dysfunction in males [7, 18, 19]. Intermittent claudication, the primary perceptible PAD symptom, is defined by leg muscle pain, cramping and fatigue brought on by ambulation or exercise, relieved at rest [8]. The location of the pain is determined by the anatomical level of the disease. A blood flow velocity increase is observed inside the stenotic lesion with flow velocity and blood pressure drops downstream of the lesion. This phenomena is amplified during exertion because of the increase of oxygen consumption requiring more blood inflow. More complex symptoms are involved in case of critical limb ischemia where ischemic symptoms are present at rest. Rest pain, minor and major tissue losses (ulceration) can be observed. In this case, the limb can be mummified with dry black toes or devitalized soft tissues covered by crust (gangrene). Moreover, metabolic abnormalities in the skeletal muscles of the lower extremity can occur [17]. However, in case of chronic disease, an extensive collateralization (i.e., microvascular growth) occurs in the lower limb arteries increasing blood downstream of the lesion. This phenomenon can alleviate the symptoms and is promoted by exercise. With disease progression, obstructions at different levels are observed with a cumulative effect on flow impairment. Thus, symptoms usually surface when one or more vessels have been severely narrowed. To rate the symptom severity, two classification systems are commonly used [20, 21]. In the Rutherford system, mild, moderate and severe claudications are categorized from 1-3 and asymptomatic patient as 0, while categories 4-6 encompass ischemic rest pain, minor to major tissue losses and critical limb ischemia (see Table 1). In the Fontaine system of classification, only 4 grades (0-III) associated with asymptomatic, moderate claudication, ischemic rest pain and critical ischemia (see Table 1) are used. It is important to note that Rutherford’s classification is the clinical standard for describing clinical assessment and progress.
Table 1: Classifications of peripheral arterial diseases according to Rutherford categories
and Fontaine’s grades [21].
Clinical description Fontaine’s grades Rutherford’s categories Asymptomatic 0 0 Mild claudication I 1 Moderate claudication I 2 Severe claudication I 3
Ischemic rest pain II 4
Minor tissue loss III 5
Major tissue loss III 6
1.4.2. Risk Factors
PAD traditional risk factors are the same as those associated with atherosclerosis in the carotid, coronary and other vascular beds. They specifically include: advanced age, diabetes mellitus, smoking, hyperlipidemia and hypertension. Generally, subjects of 65 years of age or older have higher risk for PAD development [6]. This risk increases approximately 4 times more if subjects smoke cigarettes [6, 7, 22]. In addition, PAD risk is apparently directly proportional to the dose of smoking (i.e., number of packs per year). This association is twice as strong as with coronary artery disease. Certainly, this is the single most important modifiable risk factor for PAD development. Moreover, if subjects have diabetes mellitus, they are 1.5 to 4 times more likely to develop symptomatic or asymptomatic PAD. In addition, they have an associated increase risk of cardiovascular events and premature death [6, 22]. Similarly, an elevated total cholesterol level (i.e., hyperlipidemia) increases 2 times more PAD symptoms. In fact, the prevalence of symptoms was found to be 77 % in patients with known PAD [6]. Finally, hypertension has been linked to 50 % – 92 % of patients with PAD [6]. In this case, an increase risk of stroke
and myocardial infarction independent of other factors exist with these patients [22]. Clearly, all these traditional risk factors can be modified to reduce PAD progression [23].
Non traditional risk factors also have shown to predict the prevalence of PAD. These risks include: race and ethnicity, inflammation, chronic kidney disease, genetics, hypercoagulable states and abnormal waist to hip ratio. However, not much study has been established to clearly outline their specific relationship to PAD. Black and Hispanic populations have shown to be disproportionately prevalent to PAD even after adjustments to traditional risk factors [6, 22, 23]. In addition, elevated levels of inflammatory markers (e.g., leukocytes) have already been observed in patients with atherosclerosis in other arterial systems. However, several studies suggest that high level of inflammatory markers are more specifically associated to PAD in lower limbs [6]. Furthermore, an unknown association of PAD with chronic kidney and severe renal diseases appears to exist independently of the traditional risk factors [6]. For example, PAD patients with chronic kidney disease are at increased risk for critical limb ischemia, while those with severe renal disease are at increase risk for amputation.
Yet, recently, several studies suggested an independent association between PAD and hypercoagulable states or thrombophilia (i.e., increase tendency to develop blood clot due to an abnormality) [6]. In some cases, hemostatic factors seem to be associated with premature atherosclerosis more prominently in PAD progression than for carotid artery disease. Moreover, ongoing reports of genetic predisposition to PAD also seem to suggest increased rates of CVD at an earlier age (i.e., less than 55 years) [6]. Lastly, new reports have found an association between PAD and abdominal obesity. Apparently, an increased waist to hip ratio (more than 0.966) can be associated with a 1.7 time increase risk of PAD [6].
In final analysis, PAD is a systematic atherosclerotic process that is associated with high morbidity and mortality, and significant impairment on the quality of life. However, with all well known traditional and associated risk factors, it remains underdiagnosed and undertreated [24, 25]. Moreover, most previous studies that screened PAD in the primary care settings with risk factors include patients that are already known to have PAD or another associated CVD [25]. Thus, significant benefits could be achieved in detecting
PAD patients with risk factor awareness and enhanced screening. However, a collaborative effort between patients and clinicians is necessary to recognize lower limb symptoms and diagnose PAD appropriately.
1.5 Diagnostic methods
Patients with PAD are principally diagnosed when they report lower limb pain to their clinician. Clinicians first employ questionnaires to assist them in identifying PAD symptoms where the walking distance and the lower extremity pain are evaluated [7]. It is to note that PAD also exists in patients with no evident symptoms. Thus, the first line of investigation with a clinician is usually subjective.
If PAD is suspected after the first consultation, specialized radiologists and/or vascular surgeons are normally referred to examine arterial lesions more specifically. Then, diagnostic approaches able to detect, locate and quantify stenoses in an objective manner are used. Non-invasive screening techniques such as ankle brachial index, tests & exercises and ultrasound (US) imaging are employed to assess PAD severity. To map the entire lower limb vascular tree, common invasive imaging technologies such as digital subtraction angiography (DSA), computed tomography angiography (CTA) and magnetic resonance angiography (MRA) are used [26].
1.5.1 Non-invasive screening methods
1.5.1.1 Ankle brachial indexThe ankle brachial index (ABI) is the oldest non-invasive method that can accurately detect the presence and severity of PAD in primary care clinical setting [7, 8, 23, 25-27]. This technique, illustrated in Fig 1.7, is described as the ratio of systolic blood pressures measured at the ankles to the one of arms with a cuff and manometer. A threshold value less than 0.90 is an indicator for PAD.
Figure 1.7: Screening of PAD with the ankle-brachial index (ABI) test. (DP = dorsalis pedis, PT = posterior tibial).8
ABI is a commonly accepted reference standard for PAD pre-diagnostic because it is sensitive and specific [13]. However, this technique presents limitations to detect PAD when peripheral arteries are heavily calcified. A falsely abnormal or high ABI can occur from arteries that consequently become rigid and non-compressible [7, 23]. ABI cannot diagnose PAD also in aorto-iliac disease, collateralized disease and occlusions for the same reason [28].
1.5.1.2 Tests and exercises
Usually, if the ABI is conclusive, further investigations are performed to localize lesions with either segmental pressure evaluations, pulse volume recordings or treadmill exercise training [7, 8]. For segmental pressures, lower limbs are separated in sections, and then at each level, pressure measurements are assessed (see Fig. 1.8). This approach similar
to the ABI requires a continuous-wave Doppler probe (explained later in section 1.5.1.3) that is placed on the different vessel segments. Stenoses are detected when a decrease of pressure occurs between two consecutive levels or when a discrepancy arises between pressure measurements at the same level of both limbs.
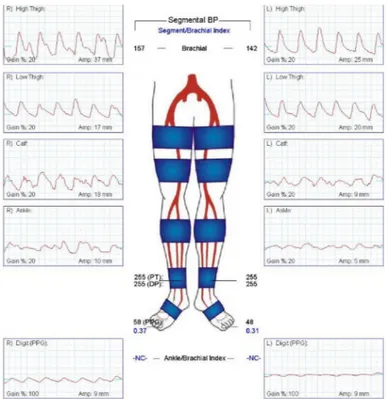
To perform pulse-volume recordings (PVR) at different levels, the same pressure measurement equipment is used and the record of plethysmographic tracing is also performed. Changes in the volume of blood flow are detected in these tracings and severe stenoses are identified when the normal peak velocity ratio (PVR) waveform becomes attenuated. Fig. 1.8 demonstrates PVR test in a patient with a symptomatic PAD on the left side with normal PVR in the right leg and decreased values in the left leg.
PAD diagnosis is also confirmed by demonstrating objectively the functional limitation of lower limbs [26]. If patients have a normal resting study and exertion symptoms, a treadmill exercise training test can be performed. During the procedure, the subject walks on a treadmill at a constant speed with a fix setting or a variable incline. This method is used as well in therapy to monitor effects on initial and absolute claudication distances.
8 Source:
Figure 1.8: Pulse volume recordings of a patient presenting a PAD in its left leg9.
Altogether, these tests and exercises are available options that are inexpensive and painless to provide a useful non-invasive method that can evaluate patients suspected with PAD when they present limb discomfort. However, all of the above vascular physical examinations have been severely criticized by physicians because they only quantify flow limitation but do not image the occlusive disease itself and its extension. Moreover, the reliability of screening is poorly reproducible, unreliable and difficult to interpret [29]. Thus, other non-invasive testing should be prompt to localize lesions more specifically.
1.5.1.3 Duplex ultrasound (US)
Medical diagnostic ultrasound is a modality that uses the ultrasound energy and the human tissue acoustic properties to produce an image (for further information relative to US see Appendix I). US images are produced from a ‘pulse echo’ technique that synthesizes a gray-scale 2D tomographic image of tissues based on the mechanical
9 Source : [26] D. Chan, M. E. Anderson, and B. L. Dolmatch, “Imaging evaluation of lower extremity
infrainguinal disease: role of the noninvasive vascular laboratory, computed tomography angiography, and magnetic resonance angiography,” Tech Vasc Interv Radiol, vol. 13, no. 1, pp. 11-22, Mar, 2010.
interaction of short pulses of high-frequency sound waves and their returning echoes [30]. The whole image data acquisition process is performed from a US system that offers convenient real-time imaging with a transducer in contact with the human body (see Fig. 1.9).
Figure 1.9: (a) Diagnostic US imaging system. (b) US probe scanning the lower limb (leg). (c) Color Doppler superimposed on a B-mode arterial image in cross-sectional view.10
This non-invasive, non-ionizing and low-cost US technology provides physicians with valuable information on vascular stenosis detection for both diagnosis and follow-up purposes. PAD severity could be analysed in multiple modes with options in B-mode, color and power Doppler that facilitate accurate blood flow quantification and localization. B-mode presents the morphology on the atherosclerotic plaque in gray scale imaging [31], and Doppler US estimates the velocity and the direction of moving blood cells based on the frequency shift principle of an US wave [30]. The US imaging system extracts Doppler information in the form of pulsed and continuous wave Doppler to output into a spectral Doppler waveform, color flow and power maps [30].
10
Source: (a) http://www.csd-ultrasound.com/mindray/DP-9900.htm (Accessed: 18/06/2009), (b) http://www.cardiosmart.org/HeartDisease/CTT.aspx?id=140 (Accessed: 09/07/2009), (c) http://www.kvu.com.au/Doctor-Information/image012.jpg (Accessed: 29/07/2009).
(a) (b)
To identify a stenosis, the spectral Doppler US waveform is often used. This US imaging mode displays the spectrum of flow velocities over time. The normal spectral density waveform is "triphasic" (see Fig. 1.10b). Turbulent flow patterns that depend on the vessel wall characteristics, size and shape of the vessel, and the flow rate are used to detect stenosis [30]. To visualize the vessel anatomy and analyze the blood flow, color flow imaging is often used [30]. This US imaging mode is a form of pulsed wave Doppler, where returning echoes are assigned a color coding representing their flow velocity and direction. This color mapping is superimposed on B-mode images (i.e., Duplex scanning).
In this form, semi quantitative assessment of blood flow velocity is provided (see Fig. 1.10a). By convention, shades of red represent flow towards the transducer, and blue
away from it. Finally, to detect and interpret subtle and slow blood flow, power Doppler imaging is used. This form of imaging relies on the total strength (amplitude) of the Doppler signal energy and ignores its direction. Thus, this imaging mode is the most sensitive to motion of the blood flow.
Figure 1.10 : Duplex scanning: a) longitudinal view of the common femoral artery in pulsed wave Doppler US. b) Corresponding spectral density waveform.11
11Source: http://www.terarecon.com/gallery/images/us_5cfa_color_dopp.jpg (Accessed: 16/06/2009).
However, all these analyses have limited accuracy in tortuous and densely calcified arterial segments. Furthermore, it is not easy to visualize the entire lower limb vascular tree within an acceptable time frame using color-flow or power Doppler US. Moreover, assessment of atherosclerotic disease with conventional B-mode 2D-US images is highly operator dependant because of the high variability encountered with 2D freehand US methods when imaging a 3D anatomy [32]. A complete 3D representation of lower limb vessels over long segments, usually starting from the abdominal aorta within the abdomen, following with iliac, femoral, and then with popliteal arteries to end in the tibial vessels of the calf, is required for comprehensive therapeutic planning (i.e., specific diameter and length of angioplasty balloons or stents).
1.5.2 Invasive diagnostic methods
1.5.2.1 Digital subtraction angiography (DSA)
Digital subtraction angiography is a fluoroscopy technique that allows real-time x-ray imaging of blood vessels with high temporal resolution [30]. Basically, the x-x-ray tube, filters and collimation are the components that altogether create a beam of x-ray photons of well-defined intensity; penetrability and spatial distribution that include an image intensifier and computer technology (see Fig. 1.11a). To visualize the lumen of blood vessels, this technique uses radio-opaque contrast agent injected into the blood with a guide wire and catheter inserted through the femoral artery. Then, radiologists can evaluate the anatomy of blood vessels by subtracting bones and other organs from previously acquired frames in order to view only the vessels filled with contrast agent. Patients have to remain motionless during the entire procedure.
DSA is the standard of reference for evaluating lower limb arterial diseases [12]. Angiograms provide the best image quality that outlines the entire lower limb vessel anatomy in 2D projections and identifies areas of narrowing (see Fig. 1.11b). Stenosis quantification is performed on diameter reduction ratios only [33]. Angiography is also
primarily used during therapeutic interventions (e.g., arterial angioplasty) as it offers real-time imaging.
Figure 1.11:DSA diagnosis: (a) the fluroscopic equipment and (b) an angiogram of lower limb arteries with a stenosis on the right leg.12
Nevertheless, DSA is an invasive ionizing procedure of substantial costs associated with potential morbidity [15]. The main complications of DSA examinations are thromboembolic events, bleeding from the puncture site, vascular injury, and exposure to radiation and toxicity related to iodinated contrast dyes [34]. Bed rest of 1 day is usually required after the procedure is completed to avoid putting stress on the arterial puncture. Furthermore, information on the morphology of the atherosclerotic plaque with this method is incomplete since DSA images only the lumen of the vessel and is usually two dimensional. This method is also known to often overestimate the length of lesions and to not always show all patent lower limb vessels (below-knee vessels may be difficult to identify, especially if the injection is not made selectively) [19, 29].
12
Source: (a) http://en.wikipedia.org/wiki/X-ray_image_intensifier (Accessed: 16/06/2009), (b) http://www.rjmatthewsmd.com/Definitions/peripheral_vascular_disease.htm (Accessed: 09/07/2009).
(a) (b)
stenosis
1.5.2.2 Computed tomography angiography (CTA)
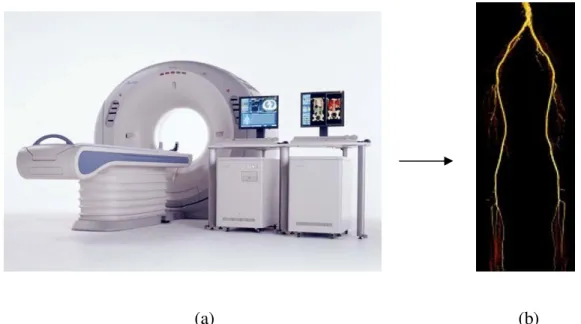
Computed tomography angiography is a medical imaging technique used to visualize arterial and venous vessels. Its principle is based on computed tomography, which combines x-rays with computerized analysis for imaging [30]. Basically, x-ray beams are passed from a single rotational axis into the targeted area of the body at several different angles to obtain projection images that are after assembled by a computer into 3D memory matrix. Fig. 1.12a shows the CT scan equipment. CTA necessitates the injection of iodine contrast agent that is inserted with a needle into a peripheral vein. The computer software permits 3D imaging performed by multiplanar reconstruction (MPR) in stacking axial slices or alternatively by maximum intensity projection (MIP), surface or volume rendering techniques based on the threshold value of radiodensity chosen by the operator.
Figure 1.12: (a) A CTA medical imaging equipment. (b) A 3D surface rendered view of lower limb arteries with CTA.13
CTA replaces conventional angiography in many PAD imaging studies [22]. In the assessment of symptomatic lower extremity arterial disease, the diagnostic performances of CTA and DSA are quite similar [12]. In fact, CTA involves minimal risk compared to DSA since it is less invasive (i.e., exposes the patient to less ionizing radiations and do not
13 Source : (a) http://www.mckweb.com/Services/Pages/Diagnostic%20Imaging%20Services.aspx (Accessed
03/07/2009),
(b) http://www.maconcvi.org/pad.html (Accessed: 03/07/2009).
require arterial puncture) [26]. Furthermore, CTA has a lower cost than DSA for diagnosis, improvement in quality of images and acquires volumetric images. Thus, 3D visualization of the arteries is possible from multiple angles and planes from a simple acquisition [26] (see Fig. 1.12b). Moreover, compared to DSA, CTA takes less time (a few seconds) to acquire images and it is less expensive [15, 16].
In addition, current high-speed, multidetector CTA techniques allow for direct evaluation and measurement of lumen diameters. Thus, stenoses can be quantified in millimetres and further derived in ratio percentages [33]. CTA also has a limited scan coverage and a good resolution [10, 12, 27]. Furthermore, it has the capability to visualize calcification and metallic implants such as endovascular stents or stent grafts [35]. Likewise, disagreements between conventional DSA and CTA results often occur in smaller arteries, particularly below the knee [12]. Moreover, several studies report decreased accuracy in severely calcified arteries and the use of a relatively large amount of intravenous contrast is a real concern for patients with reduced renal function [12, 26]. Thus, CTA might be insufficient to image accurately the entire vascular tree. Henceforth, DSA examination can be necessary to complement suboptimal CTA examinations for appropriate treatment planning.
1.5.2.3 Magnetic resonance angiography (MRA)
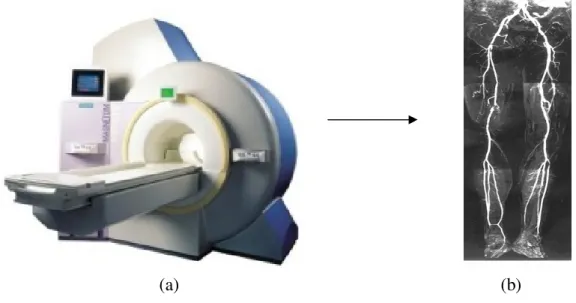
Magnetic resonance angiography [36] is a technique to image blood vessels based on magnetic resonance imaging (MRI). MRI generally provides the ability to manipulate and adjust tissue contrast with increasingly complex pulse sequences [30]. Moreover, it has the capability to accurately determine the position from the nuclear magnetic resonance signal and thus create an image. Fig. 1.13 shows an MRI system and an example of a lower limb image from this system.
Gadolinium contrast-enhanced magnetic resonance angiography is a non-invasive, non-ionizing, three-dimensional technique that has emerged as a front-line imaging approach for comprehensive evaluation of PAD [26, 37, 38]. The contrast medium is normally injected into a vein and images are acquired through the arteries within a 15-25 seconds apnea (breath-hold). Thus, if the patient remains perfectly still, high quality images
are acquired with a stack of slices that represents the 3D volume of the entire body; where slices of the vessels of interest can be selected. Display of this 3D representation is performed with a rendering method, i.e. a maximum intensity projection (MIP) that computes pixels at the highest value for display on screen. The resulting images are comparable with conventional angiography [22, 38] (see Fig.1.13b). Furthermore, MRA provides precise measurements of arterial stenoses and occlusions that are required for the planning of therapeutic interventions [26, 37, 38]. Thus, in the clinical setting, MRA can be extremely helpful in diagnosis as well as subsequent management of patients with PAD. However, artefacts present challenges in MRA for diagnostic accuracy due to signal loss from in-plane saturation and turbulent flow. Artefacts are also caused by metallic clips and stents [26]. In addition, compared to CTA, MRA seems poorer in resolution, is far more expensive and the technology is often less available for scanning PAD [35]. Moreover, MRA images mainly the vessel lumen and tends to overestimate the degree of stenosis [23, 35]. Other limiting factors with this modality in patients are claustrophobia, the rare occurrence of systemic nephrogenic fibrosis in case of renal failure and contradictions related to metal implants or pacemakers.
Figure 1.13: (a) MRI system. (b) MRA combined views of different portions of the lower limb anatomy presented into one simple view.14
14
Source: (a) www.mri-equipment.com/MRI.cfm (Accessed: 17/06/2009), (b) http://www.freepatentsonline.com/6564085.html (Accessed: 16/06/2009).
1.5.2.4 Other technologies
Diagnosis procedures at the cellular level are also emerging. They regard not only the symptomatic, but focus on the early asymptomatic phase of the disease as well [39]. For example, research on the vascular inflammation process is of interest because its importance in atherosclerosis is well established. However, limited data exist on the relationship between vascular inflammation and the severity of PAD despite several findings [40]. Thus, this might be of importance in future diagnosis and treatment of the disease.
Other alternatives are intravascular ultrasonography (IVUS) and angioscopy which are both invasive techniques that can visualize the vessel wall from inside the lumen [27]. The IVUS technique allows a visualization of the atherosclerotic plaque with a high spatial resolution important to identify arterial lesions and its relation with vessel wall that cannot be depicted on DSA. It can also be beneficial to plan an appropriate therapy. Indeed, this technology has shown promise particularly for the monitoring of endovascular interventions (e.g., angioplasty or stent deployment). Nevertheless, segmenting IVUS images is challenging because the data is quite large and the IVUS is susceptible to artefacts especially in calcified arteries [41].
Finally, physicians largely rely on the clinical examination to identify patients needing further testing to diagnose PAD. They depend on imaging technologies to assess quantitatively, the location and severity of the lesion. Thus, based on the diagnosis, proper therapeutic planning can be achieved.