AbstrAct
Objectives The impact of inhaled corticosteroids
(ICS) on eosinophilic inflammation in asthma is well established, but their effect in a real-life setting has not been extensively studied. Our purpose was to investigate the effect of ICS on airway and systemic inflammation as well as on clinical outcomes in patients with asthma from clinical practice.
Design, setting and participants We conducted a
retrospective analysis on asthmatics from a secondary care centre in whom ICS were initiated/increased (n=101), stopped/decreased (n=60) or remained stable (n=63, used as a control group) between two visits with available sputum and blood cell counts.
results The median time between both visits ranged
from 1 to 2 years. Initiating or increasing ICS (median variation (IQR): 800 (400–1200) µg beclomethasone equivalent dose per day) reduced sputum eosinophils and fractional exhaled nitric oxide (P<0.0001) and to a lesser extent blood eosinophils (P<0.0001), while withdrawing or decreasing ICS (median variation (IQR): 900 (500–1200) µg beclomethasone equivalentdose per day) resulted in increased sputum eosinophils (P=0.008). No change was found in patients with a stable dose. The effectiveness of ICS in improving asthma control, quality of life,
forced expiratory volume in 1 s (FEV1), bronchial
hyper-responsiveness and exacerbation rate was only observed in the eosinophilic phenotype (sputum eosinophils ≥3%, n=79). In non-eosinophilic asthmatics, stepping-down ICS resulted in an improvement in asthma control and quality
of life, without any significant change in FEV1 (n=38).
conclusions Our results confirm the effectiveness of ICS
on eosinophilic inflammation in real life and demonstrate that their clinical benefit seems to be restricted to eosinophilic asthmatics. Our data also support a try for stepping-down ICS in non-eosinophilic asthmatics.
IntrODuctIOn
Inhaled corticosteroids (ICS) are considered as the mainstay of asthma treatment. They have proved their ability to improve asthma control, quality of life, lung function and to
reduce the rate of exacerbations in patients with asthma.1 Their effects are thought to be
mediated by controlling airway inflammation and in particular by reducing the eosinophilic airway infiltration.2 Previous studies showed
that an initiation of ICS reduced sputum eosinophils,3–7 while the reverse was observed
with a withdrawal8 or a decrease of ICS.9 The
effect of ICS on other sputum cell types, however, is more controversial.3 4 6 7
Like-wise, whether ICS impact circulating leuco-cytes has been much less studied. Very few studies reported that ICS decreased blood eosinophils6 7 10 11 with no change in blood
neutrophils,10 but their effect on other blood
leucocytes still needs to be determined. It is now recognised that asthma exhibits different airway inflammatory phenotypes.12
Pavord et al first showed that the initiation of budesonide 800 µg/day for 2 months improved asthma symptoms and reduced bronchial hyper-responsiveness to methacho-line in patients with sputum eosinophils ≥3%,
Effectiveness of inhaled corticosteroids
in real life on clinical outcomes, sputum
cells and systemic inflammation in
asthmatics: a retrospective cohort study
in a secondary care centre
Sophie F Demarche,1,2 Florence N Schleich,1 Monique A Henket,1
Virginie A Paulus,1 Thierry J Van Hees,2 Renaud E Louis1
To cite: Demarche SF,
Schleich FN, Henket MA, et al. Effectiveness of inhaled corticosteroids in real life on clinical outcomes, sputum cells and systemic inflammation in asthmatics: a retrospective cohort study in a secondary care centre. BMJ Open 2017;7:e018186. doi:10.1136/
bmjopen-2017-018186
►Prepublication history for this paper is available online. To view these files, please visit the journal online (http:// dx. doi. org/ 10. 1136/ bmjopen- 2017- 018186). Received 12 June 2017 Revised 8 September 2017 Accepted 2 October 2017 1Department of Respiratory Medicine, CHU Liege, GIGA I³ Research Group, University of Liege, Liège, Belgium 2Department of Clinical Pharmacy, Center for Interdisciplinary Research on Medicines (CIRM), University of Liege, Liege, Belgium correspondence to Sophie F Demarche; sophie. demarche@ student. ulg. ac. be
strengths and limitations of this study
► Our study population consisted of patients from real
life.
► We included a control group with patients not
receiving inhaled corticosteroids (ICS) or keeping the same dose of ICS between two visits, in order to properly investigate the effects of an initiation/ increased dose and cessation/decreased dose of ICS between two visits.
► Our study was retrospective.
► No formal sample size calculation was performed.
► The cumulative dose of ICS received by the patients
before the investigation was uncertain due to the variation in the delay between both visits and to the unknown adherence to treatment.
on 16 August 2018 by guest. Protected by copyright.
whereas no effect was observed in those with sputum eosinophils <3%.13 Other studies, with one of them based
on a randomised, double-blind, placebo-controlled cross-over design,14 confirmed the importance of sputum
eosinophils as a predictive marker of response to ICS,4 10
even if some authors reported a possible effect in non-eo-sinophilic asthmatics.15 16 Moreover, some studies with a
limited number of subjects have shown that patients expe-riencing loss of asthma control after stepping-down ICS treatment were more likely to have eosinophilic asthma, while patients in whom this strategy might be acceptable were more often non-eosinophilic.9 17
We believe that it is important to validate findings from tightly regulated clinical trials in a real-life setting including a broad spectrum of patients with asthma who may not qualify for inclusion criteria in these trials.18
In this study, we took advantage of our large database of asthmatics seen in clinical practice to investigate the effect of ICS in real life on airway and systemic inflam-mation as well as on asthma control and lung function. We have selected 224 patients in whom ICS dose was initi-ated/increased (n=101), stopped/decreased (n=60) or remained stable (n=63) between two visits and in whom we had an analysed sputum and blood cell count for both these visits.
MethODs
study design, setting and participants
We conducted a retrospective study on patients with asthma recruited from the University Asthma Clinic of Liege (Belgium) between 1 May 2003 and 31 January 2017. The diagnosis of asthma was defined as the presence of typical symptoms (wheezing, breathlessness, chest tight-ness and cough) associated with the demonstration of an airflow variability (increase in forced expiratory volume in 1 s (FEV1) of at least 12% and 200 mL after inhalation of 400 µg salbutamol and/or a provocative concentration of methacholine causing a 20% fall in FEV1 (PC20M) <16 mg/mL. From our database, we selected patients who had at least two visits with a successful sputum and blood cell count and who were not treated with oral corticoste-roids (OCS) at the time of the visit or during the 6 previous weeks. Those who were prescribed OCS during the visit because of an exacerbation were also excluded, as well as those treated with omalizumab and mepolizumab because these drugs may have confounding effects on sputum and blood cell counts. Three groups of patients were consti-tuted: a first group of patients with an initiation/increased dose of ICS between two visits (n=101), a second group of patients with a cessation/decreased dose of ICS between two visits (n=60) and a third group of patients, used as a control group, with no ICS or a stable dose of ICS between two visits (n=63). For each patient, the delay between both visits was at least of 1 month.
Investigations conducted at the Asthma clinic
Patients were classified as atopic if they had positive specific IgE (>0.35 kU/L) to at least one of the following
aeroallergens: cat, dog, grass pollen, tree pollen, house dust mite and a mould mixture (Phadia, Groot-Bijgaarden, Belgium). Asthma control and quality of life were eval-uated by the Juniper Asthma Control Questionnaire (ACQ)19 and mini-Asthma Quality of Life Questionnaire
(mini-AQLQ),20 respectively. When patients’ visits were
separated by at least 1 year, the number of severe exacer-bations during the year prior to each visit was recorded. Severe exacerbations were defined as events requiring the use of systemic corticosteroids during at least 3 days.21
Spirometry was performed using a portable spirometer (Spirobank; MIR, Rome, Italy) connected to the computer software (Winspiro; MIR, Rome, Italy). Patients who had a FEV1 ≥70% predicted without any influence of bron-chodilators underwent a methacholine challenge test to define the PC20M, as previously described.22 Fractional
exhaled nitric oxide (FENO) was measured at a flow rate of 50 mL/s (NIOX; Aerocrine, Solna, Sweden). Sputum was induced and processed as previously described,23 with
the whole expectorate technique. Patients were classified as eosinophilic or non-eosinophilic if they had a baseline sputum eosinophil count ≥ or <3%, respectively.24 The
blood cell count and analysis of C reactive protein (CRP) and fibrinogen were performed by the routine laboratory of the University Hospital of Liege.
statistical analysis
For categorical variables, the number of observations and percentage for each category were presented. For continuous variables compatible with a normal distri-bution, the mean and SD were used, while the median and IQR were preferred for continuous variables not compatible with a normal distribution. Comparisons between the three groups of patients were performed using a Pearson’s χ2 test for categorical variables, an analysis of variance for parametric continuous variables and a Kruskal-Wallis test for non-parametric continuous variables. Paired comparisons were performed between both visits of patients. The McNemar test was used to compare binary variables, the paired t test was used for continuous variables when the differences between both visits were compatible with a normal distribution and the Wilcoxon signed-rank test was preferred for contin-uous variables when the differences between both visits were not compatible with a normal distribution. For each tested variable, when the number of missing values exceeded 10%, the number of data taken into account in the statistical analysis was specified in the tables. For the group with an initiation/increased dose of ICS and the group with a cessation/decreased dose of ICS, we compared the changes in ACQ, mini-AQLQ, severe exacerbation rate and FEV1 between eosinophilic and non-eosinophilic asthmatics, using a Student’s t-test or a Mann-Whitney test. A P value <0.05 was considered statistically significant. We used STATA V.13.0 (Statistical Software, StataCorp LP) for the statistical analysis and GraphPad Prism V.7.03 (GraphPad Software, La Jolla, California, USA) for the figures.
on 16 August 2018 by guest. Protected by copyright.
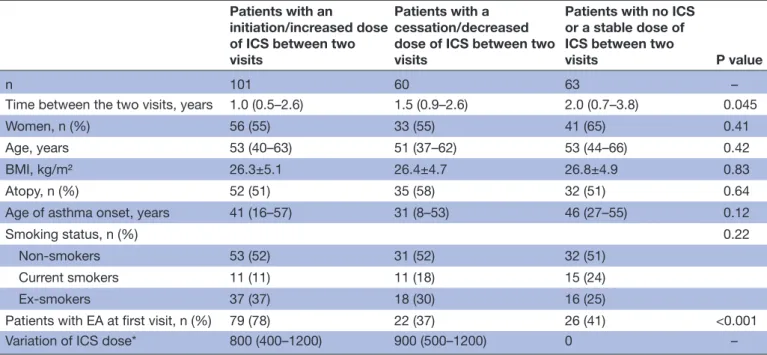
Table 1 Subjects’ characteristics
Patients with an
initiation/increased dose of ICS between two visits
Patients with a cessation/decreased dose of ICS between two visits
Patients with no ICS or a stable dose of ICS between two
visits P value
n 101 60 63 –
Time between the two visits, years 1.0 (0.5–2.6) 1.5 (0.9–2.6) 2.0 (0.7–3.8) 0.045
Women, n (%) 56 (55) 33 (55) 41 (65) 0.41
Age, years 53 (40–63) 51 (37–62) 53 (44–66) 0.42
BMI, kg/m² 26.3±5.1 26.4±4.7 26.8±4.9 0.83
Atopy, n (%) 52 (51) 35 (58) 32 (51) 0.64
Age of asthma onset, years 41 (16–57) 31 (8–53) 46 (27–55) 0.12
Smoking status, n (%) 0.22
Non-smokers 53 (52) 31 (52) 32 (51)
Current smokers 11 (11) 11 (18) 15 (24)
Ex-smokers 37 (37) 18 (30) 16 (25)
Patients with EA at first visit, n (%) 79 (78) 22 (37) 26 (41) <0.001
Variation of ICS dose* 800 (400–1200) 900 (500–1200) 0 –
*ICS dose expressed in beclomethasone chlorofluorocarbon (CFC) equivalents. BMI, body mass index; EA, eosinophilic asthma; ICS, inhaled corticosteroid.
results
subjects’ characteristics
Demographic characteristics of patients are given in
table 1. The three groups were well matched regarding sex, age, body mass index, atopy, age of asthma onset and smoking status. The median time between two visits ranged from 1 to 2 years. The median increase in the ICS dose was 800 µg beclomethasone equivalent dose per day, while the median decrease was 900 µg beclomethasone equivalent dose per day.
effect of an initiation/increased dose of Ics between two visits
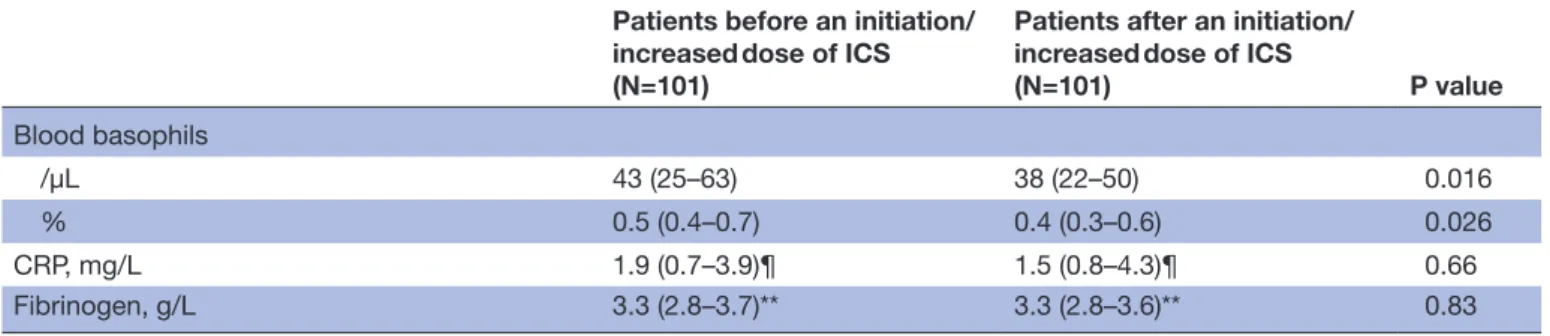
The effects of an initiation (n=44)/increased dose (n=57) of ICS between two visits in the whole cohort are shown in table 2. There was a significant improvement in asthma control, asthma quality of life and airway hyper-responsiveness to methacholine by more than one doubling dilution. Initiating or increasing the dose of ICS led to a highly significant decrease of 57% in FENO and 80% in absolute sputum eosinophils. There was also a slight but significant reduction in absolute blood eosinophils (19%), lymphocytes (8%) and baso-phils (12%).
effect of a cessation/decreased dose of Ics between two visits
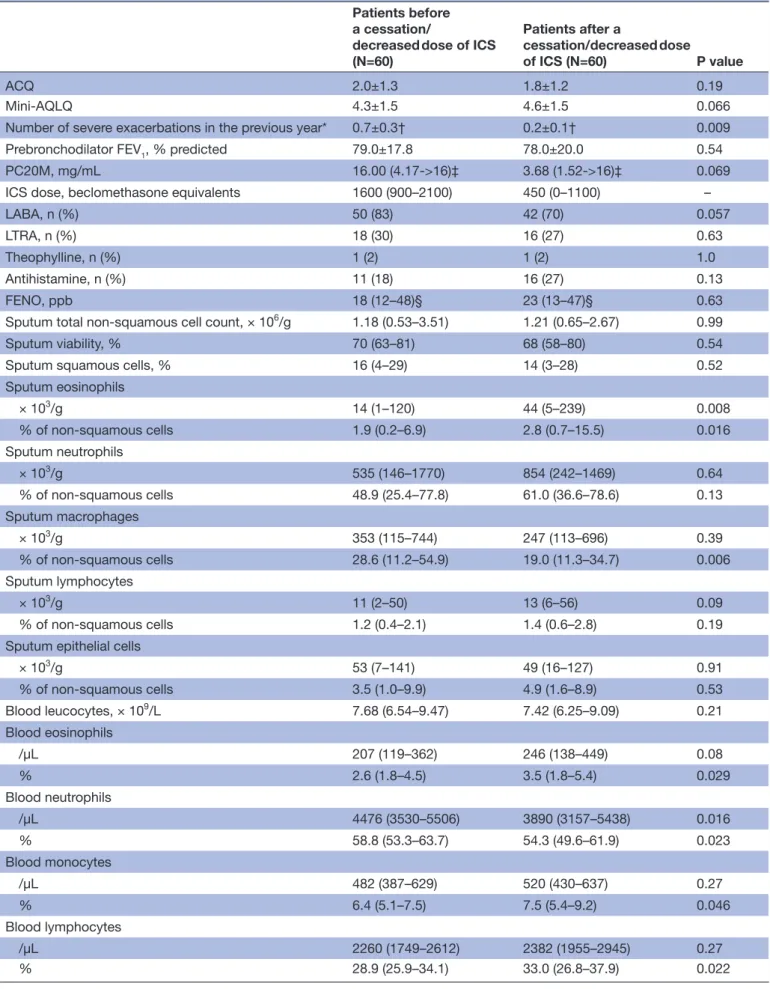
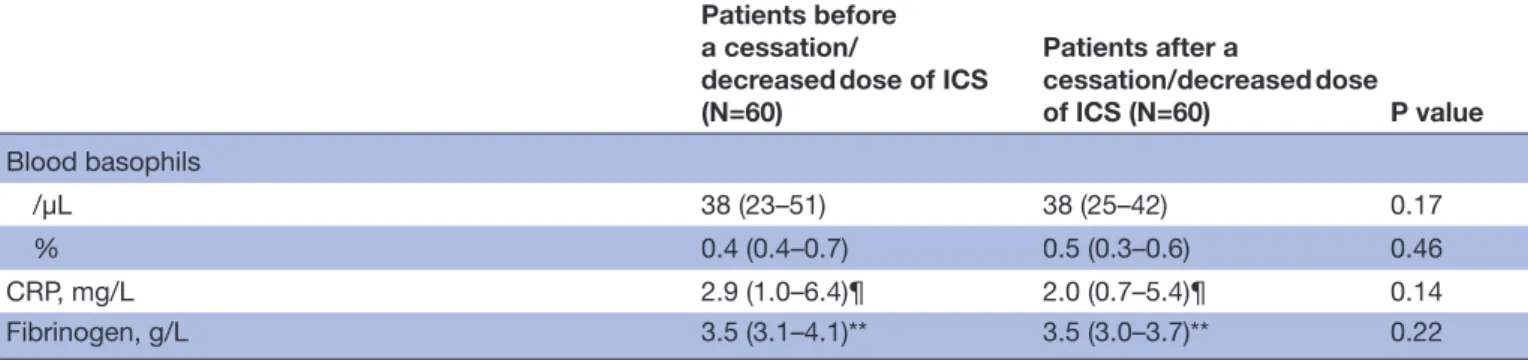
In the whole cohort (table 3), withdrawing (n=18) or decreasing (n=42) the dose of ICS led to a signifi-cant selective threefold increase in absolute sputum eosinophils and a slight decrease in absolute blood neutrophils (13%).
Analysis in patients with no Ics or the same dose of Ics between two visits
In patients with no ICS (n=20) or the same dose of ICS (n=43) between two visits (table 4), there was no statisti-cally significant change in clinical outcomes and absolute sputum and blood cells over time.
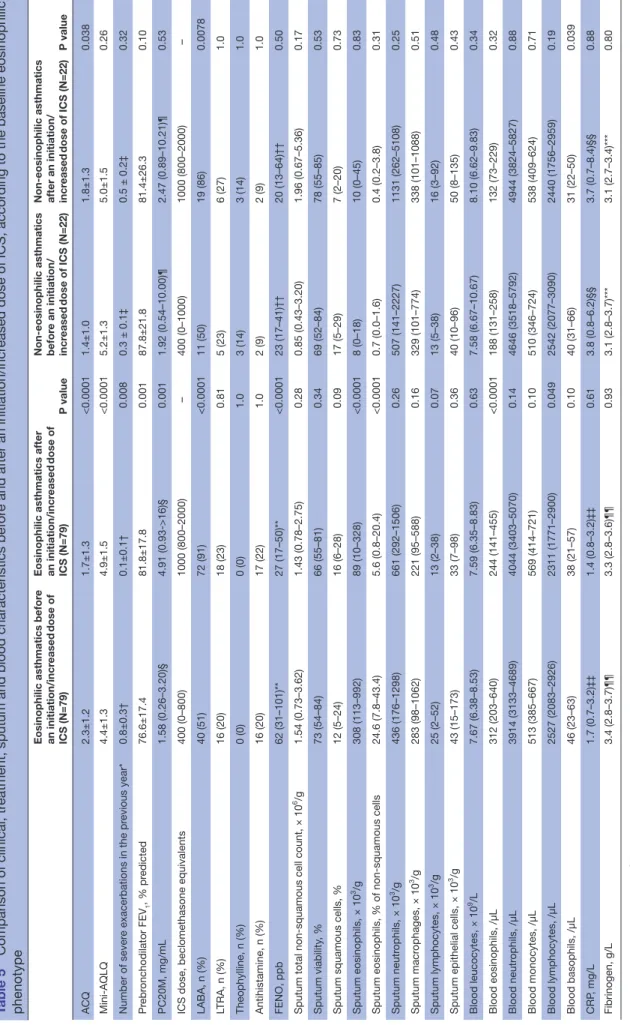
effect of an initiation/increased dose of Ics between two visits according to the baseline eosinophilic phenotype After initiating (n=35) or increasing (n=44) ICS, eosin-ophilic asthmatics showed a significant improvement in asthma control, quality of life and FEV1 together with a reduction of bronchial hyper-responsiveness and severe exacerbations (table 5). A higher use of long-acting β2 agonists (LABA) was also concomitant with the initia-tion/increase of ICS. As for the sputum and blood cells, there was a decreased number of sputum eosinophils, blood eosinophils and blood lymphocytes (table 5). When excluding patients with an initiation of LABA from the analysis, there was still a statistically significant improvement (P<0.05) in ACQ (2.6±1.2 to 2.2±1.3), mini-AQLQ (4.0±1.4 to 4.3±1.5), severe exacerbation number (0.7±0.3 to 0.1±0.1), PC20M (1.03 (0.30–3.82) to 3.11 (1.14–8.25) mg/mL), FENO (60 (24–95) to 24 (14–52) parts per billion), sputum eosinophils (282 (82–992) to 113 (15–474) × 103/g and 27.0 (8.0–43.4) to 6.3 (1.3–20.4)%) and blood eosinophils (354 (217–659) to 293 (141–459))/µL). In this subgroup, there was also a marginal significance for an increase in FEV1 (76.6±18.7 to 79.7%±21.5% predicted, P=0.10) and a decrease in blood lymphocytes (2462 (2119–2949) to 2287 (1779–2948)/µL, P=0.058).
on 16 August 2018 by guest. Protected by copyright.
Table 2 Comparison of clinical, treatment, sputum and blood characteristics before and after an initiation/increased dose of ICS
Patients before an initiation/ increased dose of ICS (N=101)
Patients after an initiation/ increased dose of ICS
(N=101) P value
ACQ 2.1±1.2 1.7±1.3 0.003
Mini-AQLQ 4.6±1.4 4.9±1.5 0.0008
Number of severe exacerbations in the previous
year* 0.6±0.2† 0.2±0.1† 0.10
Prebronchodilator FEV1, % predicted 79.1±18.9 81.7±19.8 0.08
PC20M, mg/mL 1.58 (0.30–3.82)‡ 3.42 (0.93–>16)‡ 0.001
ICS dose, beclomethasone equivalents 400 (0–800) 1000 (800–2000) –
LABA, n (%) 51 (51) 91 (90) <0.0001
LTRA, n (%) 21 (21) 24 (24) 0.65
Theophylline, n (%) 3 (3) 3 (3) 1.0
Antihistamine, n (%) 18 (18) 19 (19) 1.0
FENO, ppb 60 (24–98)§ 26 (16–52)§ <0.0001
Sputum total non-squamous cell count, × 106/g 1.48 (0.66–3.56) 1.46 (0.72–3.09) 0.81
Sputum viability, % 72 (54–84) 68 (55–82) 0.67
Sputum squamous cells, % 13 (5–24) 14 (5–28) 0.22
Sputum eosinophils × 103/g 221 (43–696) 45 (7–266) <0.0001 % of non-squamous cells 13.2 (3.8–36.0) 3.8 (0.4–15.4) <0.0001 Sputum neutrophils × 103/g 460 (171–1352) 744 (286–1697) 0.13 % of non-squamous cells 38.6 (20.2–64.4) 59.8 (37.6–79.4) <0.0001 Sputum macrophages × 103/g 302 (99–957) 253 (98–642) 0.40 % of non-squamous cells 22.8 (9.6–34.8) 18.8 (8.8–31.8) 0.22 Sputum lymphocytes × 103/g 21 (2–52) 13 (2–39) 0.21 % of non-squamous cells 1.2 (0.4–2.4) 1.2 (0.2–2.5) 0.83
Sputum epithelial cells
× 103/g 41 (14–152) 37 (8–119) 0.73 % of non-squamous cells 3.4 (1.4–6.8) 2.6 (1.0–7.6) 0.57 Blood leucocytes, × 109/L 7.66 (6.47–8.77) 7.59 (6.47–9.04) 0.37 Blood eosinophils /µL 272 (185–509) 221 (122–413) <0.0001 % 3.8 (2.3–5.7) 2.9 (1.6–5.6) <0.0001 Blood neutrophils /µL 3976 (3201–4895) 4098 (3466–5344) 0.25 % 53.4 (46.6–58.8) 54.8 (50.4–62.4) 0.0007 Blood monocytes /µL 513 (385–668) 559 (414–692) 0.22 % 6.5 (5.3–8.2) 7.1 (5.7–8.6) 0.046 Blood lymphocytes /µL 2527(2083–2926) 2329 (1771–2900) 0.021 % 33.2 (26.6–38.0) 31.3 (26.1–36.9) 0.061 Continued
on 16 August 2018 by guest. Protected by copyright.
Patients before an initiation/ increased dose of ICS (N=101)
Patients after an initiation/ increased dose of ICS
(N=101) P value Blood basophils /µL 43 (25–63) 38 (22–50) 0.016 % 0.5 (0.4–0.7) 0.4 (0.3–0.6) 0.026 CRP, mg/L 1.9 (0.7–3.9)¶ 1.5 (0.8–4.3)¶ 0.66 Fibrinogen, g/L 3.3 (2.8–3.7)** 3.3 (2.8–3.6)** 0.83
*Data are presented as mean±SEM.
Data available for both visits in: †35, ‡27, §91, ¶69 and **64 patients.
ACQ, Asthma Control Questionnaire; AQLQ, Asthma Quality of Life Questionnaire; CRP, C reactive protein; FENO, fractional
exhaled nitric oxide; FEV1, forced expiratory volume in 1 s; ICS, inhaled corticosteroid; LABA, long-acting β2 agonist; LTRA,
leukotriene receptor antagonist; PC20M, provocative concentration of methacholine causing a 20% fall in FEV1; ppb, parts
per billion.
Table 2 Continued
In non-eosinophilic asthmatics, initiating (n=9) or increasing (n=13) ICS was associated with a worsening in ACQ (see table 6 for the effect on each question score) despite an increased usage of LABA, and overall no change in sputum and blood cells, except for a selective reduction in absolute blood basophils (table 5). When excluding patients with an initiation of LABA from the analysis, the effect on ACQ (1.7±1.0 to 2.3±1.2) and blood basophils (43 (35–78) to 31 (23–47)/µL) was still statisti-cally significant (P<0.05).
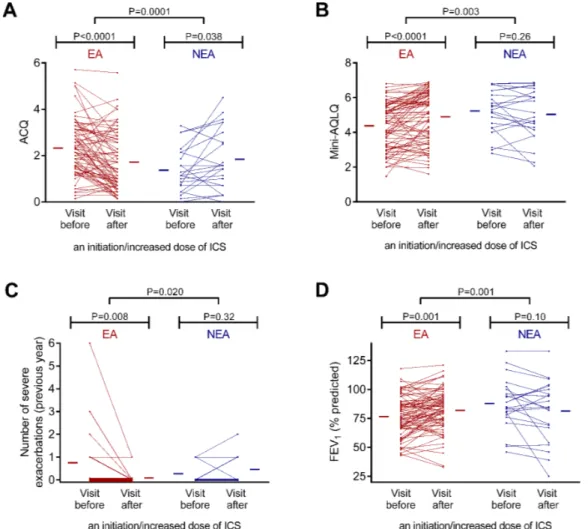
Overall, the effect of an initiation/increased dose of ICS on asthma control, quality of life, exacerbation rate and FEV1 was statistically different between eosinophilic and non-eosinophilic asthmatics (figure 1).
effect of a cessation/decreased dose of Ics between two visits according to the baseline eosinophilic phenotype
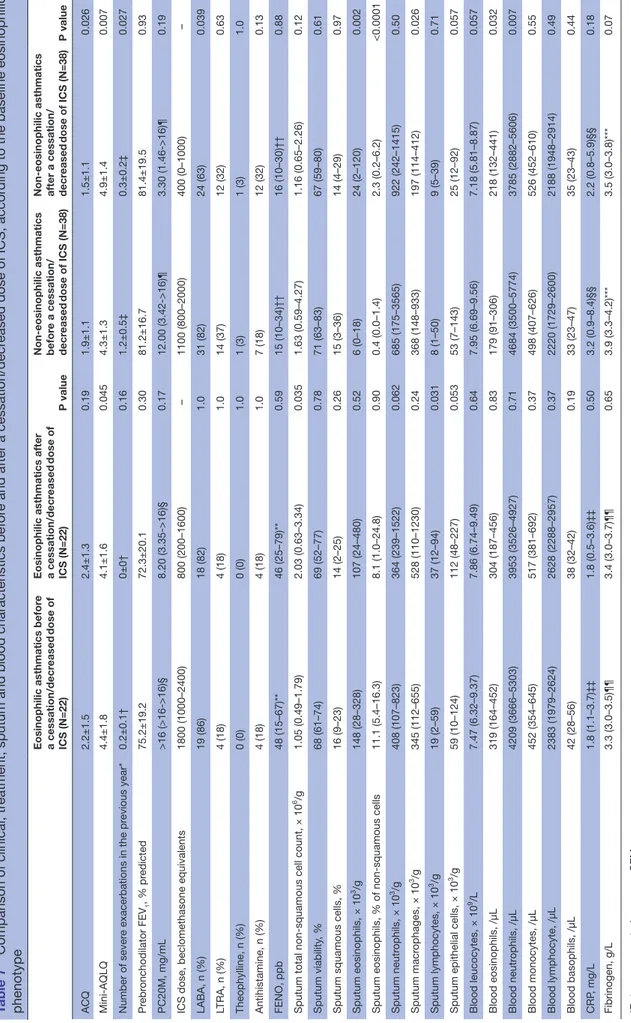
In patients with eosinophilia, withdrawing (n=5) or decreasing (n=17) the dose of ICS resulted in a wors-ening of asthma quality of life, together with an increase in sputum total cell count and sputum lymphocytes (table 7).
In non-eosinophilic asthmatics, withdrawing (n=13) or decreasing (n=25) the dose of ICS was associated with an improvement in asthma control and asthma quality of life as well as a reduction in the rate of severe exacerba-tions, despite a decreased usage of LABA (table 7). They also showed an increased number of sputum and blood eosinophils and a decreased number of sputum macro-phages and blood neutrophils (table 7). When excluding patients with a cessation of LABA from the analysis, there was still a statistically significant effect (P<0.05) on ACQ (1.8±1.1 to 1.4±1.0), mini-AQLQ (4.6±1.3 to 5.1±1.3), severe exacerbation number (1.1±0.5 to 0.4±0.3), sputum eosinophils (9 (0–18) to 42 (9–128) × 103/g and 0.4 (0.0–1.8) to 2.8 (0.8–12.6)%), sputum macrophages (410 (148–933) to 219 (120–412) × 103/g), blood eosinophils (188 (91–306) to 258 (148–453)/µL) and blood neutro-phils (4816 (3414–5774) to 3785 (2811–5419)/µL).
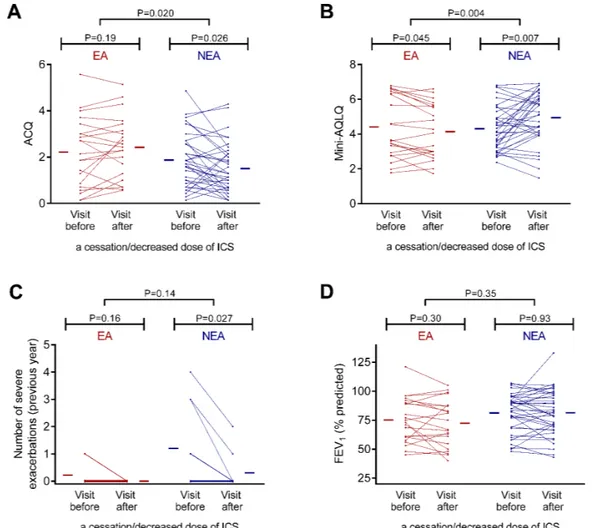
Overall, the effect of a cessation/decreased dose of ICS on asthma control and asthma quality of life was statisti-cally different between eosinophilic and non-eosinophilic asthmatics (figure 2).
DIscussIOn
To the best of our knowledge, our data are the first to provide evidence of effectiveness of ICS on airway and blood inflammation in real life. Initiating or increasing ICS in asthmatics sharply reduces sputum eosinophils and to a lesser extent blood eosinophils. Our data also show that effectiveness of ICS in reducing symptoms, improving quality of life and lung function and decreasing exacerbations is essentially observed in the eosinophilic asthma phenotype. On the other hand, our data suggest that stepping-down ICS in non-eosinophilic asthma may actually improve symptoms and quality of life and even reduce the exacerbation rate.
We provide here convincing evidence that ICS are powerful drugs to reduce airway eosinophilic inflam-mation in clinical practice. As previously shown,6 11 we
found that initiating/increasing the dose of ICS resulted in a greater decrease in sputum than in blood eosino-phils. Whether this effect on blood eosinophils reflects a systemic action of ICS (by absorption through the lungs and gastrointestinal tract)25 or is a consequence of the
local inhibition of IL-5 production/release26 remains to
be elucidated. Whichever the reason, our results clearly show the preferential effect of ICS on the airway compart-ment. As opposed to what was observed after initiating/ increasing the dose, a cessation/reduction in the dose of ICS resulted in an increase in sputum eosinophils, which is consistent with previous studies.8 9 At the systemic level,
we noticed a significant reduction in the amount of circu-lating blood neutrophils when decreasing the dose of ICS, maybe explained by the inhibitory effect of corticoste-roids on neutrophil adhesion to endothelial cells.27 The
lack of change in absolute sputum and circulating cells
on 16 August 2018 by guest. Protected by copyright.
Table 3 Comparison of clinical, treatment, sputum and blood characteristics before and after a cessation/decreased dose of ICS
Patients before a cessation/
decreased dose of ICS (N=60) Patients after a cessation/decreased dose of ICS (N=60) P value ACQ 2.0±1.3 1.8±1.2 0.19 Mini-AQLQ 4.3±1.5 4.6±1.5 0.066
Number of severe exacerbations in the previous year* 0.7±0.3† 0.2±0.1† 0.009
Prebronchodilator FEV1, % predicted 79.0±17.8 78.0±20.0 0.54
PC20M, mg/mL 16.00 (4.17->16)‡ 3.68 (1.52->16)‡ 0.069
ICS dose, beclomethasone equivalents 1600 (900–2100) 450 (0–1100) –
LABA, n (%) 50 (83) 42 (70) 0.057
LTRA, n (%) 18 (30) 16 (27) 0.63
Theophylline, n (%) 1 (2) 1 (2) 1.0
Antihistamine, n (%) 11 (18) 16 (27) 0.13
FENO, ppb 18 (12–48)§ 23 (13–47)§ 0.63
Sputum total non-squamous cell count, × 106/g 1.18 (0.53–3.51) 1.21 (0.65–2.67) 0.99
Sputum viability, % 70 (63–81) 68 (58–80) 0.54
Sputum squamous cells, % 16 (4–29) 14 (3–28) 0.52
Sputum eosinophils × 103/g 14 (1–120) 44 (5–239) 0.008 % of non-squamous cells 1.9 (0.2–6.9) 2.8 (0.7–15.5) 0.016 Sputum neutrophils × 103/g 535 (146–1770) 854 (242–1469) 0.64 % of non-squamous cells 48.9 (25.4–77.8) 61.0 (36.6–78.6) 0.13 Sputum macrophages × 103/g 353 (115–744) 247 (113–696) 0.39 % of non-squamous cells 28.6 (11.2–54.9) 19.0 (11.3–34.7) 0.006 Sputum lymphocytes × 103/g 11 (2–50) 13 (6–56) 0.09 % of non-squamous cells 1.2 (0.4–2.1) 1.4 (0.6–2.8) 0.19
Sputum epithelial cells
× 103/g 53 (7–141) 49 (16–127) 0.91 % of non-squamous cells 3.5 (1.0–9.9) 4.9 (1.6–8.9) 0.53 Blood leucocytes, × 109/L 7.68 (6.54–9.47) 7.42 (6.25–9.09) 0.21 Blood eosinophils /µL 207 (119–362) 246 (138–449) 0.08 % 2.6 (1.8–4.5) 3.5 (1.8–5.4) 0.029 Blood neutrophils /µL 4476 (3530–5506) 3890 (3157–5438) 0.016 % 58.8 (53.3–63.7) 54.3 (49.6–61.9) 0.023 Blood monocytes /µL 482 (387–629) 520 (430–637) 0.27 % 6.4 (5.1–7.5) 7.5 (5.4–9.2) 0.046 Blood lymphocytes /µL 2260 (1749–2612) 2382 (1955–2945) 0.27 % 28.9 (25.9–34.1) 33.0 (26.8–37.9) 0.022 Continued
on 16 August 2018 by guest. Protected by copyright.
Patients before a cessation/
decreased dose of ICS (N=60) Patients after a cessation/decreased dose of ICS (N=60) P value Blood basophils /µL 38 (23–51) 38 (25–42) 0.17 % 0.4 (0.4–0.7) 0.5 (0.3–0.6) 0.46 CRP, mg/L 2.9 (1.0–6.4)¶ 2.0 (0.7–5.4)¶ 0.14 Fibrinogen, g/L 3.5 (3.1–4.1)** 3.5 (3.0–3.7)** 0.22
*Data are presented as mean±SEM.
Data available for both visits in: †19, ‡16, §50, ¶32 and **28 patients.
ACQ, Asthma Control Questionnaire; AQLQ, Asthma Quality of Life Questionnaire; CRP, C reactive protein; FENO, fractional
exhaled nitric oxide; FEV1, forced expiratory volume in 1 s; ICS, inhaled corticosteroid; LABA, long-acting β2 agonist; LTRA,
leukotriene receptor antagonist; PC20M, provocative concentration of methacholine causing a 20% fall in FEV1; ppb, parts
per billion.
Table 3 Continued
in the group of patients not receiving ICS or keeping the same dose of ICS between two visits (the control group) further supports the role of ICS in the changes found in the two preceding groups.
It is worth noting that neither the increase nor the decrease of ICS had an impact on markers of systemic inflammation like CRP or fibrinogen. This contrasts what has been shown in some28 29 but not all30 studies in which
ICS were suggested to reduce the CRP levels in patients with chronic obstructive pulmonary disease (COPD). This might be explained by the fact that CRP levels are higher in patients with COPD as compared with asthmatics, thereby leaving room for a decrease with a drug interven-tion. In patients with asthma, Takemura et al found that corticosteroid-naive, but not corticosteroid-treated asth-matics had higher CRP levels than control subjects,31 but
evidence from longitudinal studies is lacking.
A strength of our study is that our data further high-light the importance of baseline eosinophilic pheno-type in the response to ICS.10 14 Initiating or increasing
the dose of ICS essentially provides clinical benefit in patients with baseline sputum eosinophils≥3%. In this group of patients, we observed a clear improvement in asthma control, asthma quality of life, baseline airway calibre as well as a reduction in bronchial hyper-respon-siveness. Furthermore, there was also a marked reduction in the number of severe exacerbations recorded in the year prior to the visit. The average improvement in ACQ and mini-AQLQ reached at least 0.5, which is the indi-vidual minimal important difference accepted for these questionnaires.20 32 Likewise, the improvement in
bron-chial hyper-responsiveness was above one doubling dilu-tion, which is generally considered as clinically relevant.21
The mean annual rate of severe exacerbations fell from 0.8 to 0.1 per patient, yielding an 88% reduction. These results are consistent with previous studies showing that adjusting treatment with ICS to normalise the sputum eosinophil count resulted in a decrease in severe asthma exacerbations33 34 and with the fact that asthma control
fluctuates with sputum eosinophils over time.23 We believe
that sputum eosinophils are both a predictor of response to ICS and a therapeutic target of ICS.35 Contrasting with
the clear effects observed in eosinophilic asthmatics, patients with a sputum eosinophil count less than 3% at baseline did not show any clinical benefit of an initi-ation or an increase in the dose of ICS, and there was even a hint for a symptomatic deterioration of patients as there was a significant increase in ACQ between the two visits (accounted for by a raised frequency of nocturnal awakening due to asthma and an increased reliever use). This would suggest that it is useless to decide for a rise in ICS dosage in uncontrolled non-eosinophilic asthmatics. Therefore, these results emphasise the importance to assess the level of airway eosinophilic inflammation in clinical practice before treating patients with ICS, in order to reduce as much as possible inappropriate treat-ment with corticosteroids.36 37
Our study also demonstrates that decreasing the dose of ICS in non-eosinophilic asthmatics may actually result in an improvement in asthma control and quality of life, maybe partly linked to the reduction of local side effects of ICS, like cough, pharyngitis or dysphonia.38 Surprisingly,
there was also a reduction in exacerbation rate, although this should be taken with caution because of the limited number of subjects in whom the parameter was assessed (n=10). These results are consistent with the finding of Green et al showing in a subgroup analysis that it was possible to reduce the dose of ICS in non-eosinophilic asthmatics without any deterioration in asthma control.33
In eosinophilic asthmatics, a reduction of ICS did not result in a dramatic rise in eosinophilic inflammation. Similarly, apart from a mild deterioration in quality of life, there was no impact of the ICS reduction on asthma control, baseline airway calibre and exacerbation rate. This might be explained by the fact that most patients in whom ICS were stepped down had a high dosage at baseline and were kept on a low-to-medium dose of ICS after the reduction, at which most of the benefits occur.39
on 16 August 2018 by guest. Protected by copyright.
Table 4 Comparison of clinical, treatment, sputum and blood characteristics between two visits with no ICS or a stable dose of ICS
Patients with no ICS or a stable dose of
ICS, visit 1 (N=63) Patients with no ICS or a stable dose of ICS, visit 2 (N=63) P value
ACQ 1.7±1.1 1.7±1.2 0.91
Mini-AQLQ 4.7±1.3 4.8±1.5 0.42
Number of severe exacerbations in the previous year* 0.8±0.3† 0.7±0.3† 0.52
Prebronchodilator FEV1, % predicted 87.1±18.9 87.4±19.9 0.85
PC20M, mg/mL 2.62 (0.60–14.97)‡ 2.99 (0.20->16)‡ 0.94
ICS dose, beclomethasone equivalents 800 (0–2000) 800 (0–2000) –
LABA, n (%) 42 (67) 44 (70) 0.69
LTRA, n (%) 14 (22) 15 (24) 1.0
Theophylline, n (%) 2 (3) 2 (3) 1.0
Antihistamine, n (%) 13 (21) 11 (17) 0.75
FENO, ppb 26 (14-48)§ 24 (12-48)§ 0.93
Sputum total non-squamous cell count, × 106/g 1.10 (0.45–2.40) 1.29 (0.43–2.53) 0.64
Sputum viability, % 66 (47–80) 63 (49–80) 0.90
Sputum squamous cells, % 15 (7–28) 16 (3–32) 0.86
Sputum eosinophils × 103/g 18 (2–168) 36 (3–149) 0.78 % of non-squamous cells 1.6 (0.2–17.8) 1.8 (0.5–13.0) 0.53 Sputum neutrophils × 103/g 468 (144–1954) 497 (214–1270) 0.99 % of non-squamous cells 45.0 (26.6–76.0) 61.0 (33.6–81.0) 0.041 Sputum macrophages × 103/g 222 (122–663) 237 (74–516) 0.09 % of non-squamous cells 23.2 (13.4–46.6) 20.0 (9.8–34.0) 0.011 Sputum lymphocytes × 103/g 11 (2–35) 10 (1–34) 0.52 % of non-squamous cells 1.2 (0.4–2.8) 0.8 (0.3–1.8) 0.17
Sputum epithelial cells
× 103/g 50 (16–95) 36 (10–96) 0.83 % of non-squamous cells 5.2 (1.6–9.8) 2.6 (1.0–9.5) 0.52 Blood leucocytes, × 109/L 7.82 (6.70–8.94) 8.03 (6.52–9.15) 0.62 Blood eosinophils /µL 198 (132–342) 248 (120–471) 0.10 % 2.7 (1.6–4.3) 2.9 (1.6–6.8) 0.09 Blood neutrophils /µL 4221 (3473–5177) 4380 (3540–5395) 0.80 % 55.5 (50.4–61.0) 55.9 (49.5–63.6) 0.96 Blood monocytes /µL 568 (413–672) 543 (402–702) 0.49 % 6.9 (5.1–8.9) 6.9 (5.3–8.3) 0.91 Blood lymphocytes /µL 2520 (2091–2900) 2404 (1932–2873) 0.28 % 31.4 (26.9–35.7) 30.1 (24.2–36.1) 0.27 Blood basophils /µL 38 (23–53) 38 (23–53) 0.69 % 0.5 (0.3–0.6) 0.5 (0.3–0.7) 0.91 CRP, mg/L 1.5 (0.7–3.8)¶ 2.4 (0.8–5.3)¶ 0.33 Fibrinogen, g/L 3.6 (3.1–3.8)** 3.7 (3.3–4.4)** 0.10
*Data are presented as mean±SEM.
Data available for both visits in: †26, ‡24, §54, ¶41 and **36 patients.
ACQ, Asthma Control Questionnaire; AQLQ, Asthma Quality of Life Questionnaire; CRP, C reactive protein; FENO, fractional exhaled nitric oxide; FEV1, forced expiratory volume in 1 s; ICS, inhaled corticosteroid; LABA, long-acting β2 agonist; LTRA, leukotriene receptor antagonist; PC20M, provocative concentration of methacholine causing a
20% fall in FEV1; ppb, parts per billion.
on 16 August 2018 by guest. Protected by copyright.
Table 5
Comparison of clinical, tr
eatment, sputum and blood characteristics befor
e and after an initiation/incr
eased dose of ICS, accor
ding to the baseline eosinophilic
phenotype
Eosinophilic asthmatics befor
e
an initiation/incr
eased
dose of
ICS (N=79)
Eosinophilic asthmatics after an initiation/incr
eased
dose of
ICS (N=79)
P value
Non-eosinophilic asthmatics befor
e an initiation/
incr
eased
dose of ICS (N=22)
Non-eosinophilic asthmatics after an initiation/ incr
eased dose of ICS (N=22) P value ACQ 2.3±1.2 1.7±1.3 <0.0001 1.4±1.0 1.8±1.3 0.038 Mini-AQLQ 4.4±1.3 4.9±1.5 <0.0001 5.2±1.3 5.0±1.5 0.26 Number of sever e exacerbations in the pr evious year* 0.8±0.3† 0.1±0.1† 0.008 0.3 ± 0.1‡ 0.5 ± 0.2‡ 0.32 Pr ebr onchodilator FEV 1 , % pr edicted 76.6±17.4 81.8±17.8 0.001 87.8±21.8 81.4±26.3 0.10 PC20M, mg/mL 1.58 (0.26–3.20)§ 4.91 (0.93->16)§ 0.001 1.92 (0.54–10.00)¶ 2.47 (0.89–10.21)¶ 0.53
ICS dose, beclomethasone equivalents
400 (0–800) 1000 (800–2000) – 400 (0–1000) 1000 (800–2000) – LABA, n (%) 40 (51) 72 (91) <0.0001 11 (50) 19 (86) 0.0078 LTRA, n (%) 16 (20) 18 (23) 0.81 5 (23) 6 (27) 1.0 Theophylline, n (%) 0 (0) 0 (0) 1.0 3 (14) 3 (14) 1.0 Antihistamine, n (%) 16 (20) 17 (22) 1.0 2 (9) 2 (9) 1.0 FENO, ppb 62 (31–101)** 27 (17–50)** <0.0001 23 (17–41)†† 20 (13–64)†† 0.50
Sputum total non-squamous cell count, × 10
6/g 1.54 (0.73–3.62) 1.43 (0.78–2.75) 0.28 0.85 (0.43–3.20) 1.96 (0.67–5.36) 0.17 Sputum viability , % 73 (54–84) 66 (55–81) 0.34 69 (52–84) 78 (55–85) 0.53
Sputum squamous cells, %
12 (5–24) 16 (6–28) 0.09 17 (5–29) 7 (2–20) 0.73 Sputum eosinophils, × 10 3/g 308 (113–992) 89 (10–328) <0.0001 8 (0–18) 10 (0–45) 0.83
Sputum eosinophils, % of non-squamous cells
24.6 (7.8–43.4) 5.6 (0.8–20.4) <0.0001 0.7 (0.0–1.6) 0.4 (0.2–3.8) 0.31 Sputum neutr ophils, × 10 3/g 436 (176–1298) 661 (292–1506) 0.26 507 (141–2227) 1131 (262–5108) 0.25 Sputum macr ophages, × 10 3/g 283 (98–1062) 221 (95–588) 0.16 329 (101–774) 338 (101–1088) 0.51 Sputum lymphocytes, × 10 3/g 25 (2–52) 13 (2–38) 0.07 13 (5–38) 16 (3–92) 0.48
Sputum epithelial cells, × 10
3/g 43 (15–173) 33 (7–98) 0.36 40 (10–96) 50 (8–135) 0.43 Blood leucocytes, × 10 9/L 7.67 (6.38–8.53) 7.59 (6.35–8.83) 0.63 7.58 (6.67–10.67) 8.10 (6.62–9.83) 0.34 Blood eosinophils, /µL 312 (203–640) 244 (141–455) <0.0001 188 (131–258) 132 (73–229) 0.32 Blood neutr ophils, /µL 3914 (3133–4689) 4044 (3403–5070) 0.14 4646 (3518–5792) 4944 (3824–5827) 0.88 Blood monocytes, /µL 513 (385–667) 569 (414–721) 0.10 510 (346–724) 538 (409–624) 0.71 Blood lymphocytes, /µL 2527 (2083–2926) 2311 (1771–2900) 0.049 2542 (2077–3090) 2440 (1756–2959) 0.19 Blood basophils, /µL 46 (23–63) 38 (21–57) 0.10 40 (31–66) 31 (22–50) 0.039 CRP , mg/L 1.7 (0.7–3.2)‡‡ 1.4 (0.8–3.2)‡‡ 0.61 3.8 (0.8–6.2)§§ 3.7 (0.7–8.4)§§ 0.88 Fibrinogen, g/L 3.4 (2.8–3.7)¶¶ 3.3 (2.8–3.6)¶¶ 0.93 3.1 (2.8–3.7)*** 3.1 (2.7–3.4)*** 0.80 *Data ar e pr
esented as mean ±SEM.
Data available for both visits in: †24,‡11, §19,¶ 8, **73,††18, ‡‡57,§§12, ¶¶54, and ***10 patients. ACQ, Asthma Contr
ol Questionnair
e; AQLQ, Asthma Quality of Life Questionnair
e; CRP
, C r
eactive pr
otein; FENO, fractional exhaled nitric oxide; FEV
1
, for
ced expiratory volume in 1
s; ICS, inhaled corticoster
oid; LABA, long-acting β2 agonist; L TRA, leukotriene r eceptor antagonist; PC20M, pr
ovocative concentration of methacholine causing a 20% fall in FEV
1
; ppb, parts per billion.
on 16 August 2018 by guest. Protected by copyright.
Table 6 Detailed analysis of the score for each ACQ question before and after an initiation/increased dose of ICS in non-eosinophilic asthmatics
ACQ questions (score ranging from 0 to 6 for each question)19
Non-eosinophilic asthmatics before an initiation/
increased dose of ICS (n=22)
Non-eosinophilic asthmatics after an initiation/
increased dose of ICS
(n=22) P value
1. Frequency of nocturnal awakening due to asthma 0.5±1.1 1.3±1.6 0.039
2. Severity of asthma symptoms when waking 1.4±1.3 1.7±1.3 0.34
3. Limitation in activities 1.6±1.4 1.9±1.6 0.16
4. Frequency of shortness of breath 2.1±1.4 2.3±1.8 0.51
5. Frequency of wheeze 1.5±1.3 2.1±1.6 0.13
6. Frequency of short-acting β2 agonist use 0.6±0.8 1.3±1.5 0.015
7. Prebronchodilator FEV1 (% predicted) 1.9±1.8 2.3±2.2 0.27
ACQ, Asthma Control Questionnaire; FEV1, forced expiratory volume in 1 s; ICS, inhaled corticosteroid.
Figure 1 Comparison of the effect of an initiation/increased dose of inhaled corticosteroid (ICS) on (A) Asthma Control Questionnaire (ACQ), (B) mini-Asthma Quality of Life Questionnaire (mini-AQLQ), (C) severe exacerbation rate and (D) forced
expiratory volume in 1 s (FEV1) in eosinophilic and non-eosinophilic asthmatics. The red and blue horizontal lines represent the
mean values in eosinophilic and non-eosinophilic asthmatics, respectively. EA, eosinophilic asthma; NEA, non-eosinophilic asthma.
Determining the eosinophilic or non-eosinophilic phenotype is not widely available in clinical practice because the technique of induced sputum is tech-nically demanding and time-consuming. While its
implementation may be possible in secondary care centres, we acknowledge that it would be impracticable in primary care centres. However, when the technique of induced sputum is not available, several user-friendly
on 16 August 2018 by guest. Protected by copyright.
Table 7
Comparison of clinical, tr
eatment, sputum and blood characteristics befor
e and after a cessation/decr
eased dose of ICS, accor
ding to the baseline eosinophilic
phenotype
Eosinophilic asthmatics befor
e
a cessation/decr
eased
dose of
ICS (N=22)
Eosinophilic asthmatics after a cessation/decr
eased
dose of
ICS (N=22)
P value
Non-eosinophilic asthmatics befor
e a cessation/
decr
eased
dose of ICS (N=38)
Non-eosinophilic asthmatics after a cessation/ decr
eased dose of ICS (N=38) P value ACQ 2.2±1.5 2.4±1.3 0.19 1.9±1.1 1.5±1.1 0.026 Mini-AQLQ 4.4±1.8 4.1±1.6 0.045 4.3±1.3 4.9±1.4 0.007 Number of sever e exacerbations in the pr evious year* 0.2±0.1† 0±0† 0.16 1.2±0.5‡ 0.3±0.2‡ 0.027 Pr ebr onchodilator FEV 1 , % pr edicted 75.2±19.2 72.3±20.1 0.30 81.2±16.7 81.4±19.5 0.93 PC20M, mg/mL >16 (>16->16)§ 8.20 (3.35->16)§ 0.17 12.00 (3.42->16)¶ 3.30 (1.46->16)¶ 0.19
ICS dose, beclomethasone equivalents
1800 (1000–2400) 800 (200–1600) – 1100 (800–2000) 400 (0–1000) – LABA, n (%) 19 (86) 18 (82) 1.0 31 (82) 24 (63) 0.039 LTRA, n (%) 4 (18) 4 (18) 1.0 14 (37) 12 (32) 0.63 Theophylline, n (%) 0 (0) 0 (0) 1.0 1 (3) 1 (3) 1.0 Antihistamine, n (%) 4 (18) 4 (18) 1.0 7 (18) 12 (32) 0.13 FENO, ppb 48 (15–67)** 46 (25–79)** 0.59 15 (10–34)†† 16 (10–30)†† 0.88
Sputum total non-squamous cell count, × 10
6/g 1.05 (0.49–1.79) 2.03 (0.63–3.34) 0.035 1.63 (0.59–4.27) 1.16 (0.65–2.26) 0.12 Sputum viability , % 68 (61–74) 69 (52–77) 0.78 71 (63–83) 67 (59–80) 0.61
Sputum squamous cells, %
16 (9–23) 14 (2–25) 0.26 15 (3–36) 14 (4–29) 0.97 Sputum eosinophils, × 10 3/g 148 (28–328) 107 (24–480) 0.52 6 (0–18) 24 (2–120) 0.002
Sputum eosinophils, % of non-squamous cells
11.1 (5.4–16.3) 8.1 (1.0–24.8) 0.90 0.4 (0.0–1.4) 2.3 (0.2–6.2) <0.0001 Sputum neutr ophils, × 10 3/g 408 (107–823) 364 (239–1522) 0.062 685 (175–3565) 922 (242–1415) 0.50 Sputum macr ophages, × 10 3/g 345 (112–655) 528 (110–1230) 0.24 368 (148–933) 197 (114–412) 0.026 Sputum lymphocytes, × 10 3/g 19 (2–59) 37 (12–94) 0.031 8 (1–50) 9 (5–39) 0.71
Sputum epithelial cells, × 10
3/g 59 (10–124) 112 (48–227) 0.053 53 (7–143) 25 (12–92) 0.057 Blood leucocytes, × 10 9/L 7.47 (6.32–9.37) 7.86 (6.74–9.49) 0.64 7.95 (6.69–9.56) 7.18 (5.81–8.87) 0.057 Blood eosinophils, /µL 319 (164–452) 304 (187–456) 0.83 179 (91–306) 218 (132–441) 0.032 Blood neutr ophils, /µL 4209 (3666–5303) 3953 (3526–4927) 0.71 4684 (3500–5774) 3785 (2882–5606) 0.007 Blood monocytes, /µL 452 (354–645) 517 (381–692) 0.37 498 (407–626) 526 (452–610) 0.55 Blood lymphocyte, /µL 2383 (1979–2624) 2628 (2288–2957) 0.37 2220 (1729–2600) 2188 (1948–2914) 0.49 Blood basophils, /µL 42 (28–56) 38 (32–42) 0.19 33 (23–47) 35 (23–43) 0.44 CRP , mg/L 1.8 (1.1–3.7)‡‡ 1.8 (0.5–3.6)‡‡ 0.50 3.2 (0.9–8.4)§§ 2.2 (0.8–5.9)§§ 0.18 Fibrinogen, g/L 3.3 (3.0–3.5)¶¶ 3.4 (3.0–3.7)¶¶ 0.65 3.9 (3.3–4.2)*** 3.5 (3.0–3.8)*** 0.07 *Data ar e pr esented as mean±SEM.
Data available for both visits in: †9, ‡10, §3,¶13, **19,††31 ‡‡11, §§21, ¶¶10, and ***18 patients. ACQ, Asthma Contr
ol Questionnair
e; AQLQ, Asthma Quality of Life Questionnair
e; CRP
, C r
eactive pr
otein; FENO, fractional exhaled nitric oxide; FEV
1
, for
ced expiratory volume in 1
s; ICS, inhaled corticoster
oid; LABA, long-acting β2 agonist; L TRA, leukotriene r eceptor antagonist; PC20M, pr
ovocative concentration of methacholine causing a 20% fall in FEV
1
; ppb, parts per billion.
on 16 August 2018 by guest. Protected by copyright.
Figure 2 Comparison of the effect of a cessation/decreased dose of inhaled corticosteroid (ICS) on (A) Asthma Control Questionnaire (ACQ), (B) mini-Asthma Quality of Life Questionnaire (mini-AQLQ), (C) severe exacerbation rate and (D) forced
expiratory volume in 1 s (FEV1) in eosinophilic and non-eosinophilic asthmatics. The red and blue horizontal lines represent the
mean values in eosinophilic and non-eosinophilic asthmatics, respectively. EA, eosinophilic asthma; NEA, non-eosinophilic asthma.
surrogate markers might be used to predict the presence or absence of sputum eosinophilia, like FENO, blood eosinophils and total serum IgE.40 Moreover, it would be
worth investigating in large real-life studies the ability of those biomarkers to predict response to ICS by compar-ison with sputum eosinophils.
Being retrospective, our study has several limitations. Due to the variation in the delay between both visits and to the unknown adherence to treatment, the cumulative dose of ICS received by the patients before the investi-gation remains uncertain. A second limitation of our study is the fact that ICS were not the only drugs to be changed between both visits, as in the large majority of patients, ICS were combined with LABA which may also impact clinical outcomes. However, the fact that most results remained statistically significant when patients with variations in LABA use were excluded from the analysis enhances confidence in the findings. A third limitation of our study is that the reason why the dose of ICS was changed between both visits may be plural: it can either be related to a recommended strategic treatment choice by the chest physician or the general
practitioner, or linked to a loose adherence of patients to their treatment plan. Finally, we did not perform any formal sample size calculation in our study and we therefore acknowledge that the statistical power may be insufficient for several comparisons in our results.
To conclude, our results confirm the effectiveness of ICS on eosinophilic inflammation in real life and demon-strate the clinical benefit of initiating or raising the dose of ICS in eosinophilic asthma, but cast doubt on the clin-ical utility of stepping-up ICS in non-eosinophilic asthma. Our data also suggest that high dose of ICS can be safely stepped down in non-eosinophilic asthmatics. Overall, we believe that the benefits of ICS in non-eosinophilic asth-matics should be clarified in long-term prospective trials.
contributors SFD and REL were involved in the conception and design of the study. SFD, FNS, VAP, MAH and REL collected the patients’ data. SFD performed the statistical analysis. SFD, REL and TVH interpreted the data. SFD and REL drafted the manuscript. FNS, VAP, MAH and TVH revised the manuscript critically for important intellectual content. All authors read and approved the final manuscript.
Funding This work was supported by a federal grant IAP ('Interuniversity Attraction Poles' programme) P7/30.
on 16 August 2018 by guest. Protected by copyright.
competing interests TVH received grants from Amgen, outside the submitted work. REL received grants and personal fees from GSK, Chiesi, Astra Zeneca, Novartis, outside the submitted work.
ethics approval Ethics Committee of the University Hospital of Liege approved this study (reference 2017/97).
Provenance and peer review Not commissioned; externally peer reviewed. Data sharing statement No additional data are available.
Open Access This is an Open Access article distributed in accordance with the Creative Commons Attribution Non Commercial (CC BY-NC 4.0) license, which permits others to distribute, remix, adapt, build upon this work non-commercially, and license their derivative works on different terms, provided the original work is properly cited and the use is non-commercial. See: http:// creativecommons. org/ licenses/ by- nc/ 4. 0/
© Article author(s) (or their employer(s) unless otherwise stated in the text of the article) 2017. All rights reserved. No commercial use is permitted unless otherwise expressly granted.
reFerences
1. Barnes PJ. Efficacy of inhaled corticosteroids in asthma. J Allergy Clin Immunol 1998;102:531–8.
2. Louis R, Schleich F, Barnes PJ. Corticosteroids: still at the frontline in asthma treatment? Clin Chest Med 2012;33:531–41.
3. Aldridge RE, Hancox RJ, Robin Taylor D, et al. Effects of terbutaline and budesonide on sputum cells and bronchial hyperresponsiveness in asthma. Am J Respir Crit Care Med 2000;161:1459–64.
4. Cowan DC, Cowan JO, Palmay R, et al. Effects of steroid therapy on inflammatory cell subtypes in asthma. Thorax 2010;65:384–90. 5. Jayaram L, Pizzichini E, Lemière C, et al. Steroid naive eosinophilic
asthma: anti-inflammatory effects of fluticasone and montelukast. Thorax 2005;60:100–5.
6. Bacci E, Cianchetti S, Ruocco L, et al. Comparison between eosinophilic markers in induced sputum and blood in asthmatic patients. Clin Exp Allergy 1998;28:1237–43.
7. Basyigit I, Yildiz F, Kacar Ozkara S, et al. Effects of different anti-asthmatic agents on induced sputum and eosinophil cationic protein in mild asthmatics. Respirology 2004;9:514–20.
8. Deykin A, Lazarus SC, Fahy JV, et al. Sputum eosinophil counts predict asthma control after discontinuation of inhaled corticosteroids. J Allergy Clin Immunol 2005;115:720–7. 9. Jatakanon A, Lim S, Barnes PJ. Changes in sputum eosinophils
predict loss of asthma control. Am J Respir Crit Care Med 2000;161:64–72.
10. Bacci E, Cianchetti S, Bartoli M, et al. Low sputum eosinophils predict the lack of response to beclomethasone in symptomatic asthmatic patients. Chest 2006;129:565–72.
11. Currie GP, Syme-Grant NJ, McFarlane LC, et al. Effects of low dose fluticasone/salmeterol combination on surrogate inflammatory markers in moderate persistent asthma. Allergy 2003;58:602–7. 12. Brightling CE. Clinical applications of induced sputum. Chest
2006;129:1344–8.
13. Pavord ID, Brightling CE, Woltmann G, et al. Non-eosinophilic cor ticosteroid unresponsive asthma. The Lancet 1999;353:2213–4. 14. Berry M, Morgan A, Shaw DE, et al. Pathological features and inhaled
corticosteroid response of eosinophilic and non-eosinophilic asthma. Thorax 2007;62:1043–9.
15. Godon P, Boulet LP, Malo JL, et al. Assessment and evaluation of symptomatic steroid-naive asthmatics without sputum eosinophilia and their response to inhaled corticosteroids. Eur Respir J 2002;20:1364–9.
16. Lemière C, Tremblay C, FitzGerald M, et al. Effects of a short course of inhaled corticosteroids in noneosinophilic asthmatic subjects. Can Respir J 2011;18:278–82.
17. Giannini D, Di Franco A, Cianchetti S, et al. Analysis of induced sputum before and after withdrawal of treatment with inhaled corticosteroids in asthmatic patients. Clin Exp Allergy 2000;30:1777–84.
18. Travers J, Marsh S, Williams M, et al. External validity of randomised controlled trials in asthma: to whom do the results of the trials apply? Thorax 2007;62:219–23.
19. Juniper EF, O'Byrne PM, Guyatt GH, et al. Development and validation of a questionnaire to measure asthma control. Eur Respir J 1999;14:902–7.
20. Juniper EF, Guyatt GH, Cox FM, et al. Development and validation of the mini asthma quality of life questionnaire. Eur Respir J 1999;14:32–8.
21. Reddel HK, Taylor DR, Bateman ED, et al. An official American Thoracic Society/European Respiratory Society statement: asthma control and exacerbations: standardizing endpoints for clinical asthma trials and clinical practice. Am J Respir Crit Care Med 2009;180:59–99.
22. Louis R, Sele J, Henket M, et al. Sputum eosinophil count in a large population of patients with mild to moderate steroid-naive asthma: distribution and relationship with methacholine bronchial hyperresponsiveness. Allergy 2002;57:907–12.
23. Demarche SF, Schleich FN, Paulus VA, et al. Asthma control and sputum eosinophils: a longitudinal study in daily practice. J Allergy Clin Immunol Pract 2017;5:1335–43.
24. Louis R, Godinas L, Schleich F. Induced sputum - towards normal values. In: Loukides S, Kostikas K, Barnes PJ, eds. Non invasive
assessment of airways inflammation in asthma and COPD. Greece,
Athens: Paschalidis Medical Publications, 2011:113–23.
25. Dahl R. Systemic side effects of inhaled corticosteroids in patients with asthma. Respir Med 2006;100:1307–17.
26. Belvisi MG. Regulation of inflammatory cell function by corticosteroids. Proc Am Thorac Soc 2004;1:207–14.
27. Boumpas DT, Chrousos GP, Wilder RL, et al. Glucocorticoid therapy for immune-mediated diseases: basic and clinical correlates. Ann Intern Med 1993;119:1198–208.
28. Pinto-Plata VM, Müllerova H, Toso JF, et al. C-reactive protein in patients with COPD, control smokers and non-smokers. Thorax 2006;61:23–8.
29. Sin DD, Lacy P, York E, et al. Effects of fluticasone on systemic markers of inflammation in chronic obstructive pulmonary disease. Am J Respir Crit Care Med 2004;170:760–5.
30. de Torres JP, Cordoba-Lanus E, López-Aguilar C, et al. C-reactive protein levels and clinically important predictive outcomes in stable COPD patients. Eur Respir J 2006;27:902–7.
31. Takemura M, Matsumoto H, Niimi A, et al. High sensitivity C-reactive protein in asthma. Eur Respir J 2006;27:908–12.
32. Juniper EF, Svensson K, Mörk AC, et al. Measurement properties and interpretation of three shortened versions of the asthma control questionnaire. Respir Med 2005;99:553–8.
33. Green RH, Brightling CE, McKenna S, et al. Asthma exacerbations and sputum eosinophil counts: a randomised controlled trial. Lancet 2002;360:1715–21.
34. Jayaram L, Pizzichini MM, Cook RJ, et al. Determining asthma treatment by monitoring sputum cell counts: effect on exacerbations. Eur Respir J 2006;27:483–94.
35. Brusselle G, Bracke K. Targeting immune pathways for therapy in asthma and chronic obstructive pulmonary disease. Ann Am Thorac Soc 2014;11:S322–8.
36. Pavord ID, Shaw DE, Gibson PG, et al. Inflammometry to assess airway diseases. Lancet 2008;372:1017–9.
37. Louis R, Demarche S. Time for reasoning ICS prescription in obstructive airway diseases. Int J Clin Pract 2014;68:1176–8. 38. Roland NJ, Bhalla RK, Earis J. The local side effects of inhaled
corticosteroids. Chest 2004;126:213–9.
39. Raissy HH, Kelly HW, Harkins M, et al. Inhaled corticosteroids in lung diseases. Am J Respir Crit Care Med 2013;187:798–803.
40. Demarche SF, Schleich FN, Paulus VA, et al. Is it possible to claim or refute sputum eosinophils ≥ 3% in asthmatics with sufficient accuracy using biomarkers? Respir Res 2017;18:133.
on 16 August 2018 by guest. Protected by copyright.