See discussions, stats, and author profiles for this publication at: https://www.researchgate.net/publication/335023397
Effect of the curing type on the mechanical properties of lightweight concrete
with polypropylene and steel fibres
Article in Construction and Building Materials · August 2019 DOI: 10.1016/j.conbuildmat.2019.08.006 CITATIONS 9 READS 362 4 authors, including:
Some of the authors of this publication are also working on these related projects:
Aproveitamneto de resíduos como matéria prima em cerâmica vermelhaView project
Sustainable Development of Cement-based Materials: Application to Recycled Aggregates ConcreteView project Mostafa Kazemi
University of Liège
12PUBLICATIONS 101CITATIONS
SEE PROFILE
Pouyan Khakpour Talebi
2PUBLICATIONS 12CITATIONS SEE PROFILE Jorge de Brito University of Lisbon 1,441PUBLICATIONS 16,209CITATIONS SEE PROFILE
All content following this page was uploaded by Mostafa Kazemi on 07 August 2019. The user has requested enhancement of the downloaded file.
Effect of the curing type on the mechanical properties of lightweight concrete
with polypropylene and steel fibres
, , , Jorge de Britod
a Associate Professor, Department of Civil Engineering, University of Guilan, P.O. Box 3756, Rasht, Iran, rmadan-doust@yahoo.com
b MSc Graduate Student, Department of Civil Engineering, University of Guilan, Rasht, Iran, kazemi.civil68@gmail.com
c MSc Graduate Student, Department of Civil Engineering, Islamic Azad University, Bushehr Branch, Iran, pouyan.khakpour@gmail.com
c Full Professor, CERIS, Department of Civil Engineering. Architecture and Georresources, Instituto Superior Técnico,
Universidade de Lisboa, jb@civil.ist.utl.pt
Abstract
This study assessed the effect of steel and polypropylene fibres at various volume contents on concrete incorporating lightweight expanded clay aggregate (LECA) and water/binder (W/B) ratios of 0.37 and 0.42. The concrete specimens were cured under six curing conditions: wet, 3-day wet, 14-day wet, air-dry controlled, air-dry uncontrolled, and 90 °C vapour. The use of lightweight aggregates in the construction industry has drawn the attention of researchers and, on the other hand, fibres with a high strain-hardening response can be used as an appropriate addition in concrete materials. In this study, the mechanical prop-erties of lightweight concrete containing steel or polypropylene fibres were evaluated by means of com-pressive strength, splitting tensile strength and modulus of elasticity tests at 3, 7, 28 and 60 days. Accord-ing to the results, fibre reinforced concrete mixes containAccord-ing LECA, cured under 90 °C vapour curAccord-ing, achieved the highest mechanical strength. In addition, the optimum contents of steel fibres to obtain the highest compressive and splitting tensile strengths of lightweight concrete were 1% and 3%, respectively.
1. Introduction
The overuse of natural aggregate in the construction sector has harmed the environment in re-cent decades, and it is estimated that about 7.5 billion tonnes of aggregates are annually consumed by the concrete industry [1-5]. This environmental issue can be somewhat solved by partial re-placement of natural aggregates with artificial lightweight aggregates in the building process [6-10]. Although the use of lightweight concrete (LC) dates back to the Roman Empire, modern age
artificial lightweight aggregates were produced in the middle of the 20th century and then they were
developed by researchers in the concrete industry [11, 12]. Of all artificial lightweight aggregates, lightweight expanded clay aggregates (LECA) with a density below 2 g/cm were first used in Scandinavia in 1930 to produce lightweight cubes, and the concept of concrete made with LECA was subsequently analysed by researchers to efficiently reduce the dead load of structure [13-15]. The main differences between natural aggregates and LECA are the greater porosity and water absorption of LECA, which leads to lower mechanical strength of LC [11, 12, 16, 17]. However, using saturated or semi-saturated LECA in concrete positively affected the durability via internal curing [18]. Therefore, the high water absorption of LECA can explain why a poor curing condi-tion can affect the mechanical strength of lightweight concrete more than that of normal weight concrete. Regarding the water absorption of LECA, Ferreira et al. [19] and Saikia and de Brito [20] suggested a pre-saturation method, where the effective water/binder (W/B) ratio can be kept con-stant by preventing further water absorption of LECA. Concerning the mechanical properties of LECA, Hassan et al. [21] produced three different grades of LECA, and concluded that the finer size of LECA (1-4 mm) caused their agglomeration and a subsequent decrease of the mechanical strength of the concrete specimens. A porosity analysis was performed by Tataranni et al. [22] on LECA with nominal size of 4-16 mm. The results showed that LECA can be classified as a
light-weight aggregate with smaller pores and well-distributed voids. As per a study by Hubertova and Hela [23], low strength was obtained for concrete mixes made with LECA. Similar results were reported by Hassan et al. [24], where they showed a substantial decrease of the compressive strength by increasing the amount of LECA in the concrete mixes. The hydration process of con-crete containing lightweight aggregates was evaluated by Mindess et al. [25], and the inner relative humidity was suggested to stay at about 80% so that the chemical reaction and hydration rate effec-tively increased. They also concluded that, by considering W/B ratio less than 0.36, the inner rela-tive humidity of the concrete mix cannot be provided. Espinoza-Hijazin and Lopez [26] conducted a study on concrete containing lightweight aggregate with W/B between 0.4 and 0.5. They showed that the highest hydration process can be obtained for concrete mixes with W/B ratio of 0.425.
Concrete is one of most popular construction materials and it has high compressive strength and low tensile strength [27-31]. So, when tensile cracking dominates concrete behaviour, it is required to use appropriate additions with a strain-hardening response under tensile loading [31, 32]. Fibres are known for their tensile strength capacity and they have been widely used to im-prove the resistance to tensile stress and concrete spalling [33-36]. So, the tensile and flexural strength of concrete materials can be remarkably improved by adding a low volume of fibres, while a moderate increase can occur in the compressive strength of fibre reinforced concrete due to a high strain-hardening response of fibres under tensile loading. Meanwhile, the increase in splitting tensile strength, flexural strength and toughness index for LC seems much higher than that of normal aggregate concrete owing to better interlocking between fibres and lightweight aggregates than normal aggregates [37, 38]. Among available fibres, polypropylene fibres (PF) can generate a suitable bond quality between aggregates and cement particles. Aulia [39] showed that PF decreased the early plastic shrinkage cracking and improved the ductility behaviour and
tensile capacity of high-strength concrete by providing bridging forces across cracks. Similar
results were reported by Banthia and Gupta [40]. They showed that PF controlled plastic
shrink-age cracking. Meanwhile, longer PF appeared to be highly effective in preventing cracks
propa-gation.Fallah and Nematzadeh [41] showed that the cohesion and bond, provided by PF in plain
concrete, led to a decrease in slump. They assessed the mechanical properties of concrete con-taining PF at 0.1-0.5% by volume, where only 0.1% PF had a positive effect on the compressive strength of concrete. In addition, concrete’s tensile strength and modulus of elasticity increased by increasing the volume of PF from 0.1% to 0.3%, while the reverse occurred for higher
con-tents. Similarly, Zhang et al. [42] recently recommended using a suitable amount of PF to
en-hance the impact toughness and mechanical strength of concrete. Another type of fibres is steel
fibres (SF), with a higher tensile strength than PF. SF can increase the compressive strength of concrete by changing the direction of cracks, which leads to reducing the stress concentration at the tip of cracks and subsequently delaying the failure of concrete elements as described by Yan et al. [43]. The mechanical properties of concrete with SF at 0.25-2% by volume were assessed by Mohod [44]. The results showed that SF caused the slump of concrete mixes to decrease. Meanwhile, concrete mixes incorporating SF at 0.75% and 1% by volume were considered opti-mum mix designs in terms of maximizing the flexural and compressive strengths. Afroughsabet and Ozbakkaloglu [45] evaluated the mechanical properties of high-strength concrete incorporat-ing SF at 0.25% and 1% by volume, where the highest splittincorporat-ing tensile and flexural strengths were obtained for concrete incorporating 1% SF. To compare the effect of curing conditions on the tensile strength of fibre reinforced geopolymer composite containing SF and PF, Bhutta et al. [46] showed that the heat curing improved much more the tensile strength of fibre reinforced geopolymer composite containing SF than that of the one containing PF, owing to higher
re-sistance of SF than PF to higher curing temperature.
So, it seems that the mechanical strength of LC can be improved by using fibres. The effect of SF on the mechanical properties of LC was assessed by Shafigh et al. [47]. They revealed that the increase in compressive strength of LC with SF was higher at older ages than at early ages, owing to the better cohesion and stronger bond between the fibres and the matrix at older ages. Further-more, the addition of SF reduced the sensitivity of LC to poor curing condition. In another study,
the mechanical properties of LC with SF at 0.25-1% by volume were assessed by Hassanpour et al.
[48]. The results showed that 1% incorporation of SF increased the tensile strength of LC up to 77% by bridging the cracks and subsequently delaying the growth rate of tensile cracks. Zohrabi et al. [49] conducted a limited study on the compressive strength of LC containing 1% of SF and PF. They observed that there was no significant enhancement in the compressive strength of LC by adding 1% PF, while 1% SF remarkably increased this property. For further investigation, the pre-sent study is an effort to assess the effect of SF and PF at various volume contents on the mechani-cal properties of concrete incorporating LECA with W/B ratios of 0.37 and 0.42 at 3, 7, 28 and 60 days. Since the curing regime and age can affect the mechanical properties of concrete materials
[50-55] and wet curing condition appear to be highly effective in improving the compressive
strength of fibre reinforced concrete (FRC) and LC [56, 57], cubic and cylindrical specimens were
cured under six curing conditions: wet, 3-day wet, 14-day wet, air-dry controlled, air-dry uncon-trolled, and 90 °C vapour. Therefore, the concrete specimens were cured by immersion in a water tank and taken out after different ages; then, the results of these specimens were compared with those cured under 90 °C vapour curing condition. In addition, other concrete specimens were kept in lab condition (air-dry controlled cuirng regime) and open air without any control (air-dry uncon-trolled curing regime); thereafter, their results were compared. A combination of the methods was
used to obtain variations of splitting tensile strength and modulus of elasticity vs. compressive strength and propose one-variable equations under different curing conditions. Meanwhile, correla-tion curves were obtained between modulus of elasticity and compressive strength, and they were compared with those of ACI 318 [58].
2. Experimental program
2.1. Materials
In this study, type II Portland cement was used with a density of 3.2 g/cm and surface area of 3055 cm /g. Table 1 shows the chemical composition of this type of cement. The density and water absorption of crushed gravel, used in concrete mixes, were equal to 2.65 g/cm and 1.1%, respectively. The corresponding values for natural river sand were 2.84 g/cm and 3.5%. The size grading curves of crushed gravel and natural river sand are within the ranges given by ASTM C33 [59] as shown in Fig. 1. LECA, with a nominal size of 3-15 mm, was provided from Iran LECA company, located in Saveh, as shown in Fig. 2. Table 1 shows the chemical composi-tion of LECA, with a density of 0.545 g/cm and water absorpcomposi-tion of 18%. A superplasticizer of polycarboxylic ether-type, suited for improving the workability of concrete, was provided from the Feroplast Company and added to the mixes as proposed by other researchers [60-62]. As suggested by Fallah and Nematzadeh [41], PF with diameters of 0.1 mm, 0.2 mm, and 0.3 mm, were added to the concrete mixes, as indicated in Fig. 3(a). The density and tensile strength of PF were equal to 0.91 g/cm and 400 MPa, respectively. As shown in Fig. 3(b), hooked-end SF with diameters of 1 mm, 2 mm, and 3 mm were used. The length, density, and tensile strength of hooked-end SF were 50 mm, 7.61 g/cm , and 809 MPa, respectively.
Table 1. Chemical composition of the Portland cement and LECA LECA (%) Cement (%) XRF 66.05 22.45 SiO2 16.57 4.85 Al2O3 7.10 3.95 Fe2O3 2.46 64.81 CaO 1.99 0.8 MgO - 0.85 SO3 0.69 0.25 Na2O 2.69 0.51 K2O - 7.1 C3A - 0.25 LOI 0.78 - TiO2 0.21 - P2O5 0.09 - MnO
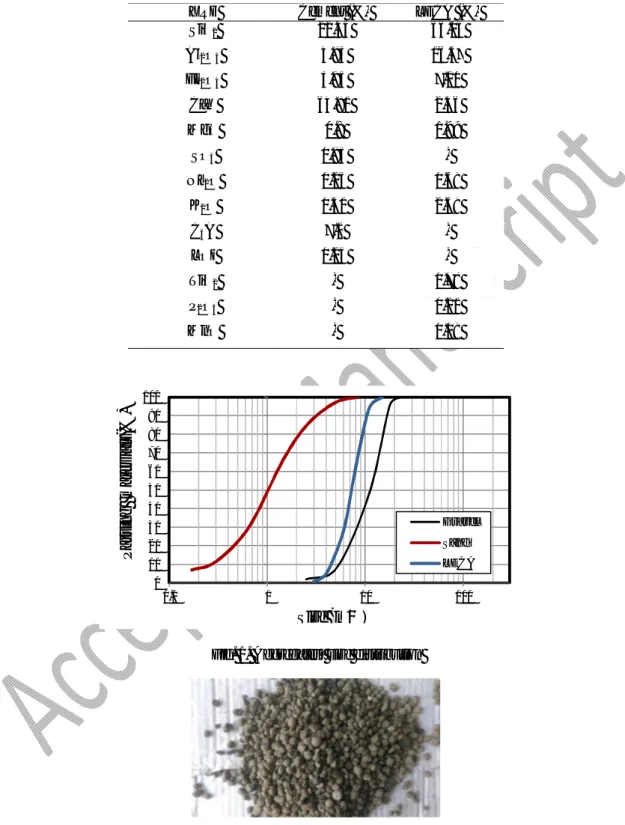
Fig. 1. Aggregates’ size distribution
Fig. 2. LECA used in the concrete mixes
0 10 20 30 40 50 60 70 80 90 100 0.1 1 10 100 Gravel Sand LECA Size (m ) P a ss in g m a te ri a ls (% )
(a) (b) Fig. 3. PF (a); Hooked-end SF (b)
2.2. Mix proportioning
As seen in Table 2, 14 concrete mix designs were made in the present study. Regarding the W/B ratio, Mindess et al. [25] concluded that, by considering a W/B ratio less than 0.36, the inner relative humidity of LC mixes cannot be provided. In addition, Zohrabi et al. [49] observed that, by consider-ing a W/B ratio of 0.37 in concrete mixes with LECA and PF and SF, a suitable compressive strength can be obtained. Meanwhile, a study by Espinoza-Hijazin and Lopez [26] on LC with W/B ratio be-tween 0.4 and 0.5 showed that the highest hydration process can be obtained for mixes with a W/B ratio of 0.425. So, in this study, the effective W/B ratios were considered to be 0.37 and 0.42. All aggregates were used in the saturated surface-dry condition to prevent further water absorption. Since LECA can effectively reduce the compressive strength of concrete, the coarse natural aggregates were only replaced at 30% with LECA to achieve appropriate mechanical properties of concrete.
For mix preparation, the sand, and coarse natural aggregate and LECA were first mixed for 30 s at normal speed. Then, half of the tap water was added into the mixer and mixing went on for 1 min. Thereafter, cement was added and mixed for one more minute. Then, the fibres, along with the re-maining water and superplasticizer, were intermittently and slowly introduced in the mixer, and mix-ing went on for 3 min. This procedure prevented clustermix-ing of the SF and PF and thoroughly distrib-uted them in the concrete mass as advised by Hemmati et al. [63]. Finally, 15 cm cubes samples were
made to determine 3-, 7-, 28-, and 60-day compressive strength based on ASTM C39 [64]. Mean-while, 15×30 cm cylindrical samples were cast to obtain 3-, 7-, 28- and 60-day splitting tensile strength and modulus of elasticity as per ASTM C496 [65] and ASTM C469 [66], respectively. In addition, the loading rate of the compressive and tensile testing was 0.5 MPa/s according to Euro-pean standard EN 12390-13 [67].
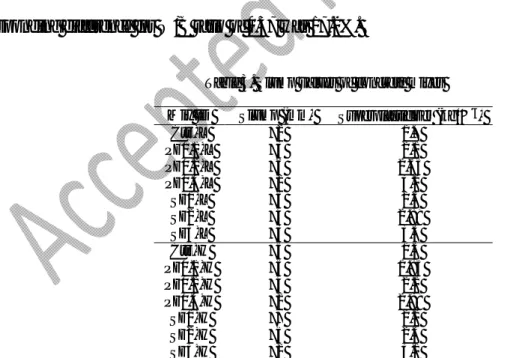
Table 2. Mix details
W/B Superplasticizer (kg/ ) LECA (kg/ ) Fine aggregate (kg/ ) Coarse aggregate (kg/ ) Water (L/m3) Cement (kg/ ) PF (%) SF (%) Mix ID 0.37 1.7 150 701 350 162.8 440 - - Ctrl-L 0.37 2.1 150 698 350 162.8 440 0.1 - PF 0.1-L 0.37 2.65 150 695 350 162.8 440 0.2 - PF0.2-L 0.37 3.2 150 692 350 162.8 440 0.3 - PF0.3-L 0.37 2.6 150 698 350 162.8 440 - 1 SF 1-L 0.37 2.89 150 695 350 162.8 440 - 2 SF2-L 0.37 3.3 150 692 350 162.8 440 - 3 SF3-L 0.42 1.5 150 656 350 184.8 440 - - Ctrl-H 0.42 1.85 150 652 350 184.8 440 0.1 - PF0.1-H 0.42 2.2 150 650 350 184.8 440 0.2 - PF0.2-H 0.42 2.89 150 647 350 184.8 440 0.3 - PF0.3-H 0.42 2.2 150 652 350 184.8 440 - 1 SF1-H 0.42 2.5 150 650 350 184.8 440 - 2 SF2-H 0.42 3.1 150 647 350 184.8 440 - 3 SF3-H a Low W/B ratio (0.37) b PF c SF d High W/B ratio (0.42) 2.3. Curing conditions
Temperature and humidity play a key role on curing concrete specimens in experimental condi-tions; furthermore, the duration of immersion in water can influence the hardened properties of con-crete. So, by considering the fact that curing regimes and ages can affect the mechanical strength of concrete [68-71], the mechanical properties of the concrete specimens were assessed under six curing
conditions wet, 3-day wet, 14-day wet, air-dry controlled, air-dry uncontrolled, and 90 °C vapour in which the concrete specimens were demoulded after 24 h. It is noteworthy that the concrete speci-mens were cured by immersion in a water tank and taken out after different ages (wet, 3-day wet and 14-day wet curing conditions); then, the results of these specimens were compared with those cured under 90 °C vapour curing condition to assess the effect of vapour and wet curing conditions at dif-ferent ages on the mechanical properties of concrete specimens. In addition, other concrete speci-mens were kept in lab condition (air-dry controlled curing regime) and open air without any control (air-dry uncontrolled curing regime) and their results were compared to each other.
2.3.1. Wet curing condition
In this curing regime, after demoulding, the concrete specimens were cured by immersion in a
water tank at 24 °C up to the time of testing.
2.3.2. 3-day wet curing condition
In this curing type, after demoulding, the concrete specimens were cured by immersion in a water tank and taken out after 3 days. Then they were kept under lab conditions until the date of testing. 2.3.3. 14-day wet curing condition
After demoulding, the concrete specimens were cured by immersion in a water tankand taken
out after 14 days. Then they were kept under lab until the date of testing. 2.3.4. Air-dry controlled curing condition
In this curing condition, after demoulding, the concrete specimens were kept under lab condi-tions at average humidity of 70% and 22 -24 °C temperature (Fig. 4). It is noteworthy that a heat-ing ventilation and air conditionheat-ing (HVAC) system was used in the laboratory to ensure that the humidity and ambient temperature were within the expected range.
Fig. 4. Laboratory space
2.3.5. Air-dry uncontrolled curing condition
In this method, after demoulding, the concrete specimens were kept in open air without any control, i.e. humidity and temperature were variable.
2.3.6. 90 °C vapour curing condition
In this method, there was some water at the bottom of the curing tank. After demoulding, the concrete specimens were kept in the curing system at a temperature of 90 °C, leading to generat-ing the vapour curgenerat-ing condition, while the curgenerat-ing tank was closed as seen in Fig. 5a. Then, the con-crete specimens were taken out after 2 days. Later on, they were kept under lab conditions until the date of testing. A cylindrical heater was prepared in the centre of the concrete curing system as shown in Fig. 5b to uniformly distribute the temperature within the concrete specimens.
(a) (b)
2.4. Sample preparation
Cube specimens were made to obtain the compressive strength (CS) of concrete under six curing conditions at 3, 7, 28 and 60 days. At each age and curing condition, three concrete specimens were made. Therefore, the results were the average of three 15 cm cubic specimens, and the total number of cubes was 1008. The same total number was considered to make cylindrical samples and obtain the splitting tensile strength, where the results were the average of three cylindrical samples. In addi-tion, the modulus of elasticity of cylindrical specimens was determined under six curing conditions at 3, 7, 28 and 60 days. Similarly to the compression test, the results of modulus of elasticity were the average of three specimens, and the total number of cylindrical samples for this test was 1008.
3. Results and discussion
3.1. Slump
The slump of the LC control mix with 0.37 W/B ratio was found to be 72 mm. A similar study by Hassanpour et al. [48] reported a slump value of 65 mm for a LC with 0.32 W/B ratio. The present study intended all concrete mixes to have an appropriate workability. According to the Fallah and Nematzadeh [41] and Mohod [44] results, the SF and PF caused a reduction of the workability and slump values of the concrete mixes owing to the cohesion and bond between the fibres and the concrete matrix. So, more superplasticizer was added to the mixes when increasing the amount of fibres to maintain a suitable slump. As seen in Table 3, the slump of concrete mix-es with W/B ratio of 0.37 was in the 72-76 mm range. Thmix-ese valumix-es for W/B ratio of 0.42 were in the 72-77 mm range. So, the difference between the slump of LC mixes made with fibres and control specimens was negligible due to the adjustment of the superplasticizer’s content. On the other hand and as expected, as seen in Table 3, lower amounts of superplasticizer were required
for the higher W/B ratio (0.42) to achieve the intended workability.
3.2. Compressive strength
The CS of LC made with various contents of PF and SF under six curing conditions at 3, 7, 28 and 60 days is shown in Fig. 6. The CS ratios of FRC mixes to control mixes are presented in Ta-ble 4. The CS of concrete made with LECA and a W/B ratio of 0.37 under wet curing at 28 days was about 17.4% more than that at 7 days. The corresponding difference given by Zohrabi et al. [49] was 21%. Since concrete specimens under wet, 3-day and 14-day wet curing conditions were cured by immersion in a water tank at early ages, the CS of the control mixes under these three curing condi-tions was nearly the same, particularly at early ages (3 days and 7 days) as seen in Figs. 6 (a), (b) and (c). For instance, the CS of concrete with W/B ratio of 0.42 under these curing regimes was about 31.5 MPa and 35.5 MPa at 3 and 7 days, respectively, while these values under wet curing were on average about 11% higher than those under 3-day and 14-day wet curing at 28 and 60 days. The cor-responding difference for W/B ratio of 0.37 was 17.2%.
Table 3. Slump values of concrete mixes Mix ID Slump (mm) Superplasticizer (kg/ )
Ctrl-L 72 1.7 PF0.1-L 73 2.1 PF0.2-L 76 2.65 PF0.3-L 72 3.2 SF1-L 75 2.6 SF2-L 74 2.89 SF3-L 73 3.3 Ctrl-H 75 1.5 PF0.1-H 75 1.85 PF0.2-H 74 2.2 PF0.3-H 72 2.89 SF1-H 77 2.2 SF2-H 75 2.5 SF3-H 72 3.1
According to Figs. 6 (b) and (e), the CS of the control mixes under 3-day wet curing was higher than that under air-dry uncontrolled curing, particularly at early ages, while there was no difference
for these curing regimes at older ages. This may be due to the fact that over time the free water in concrete mixes under air-dry uncontrolled curing evaporated and the trapped water molecules in LECA were given back to the empty capillary pores to react with cement particles and complete the hydration process at older ages (Fig. 7), similarly to what Wang et al. [57] reported.
(a) (b)
(c) (d)
(e) (f)
Fig. 6. Cube CS of LC mixes under: Wet curing (a); 3-day wet curing (b); 14-day wet curing (c); Air-dry controlled curing (d); Air-dry uncontrolled curing (e); 90 °C vapour curing (f)
0 10 20 30 40 50 60 3 days 7 days 28 days 60 days C u b e co m p re ss iv e s tr e n g th (M P a
) Wet curing condition
0 10 20 30 40 50 60 3 days 7 days 28 days 60 days C u b e c o m p re ss iv e st re n g th (M P a
) 3-day wet curing condition
0 10 20 30 40 50 60 3 days 7 days 28 days 60 days C u b e c o m p re ss iv e s tr e n g th (M P a
) 14-day wet curing condition
0 10 20 30 40 50 60 3 days 7 days 28 days 60 days C u b e c o m p re ss iv e s tr e n g th (M P a
) Air-dry controlled curing condition
0 10 20 30 40 50 60 3 days 7 days 28 days 60 days C u b e c o m p re ss iv e s tr en g th (M P a
) Air-dry uncontrolled curing condition
0 10 20 30 40 50 60 3 days 7 days 28 days 60 days C u b e c o m p re ss iv e s tr en g th (M P a
Table 4. Cube CS ratios of FRC mixes to control mixes Curing regimes SF1 − L Ctrl − L SF2 − L Ctrl − L SF3 − L Ctrl − L SF1 − H Ctrl − H SF2 − H Ctrl − H SF3 − H Ctrl − H PF1 − L Ctrl − L PF2 − L Ctrl − L PF3 − L Ctrl − L PF1 − H Ctrl − H PF2 − H Ctrl − H PF3 − H Ctrl − H Wet 1.01 0.79 0.71 1.05 0.8 0.73 0.99 0.91 0.87 0.98 0.92 0.83 3-day wet 1.01 0.85 0.78 1.05 0.79 0.75 1.04 0.95 0.86 0.93 0.88 0.84 14-day wet 1.02 0.8 0.74 1.04 0.8 0.75 0.96 0.93 0.88 0.95 0.91 0.84 Air-dry controlled 1.04 0.77 0.76 1.05 0.79 0.76 0.97 0.91 0.87 0.9 0.86 0.8 Air-dry uncontrolled 1.03 0.79 0.76 1.04 0.79 0.75 0.97 0.91 0.86 0.9 0.85 0.79 90 °C vapour 1.03 0.82 0.74 1.03 0.72 0.68 1.02 0.98 0.91 0.92 0.93 0.8
Fig. 7. Schematic of water molecules, given back to the empty capillary pores under air-dry uncontrolled curing
The fibres content has no effect on the hydration process of concrete materials. However, the CS of LC mixes decreased by adding SF except for 1% content. A study by Mohod [44] on concrete mixes with SF at 0.25-2% by volume showed that the CS of concrete increased by adding 1% SF. So, it can be inferred that there was a strong bond and cohesion between 1% SF and the matrix, while the results showed that the CS of concrete decreased at higher amounts of SF owing to the generation of air-voids in the concrete mixes as explained by Balaguru and Ramakishan [72]. Concerning the addition of PF, Fallah and Nematzadeh [41] showed that 0.1% incorporation of these fibres in con-crete mixes slightly improved the CS, while the reverse occurred for higher volume fractions. In our study, in most cases, there was no significant difference between the results of concrete with 0.1% PF and the control mixes, while the CS of LC decreased by increasing the content of PF due to cluster-ing and pore formation, as described by Fallah and Nematzadeh [41].
In this study, the effects of low and high W/B ratios on the CS of LC were compared. Under
LECA Empty
capil-lary pore
Water molecules, removed from LECA to the concrete pores
Over time
Trapped wa-ter in LECA
90 °C vapour and wet curing conditions, the compressive strength of concrete mixes with W/B ratio of 0.37 was on average about 9%, and 9.8% more than that of the mixes with W/B ratio of 0.42, respectively. The corresponding values for the air-dry uncontrolled, air-dry controlled, 3-day and 14-3-day wet curing conditions were about 5.1%, 5.9%, 5.5% and 5.4%, respectively. So, when concrete specimens were cured by 90 °C vapour curing and by immersion in a water tank for a long time, the difference between the results of low and high W/B ratios increased. This showed that the hydration process and chemical reactions increased more for concrete mixes with low W/B ratio (0.37) due to vapour and wet curing conditions.
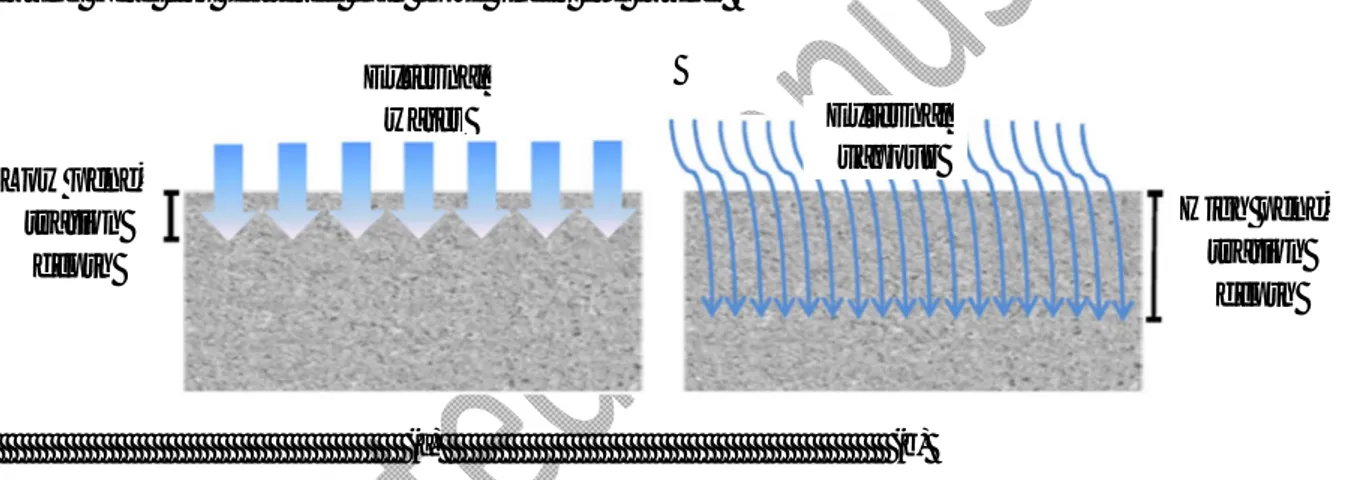
FRC mixes containing LECA were efficiently cured under 90 °C vapour curing and even the CS of concrete mixes under this curing regime was slightly higher than that under wet curing. As seen in Figs. 6(a) and (f), the cube CS of concrete mixes under 90 °C vapour curing was on aver-age 7.2% higher than that under wet curing. There are two explanations for this difference. First, 90 °C vapour curing leads to a faster cement hydration process at high temperatures, and this cur-ing regime subsequently contributes to improvcur-ing the silica gel properties in concrete at both early and old ages. Second, the external water in a wet curing condition can only penetrate into the concrete specimens within a few millimetres owing to its low permeability, as described by Wang et al. [57], while the external water vapour particles in the 90 °C vapour curing are much less dense than those of external liquid water as reported by Firestone [73]; thus, they can easily penetrate the concrete specimens in depth as seen in Fig. 8. In addition, 1% SF can be seen as an optimum content in concrete mixes containing LECA to achieve an adequate CS. For instance, under 90 °C vapour curing, the CS of LC with 1% SF was on average about 3.1% higher than that of the control mixes. The corresponding value for 0.1% PF was on average about 1.8%.
cur-ing for 2 days showed that the CS values of concrete mixes under 90 °C vapour were on average about 11.8%, 13.8%, 14.18% and 15.25% more than those under 3-day wet curing at 3, 7, 28 and 60 days, respectively. It can be inferred that the difference between the results under these curing conditions increased as the age of concrete specimens increased; therefore, the initial period of
curing by 90 °C vapour for 2 days appeared to be more effective than that by water for 3 days in
improving the CS of FRC and LC, particularly at older ages.
Concernig scatter of the data, the standard deviation (SD) of the control mixes under wet curing at 28 days was equal to 4.6 MPa and 4.2 MPa for the W/B ratios of 0.37 and 0.42, respectively. There-fore, the coefficients of variation for the same mixes were 9.5% and 9.3%. Similarly to the results of Mazaheripour et al. [74], the coefficient of variation for LC under wet curing condition at 28 days was equal to 9.9%. This shows that the SD values of FRC mixes in the compression test increased by increasing the SF and PF content. Similar results were reported by Mazaheripour et al. [74] for FRC. This can be due to the generation of air-voids in the concrete mixes by increasing fibres. According to the results, the CS values of concrete mixes made with SF were more scattered than those of con-crete mixes made with PF. The reason is that SF were bigger than PF; so, the higher amount of SF led to the generation of more and bigger air-voids in the concrete mixes. The results showed that the mid-values of SD of the concrete mixes under 90 °C vapour curing were nearly the same as those under wet curing. However, these values under 90 °C vapour curing were on average about 3% low-er than those undlow-er wet curing at early ages (3 and 7 days), while the contrary happened at oldlow-er ages (28 and 60 days). These can be due to the fact that, at early ages, the concrete specimens under 90 °C vapour curing were kept in the curing system for 2 days and the external water vapour particles in 90 °C vapour curing were much less dense than those of external liquid water as reported by Firestone [73]; thus, they easily penetrated the concrete specimens in depth, as seen in Fig. 8, and filled in the
air-voids of concrete, leading to an increase in the hydration process and a decrease in SD values at early ages. But, the concrete specimens were taken out after 2 days udrer 90 °C vapour curing and they were kept under lab conditions until the date of testing. This led to the generation of some air-voids at older ages. Therefore, the mid-values of SD under 90 °C vapour curing were on average about 8.4% more than those under wet curing condition at older ages. Totally, the CS values of con-crete mixes under wet and 90 °C vapour curing were less scattered than those under other types of curing, while the highest SD values were obtained for concrete mixes under air-dry uncontrolled curing. A study by Kriker et al. [75] on FRC showed that the compressive strength values under wet curing were less scattered than those under dry curing.
(a) (b)
Fig. 8. Penetration depth of external liquid water and external water vapour particles into concrete specimens under wet curing (a) and 90 °C vapour curing (b)
The difference between the SD values under air-dry uncontrolled and controlled curing was negligible. It may be due to the fact that, although the free water in concrete mixes under air-dry uncontrolled curing was expected to evaporate more than that under air-dry controlled curing, the trapped water molecules in LECA were given back to the empty capillary pores to compensate the lack of free water in concrete mixes, as shown in Fig. 7. Therefore, the rate of the hydration process and the SD values under air-dry controlled and uncontrolled curing were very close. Similar results were observed between 3-day and 14-day wet curing.
Low pene-tration depth High pene-tration depth External water External vapour
3.3. Splitting tensile strength
Fig. 9 shows the splitting tensile strength (STS) of LC made with various contents of PF and SF under six curing conditions at 3, 7, 28 and 60 days. The STS ratios of FRC mixes to control mixes are presented in Table 5. Similarly to the CS test, in most cases, the STS of control mixes under wet curing condition, 3-day and 14-day wet curing conditions were nearly the same, particularly at early ages (3 days and 7 days), as shown in Figs. 9 (a), (b) and (c). The STS of LC increased by increasing the SF and PF content. This can be because the addition of fibres provides bridging force across cracks, as reported by Aulia [39]. Similarly to the results of Fallah and Nematzadeh [41] for normal concrete, 0.1%, 0.2%, and 0.3% PF in LC with W/B ratio of 0.37 under wet curing condition im-proved the STS up to 15.9%, 24.5%, and 32.5%, respectively. The corresponding values for 1%, 2%, and 3% SF were 11.5%, 18.7%, and 30.7%, respectively. Regarding this, Shafigh et al. [47] showed that 1% incorporation of SF improved the STS of oil palm shell LC at early and old ages. They also concluded that the addition of fibres reduced the sensitivity of LC to poor curing condition. That is why the STS of LC under air-dry uncontrolled and air-dry controlled curing conditions increased over time by the addition of fibres, as seen in Figs. 9 (d), and (e).
According to experimental observations, LC is expected to be a brittle material. However, the type of failure behaviour of FRC mixes under the STS test was ductile. On the other hand, the ductile failure behaviour of LC with SF was more than that of concrete with PF and it seems that SF bridged the cracks better and delayed the growth rate of tensile cracks more, similarly to what
Hassanpour et al. [48] observed. The reason is that the tensile strength of the SF was equal to 809 MPa, about twice that of the PF. Meanwhile, SF were longer than PF; therefore, SF better bridged the macro-cracks, as seen in Fig. 10.
(a) (b)
(c) (d)
(e) (f)
Fig. 9. STS of LC mixes under: Wet curing (a); 3-day wet curing (b); 14-day wet curing (c); Air-dry controlled cur-ing (d); Air-dry uncontrolled curcur-ing (e); 90 °C vapour curcur-ing (f)
0 0.5 1 1.5 2 2.5 3 3.5 3 days 7 days 28 days 60 days S p li tt in g t e n si le s tr e n g th (M P a
) Wet curing condition
0 0.5 1 1.5 2 2.5 3 3 days 7 days 28 days 60 days S p li tt in g t e n si le s tr e n g th (M P a
) 3-day wet curing condition
0 0.5 1 1.5 2 2.5 3 3.5 3 days 7 days 28 days 60 days S p li tt in g t e n si le s tr e n g th (M P a
) 14-day wet curing condition
0 0.5 1 1.5 2 2.5 3 3 days 7 days 28 days 60 days S p li tt in g t e n si le s tr e n g th (M P a
) Air-dry controlled curing condition
0 0.5 1 1.5 2 2.5 3 3 days 7 days 28 days 60 days S p li tt in g t e n si le s tr en g th (M P a
) Air-dry uncontrolled curing condition
0 0.5 1 1.5 2 2.5 3 3.5 3 days 7 days 28 days 60 days S p li tt in g t e n si le s tr e n g th (M P a )
Table 5. STS ratios of FRC mixes to control mixes Curing regimes SF1 − L Ctrl − L SF2 − L Ctrl − L SF3 − L Ctrl − L SF1 − H Ctrl − H SF2 − H Ctrl − H SF3 − H Ctrl − H PF1 − L Ctrl − L PF2 − L Ctrl − L PF3 − L Ctrl − L PF1 − H Ctrl − H PF2 − H Ctrl − H PF3 − H Ctrl − H Wet 1.12 1.19 1.3 1.22 1.38 1.53 1.16 1.25 1.33 1.23 1.37 1.49 3-day wet 1.19 1.29 1.39 1.25 1.39 1.56 1.26 1.33 1.37 1.31 1.42 1.53 14-day wet 1.1 1.16 1.27 1.21 1.31 1.51 1.14 1.2 1.29 1.24 1.36 1.49 Air-dry controlled 1.28 1.4 1.6 1.46 1.65 1.96 1.43 1.5 1.6 1.6 1.64 1.91 Air-dry uncontrolled 1.29 1.35 1.51 1.4 1.58 1.81 1.29 1.38 1.47 1.51 1.54 1.74 90 °C vapour 1.1 1.18 1.25 1.2 1.31 1.43 1.15 1.24 1.29 0.85 1.28 1.4
Fig. 10. Shematic representation of tensile macro-cracks in LC with SF and PF
The effects of low and high W/B ratios on the STS of LC were compared. Under air-dry un-controlled and un-controlled curing conditions, the STS of concrete mixes with W/B ratio of 0.37 was on average about 9.7% and 3.1%, respectively, more than that of the mixes with W/B ratio of 0.42. The corresponding values for wet, 3-day wet, 14-day wet and 90 °C vapour curing con-ditions were about 16.1%, 15.5%, 16.3%, and 16.6%, respectively. So, when concrete specimens were cured by 90 °C vapour curing and by immersion in a water tank, the difference between the results of low and high W/B ratios increased.
P P Hooked-end steel fibre Polypropylene fibre Tensile macro-crack Fibre bridging effect in tensile macro-crack
The results showed that the FRC mixes containing LECA were efficiently cured under 90 °C vapour curing and even the STS of concrete mixes under this curing regime was on average 4.2% higher than that under wet curing, as seen in Figs. 11(a) and (f). In addition, 3% SF or 0.3% PF can be seen as an optimum content to obtain an adequate STS of LC. For instance, under 90 °C vapour curing, the STS of LC containing 3% SF was on average about 33.1% higher than that of the con-trol mixes. The corresponding value for 0.3% PF was on average about 34%.
The comparison of data under two initial curing conditions, 3-day wet and 90 °C vapour for 2 days, showed that the STS values of concrete mixes under 90 °C vapour curing were on average about 3.5%, 12.1%, 11.8% and 15.5% higher than those under 3-day wet curing at 3, 7, 28 and 60
days, respectively. Similarly to CS, the initial period of curing by 90 °C vapour for 2 days appeared
to be more effective than that by water for 3 days in improving the STS of FRC and LC, particularly
at older ages. Another matter is that the difference between the results of STS under these two curing conditions at 3 days was only 3.5%, while the corresponding difference in CS was 11.8%. This can
be due to the fact that the concrete mixes were not completely hardened at 3 days and they were
ex-pected to have very low tensile strength at early ages, while over time fibres content generated a
suit-able bond quality between aggregates and cement particles by forming a hard matrix at older ages;
thus, the water vapour particles, penetrating the concrete specimens in depth at early ages (Fig. 8),
effectively improved the STS of FRC by participating in the hydration process at older ages.
The SD of the control mixes under wet curing condition at 28 days was about 0.16 MPa. There-fore, the coefficient of variation for the same mixes was on average about 8.6%. Similarly to the results of Mazaheripour et al. [74], the coefficient of variation for LC under wet curing condition at 28 days was equal to 6%. The results showed that the STS SD values of the FRC mixes decreased as the SF and PF content increased. Similar results were obtained by Mazaheripour et al. [74] for
FRC. It can be inferred that concrete has low tensile strength, while fibres have high tensile strength and generate a suitable bond quality between aggregates and cement particles. So, fibres prevented further dissipation of STS values. The results showed that the STS values of concrete mixes made with SF were less scattered than those of concrete mixes made with PF. The reason is that the tensile strength of SF was about twice that of PF and SF were longer than PF, as indicated in Fig. 10. Similarly to CS, the results showed that the mid-values of STS SD of the concrete mixes under 90 °C vapour curing were found to be nearly the same as under wet curing. However, these values under 90 °C vapour curing were on average about 5.7% lower than those under wet curing at early ages (3 and 7 days), while the corresponding values under 90 °C vapour curing were on average about 3.4% more than those under wet curing at older ages (28 and 60 days). It seems that keeping concrete specimens in the 90 °C vapour curing system for 2 days efficiently prevented further scatter of the STS values at early ages. Similarly to what occurred for CS, the STS values of concrete mixes under wet and 90 °C vapour curing were less scattered than those under other types of curing, while the highest SD values were obtained for concrete mixes under air-dry uncontrolled curing. The difference between the SD values under air-dry uncontrolled and controlled curing was negligible. Similar results were observed between 3-day and 14-day wet curing.
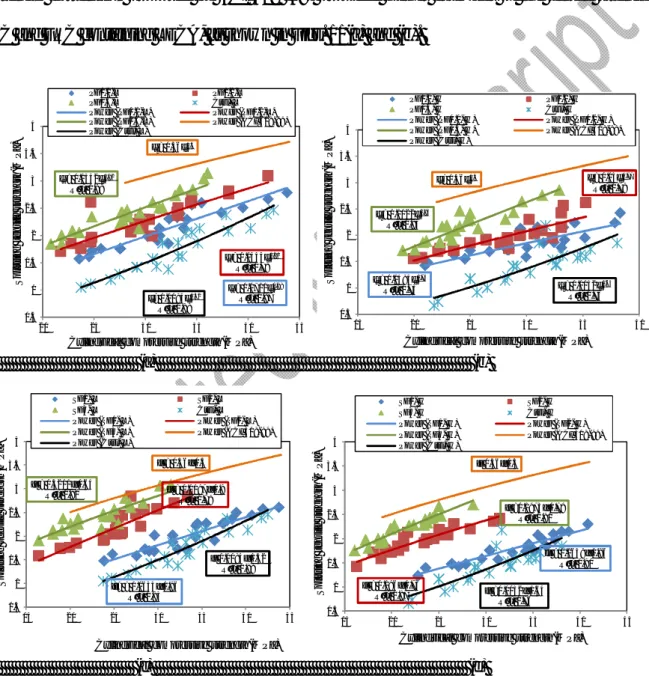
The results of different curing conditions were used to obtain the calibration curves between the cylindrical CS and STS for LC with different contents of PF and SF, as shown in Fig. 11, where they were compared with those proposed by ACI 318 [58]. To convert the cube strength into the cylin-drical strength, an appropriate conversion factor was used, as proposed by Domone [76].
For W/B ratio of 0.37, four power equations (single-variable equations) of ft = 0.0084fc
1.52
,ft =
0.0711fc0.98, ft = 0.1454fc0.81, and ft = 0.1542fc0.82 with correlation coefficients ( ) of 0.88, 0.87,
corre-sponding equations for W/B ratio of 0.42 were ft = 0.0052fc1.64, ft = 0.1484fc0.74, ft = 0.15fc0.77, and ft
= 0.1022fc
0.95
with correlation coefficients ( ) of 0.76, 0.75, 0.79, and 0.84. In the previous
equa-tions, fc is the cylindrical CS and ft is the estimated tensile strength. Similar to a study by Madandoust
[77] on concrete containing lightweight aggregate of lytag, the results of this study showed that the strength correlation proposed by ACI 318 [58] provided higher estimates of the tensile strength of LC and FRC containing LECA, as shown in Figs. 11(a) and (b).
(a) (b)
(c) (d)
Fig. 11. Variation of STS vs. CS for LC with: PF and W/B ratio of 0.37(a); PF and W/B ratio of 0.42 (b); SF and W/B ratio of 0.37 (c); SF and W/B ratio of 0.42 (d)
For W/B ratio of 0.37, four power equations (single-variable equations) of ft = 0.0084fc1.52, ft
ft= 0.0711fc0.98 R² = 0.87 ft= 0.1454fc0.81 R² = 0.78 ft= 0.1542fc0.82 R² = 0.88 ft = 0.56fc0.5 ft= 0.0084fc1.52 R² = 0.88 0.5 1 1.5 2 2.5 3 3.5 4 20 25 30 35 40 45 PF0.1-L PF0.2-L PF0.3-L Ctrl- L Power (PF0.1-L) Power (PF0.2-L) Power (PF0.3-L) Power (ACI 318-99) Power (Ctrl- L)
Cylindrical compressive strength(MPa)
S p li tt in g t e n si le s tr e n g th (M P a ) ft = 0.1484fc0.74 R² = 0.75 ft = 0.15fc0.77 R² = 0.79 ft = 0.1022fc0.95 R² = 0.84 ft= 0.56fc0.5 ft = 0.0052fc1.64 R² = 0.76 0.5 1 1.5 2 2.5 3 3.5 4 15 20 25 30 35 40 PF0.1- H PF0.2- H PF0.3- H Ctrl- H Power (PF0.1- H) Power (PF0.2- H) Power (PF0.3- H) Power (ACI 318-99) Power (Ctrl- H)
Cylindrical compressive strength(MPa)
S p li tt in g t en si le s tr e n g th (M P a ) ft= = 0.0633fc0.96 R² = 0.83 ft = 0.1197fc0.9 R² = 0.79 ft = 0.3211fc0.64 R² = 0.82 ft = 0.56fc0.5 ft 0.0084fc1.52 R² = 0.88 0.5 1 1.5 2 2.5 3 3.5 4 15 20 25 30 35 40 45 SF1- L SF2- L SF3- L Ctrl- L Power (SF1- L) Power (SF2- L) Power (SF3- L) Power (ACI 318-99) Power (Ctrl- L)
Cylindrical compressive strength(MPa)
S p li tt in g t e n si le s tr e n g th (M P a ) ft = 0.0639fc0.96 R² = 0.91 ft = 0.196fc0.73 R² = 0.87 ft =0.1973fc0.79 R² = 0.91 ft 0.56fc0.5 ft =0.0052fc1.64 R² = 0.76 0.5 1 1.5 2 2.5 3 3.5 4 15 20 25 30 35 40 45 SF1- H SF2- H SF3- H Ctrl- H Power (SF1- H) Power (SF2- H) Power (SF3- H) Power (ACI 318-99) Power (Ctrl- H)
Cylindrical compressive strength(MPa)
S p li tt in g t e n si le s tr e n g th (M P a )
= 0.0633fc0.96, ft = 0.1197fc0.9, and ft = 0.3211fc0.64 with correlation coefficients ( ) of 0.88,
0.83, 0.79, and 0.82 were obtained for LC with 0%, 1%, 2%, and 3% SF, respectively. The
cor-responding equations for W/B ratio of 0.42 were ft = 0.0052fc1.64, ft = 0.0639fc0.96, ft = 0.196fc0.73,
and ft =0.1973fc0.79 with correlation coefficients ( ) of 0.76, 0.91, 0.87, and 0.91. Similarly to
what occurred for LC with PF, the strength correlation proposed by ACI 318 [58] provided
high-er estimates of the tensile strength of LC with SF, as seen in Figs. 11(c) and (d). It seems that the greater porosity and higher water absorption of LECA prevented more efficient chemical
reac-tions with cement particles to form a hard matrix.
The results showed that all correlation coefficients ( ) were higher than 0.75; therefore, all
equations for LC reliably predicted the tensile strength. Meanwhile, the estimated tensile strength values obtained using the calibration curves for LC incorporating SF were found to be closer to those using ACI 318 [58] at older ages. This can be due to the better cohesion and stronger bond be-tween the SF and the matrix at older ages, as reported by Shafigh et al. [47]. Of the different cal-ibration curves of FRC mixes, the strength correlation of LC made with 0.3% PF or 3% SF was clos-er to that of ACI 318 [58].
3.4. Modulus of elasticity
As seen in Fig. 12, the effect of various contents of PF and SF on the modulus of elasticity (ME) of concrete mixes made with LECA were assessed under six curing conditions at 3, 7, 28 and 60 days. The ME ratios of FRC mixes to control mixes are presented in Table 6. The highest and low-est obtained ME values were 23.6 MPa and 14.1 MPa for LC made with 1% SF under 90 °C vapour curing condition and LC with 3% SF under air-dry uncontrolled curing condition, respectively. So, the range of ME values, obtained for FRC mixes made with LECA, was within the values given by
FIP [78] for LC, which ranged from 10 to 24 MPa. Similarly to CS, the ME of the control mixes under wet curing condition, 3-day and 14-day wet curing conditions were nearly the same, particular-ly at earparticular-ly ages (3 days and 7 days), as shown in Figs. 12 (a), (b) and (c).
The effects of low and high W/B ratios on the ME of LC were compared. As shown in Figs. 12 (d), and (e), under air-dry controlled and uncontrolled curing conditions, the ME values of the concrete mixes with W/B ratio of 0.37 were on average about 4% and 5.6%, respectively, higher than those of the mixes with W/B ratio of 0.42. The corresponding values for wet, 3-day wet, 14-day wet and 90 °C vapour curing conditions were about 7.1%, 5.7%, 5.8% and 8%, respectively. So, when concrete specimens were cured under 90 °C vapour curing and by immersion in a water tank, the difference between the results of low and high W/B ratios slightly increased.
The results showed that FRC mixes containing LECA were efficiently cured under 90 °C va-pour curing to achieve the highest mechanical properties, where the ME of concrete mixes under this curing regime was on average 3.5% higher than that under wet curing, as seen in Figs. 12(a) and (f). Fallah and Nematzadeh [41] obtained the mechanical properties of concrete containing 0.1-0.5% PF, where the ME of concrete decreased by adding more than 2% PF. Similarly, in this study there was no difference between the results of LC with 0.1% PF and the control mix, while the ME decreased by increasing the PF content. Furthermore, LC with 1% SF can be considered as the optimum content to obtain an adequate ME of LC. For instance, under 90 °C vapour cur-ing condition, the ME of LC with 1% SF was on average about 2.2% higher than that of the con-trol mixes, as shown in Fig. 12 (f).
(a) (b)
(c) (d)
(e) (f)
Fig. 12. ME of LC mixes under: Wet curing (a); 3-day wet curing (b); 14-day wet curing (c); Air-dry controlled curing (d); Air-dry uncontrolled curing (e); 90 °C vapour curing (f)
Table 6. ME ratios of FRC mixes to control mixes
Curing regimes SF1 − L Ctrl − L SF2 − L Ctrl − L SF3 − L Ctrl − L SF1 − H Ctrl − H SF2 − H Ctrl − H SF3 − H Ctrl − H PF1 − L Ctrl − L PF2 − L Ctrl − L PF3 − L Ctrl − L PF1 − H Ctrl − H PF2 − H Ctrl − H PF3 − H Ctrl − H Wet 1.02 0.91 0.86 1.01 0.89 0.84 0.98 0.93 0.89 0.97 0.94 0.88 3-day wet 1.03 0.92 0.86 1.02 0.92 0.86 1.04 0.91 0.9 1 0.9 0.9 14-day wet 1.03 0.92 0.85 1.02 0.9 0.86 0.98 0.91 0.91 0.99 0.9 0.89 Air-dry controlled 1 0.91 0.91 1.01 0.91 0.87 0.99 0.96 0.91 1 0.91 0.89 Air-dry uncontrolled 1.02 0.91 0.88 1.03 0.93 0.88 1 0.94 0.91 0.99 93 0.92 90 °C vapour 1.03 0.92 0.84 1.02 0.89 0.85 0.97 0.92 0.89 0.98 0.9 0.88 0 5 10 15 20 25 30 3 days 7 days 28 days 60 days M o d u lu s o f el a st ic it y (G P a
) Wet curing condition
0 5 10 15 20 25 3 days 7 days 28 days 60 days M o d u lu s o f el a st ic it y (G P a
) 3-day wet curing condition
0 5 10 15 20 25 30 3 days 7 days 28 days 60 days M o d u lu s o f e la st ic it y (G P a
) 14-day wet curing condition
0 5 10 15 20 25 3 days 7 days 28 days 60 days M o d u lu s o f el a st ic it y (G P a
) Air-dry controlled curing condition
0 5 10 15 20 25 3 days 7 days 28 days 60 days M o d u lu s o f el a st ic it y (G P a )
Air-dry uncontrolled curing condition
0 5 10 15 20 25 30 3 days 7 days 28 days 60 days M o d u lu s o f e la st ic it y (G P a )
Similarly to what occurred for CS and STS, in most cases the ME values of concrete mixes with 0.37 W/B ratio were slightly more scattered than those with 0.42 W/B ratio, due to the generation of more air-voids in the concrete mixes with lower W/B ratio. For instance, the SD of the control mixes under wet curing at 28 days was on average about 1.7GPa and 1.5 GPa for the W/B ratios of 0.37 and 0.42, respectively, as shown in Fig. 12 (a). However, there was no significant difference between the SD of concrete mixes with low and high W/B ratios. The reason is that the trapped water molecules in LECA were given back to the empty capillary pores to compensate the lack of free water in con-crete mixes, as shown in Fig. 7. Meanwhile, the SD values of FRC mixes in the ME test increased as the SF and PF content increased. Generally, the CS values of concrete mixes under wet and 90 °C vapour curing were less scattered than those under other types of curing conditions, while the highest SD values were obtained for concrete mixes under air-dry uncontrolled curing.
The relationships between the cylindrical CS and ME for LC with various contents of PF and SF are shown in Fig. 13 and compared with the equation proposed by ACI 318 [58].
For W/B ratio of 0.37, four power equations (single-variable equations) of Ec = 3.9508fc
0.46
,Ec =
4.6352fc0.41, Ec = 7.1931fc0.27, and Ec = 5.6774fc0.34 with correlation coefficients ( ) of 0.82, 0.88,
0.72, and 0.79 were obtained for LC with 0%, 0.1%, 0.2%, and 0.3% PF, respectively, as indicated in
Fig. 13(a). According to Figs. 13(b), the corresponding equations for W/B ratio of 0.42 were Ec =
6.6763fc 0.3 , Ec = 7.2633fc 0.27 , Ec = 5.9683fc 0.31 , and Ec = 4.9706fc 0.37
with correlation coefficients ( )
of 0.7, 0.79, 0.71, and 0.81, where fc is the cylindrical CS and Ec is the estimated ME. The results of
this study showed that the correlation curves proposed by ACI 318 [58] provided higher estimates of the ME of LC and FRC with LECA. Similarly, the correlation curves of LC proposed by Tomosawa and Noguchi [79] underestimated the ME of normal concrete. Of the different calibration curves,
the one of the LC control mix was closer to that of ACI 318 [58].
(a) (b)
(c) (d)
Fig. 13. Variation of ME vs. CS for LC with: PF and W/B ratio of 0.37(a); PF and W/B ratio of 0.42 (b); SF and W/B ratio of 0.37 (c); SF and W/B ratio of 0.42 (d)
Concerning the addition of SF, for W/B ratio of 0.37, four power equations (single-variable
equations) of Ec = 3.9508fc 0.46 ,Ec = 3.644fc 0.48 , Ec = 5.12fc 0.39 , and Ec = 8.0449fc 0.23 with
correla-tion coefficients ( ) of 0.82, 0.78, 0.78, and 0.72 were obtained for LC with 0%, 1%, 2%, and
3% SF, respectively. The corresponding equations for W/B ratio of 0.42 were Ec = 6.6763fc0.3, Ec
= 6.149fc0.32, Ec = 7.4242fc0.26, and Ec = 6.3954fc0.29 with correlation coefficients ( ) of 0.7,
0.73, 0.71, and 0.72. Similarly to LC with PF, the correlation curve proposed by ACI 318 [58]
Ec= 4.6352fc0.41 R² = 0.88 Ec= 7.1931fc0.27 R² = 0.72 Ec = 5.6774fc0.34 R² = 0.79 Ec= 4.733fc0.5 Ec = 3.9508fc0.46 R² = 0.82 15 17 19 21 23 25 27 29 31 33 20 25 30 35 40 45 PF0.1- L PF0.2- L PF0.3- L Ctrl- L Power (PF0.1- L) Power (PF0.2- L) Power (PF0.3- L) Power (ACI 318) Power (Ctrl- L) M o d u lu s o f e la s ci ty ( G P a )
Cylindrical compressive strength(MPa)
Ec= 7.2633fc0.27 R² = 0.79 Ec= 5.9683fc0.31 R² = 0.71 Ec= 4.9706fc0.37 R² = 0.81 Ec= 4.733fc0.5 Ec= 6.6763fc0.3 R² = 0.7 13 15 17 19 21 23 25 27 29 31 15 20 25 30 35 40 45 PF0.1- H PF0.2- H PF0.3- H Ctrl- H Power (PF0.1- H) Power (PF0.2- H) Power (PF0.3- H) Power (ACI 318) Power (Ctrl- H)
Cylindrical compressive strength(MPa)
M o d u lu s o f e la s ci ty ( G P a ) Ec = 3.644fc0.48 R² = 0.78 Ec= 5.12fc0.39 R² = 0.78 Ec= 8.0449fc0.23 R² = 0.72 Ec= 4.733fc0.5 Ec= 3.9508fc0.46 R² = 0.82 13 15 17 19 21 23 25 27 29 31 33 15 20 25 30 35 40 45 SF1- L SF2- L SF3- L Ctrl- L Power (SF1- L) Power (SF2- L) Power (SF3- L) Power (ACI 318) Power (Ctrl- L)
Cylindrical compressive strength(MPa)
M o d u lu s o f el a s c it y ( G P a ) Ec = 6.149fc0.32 R² = 0.73 Ec= 7.4242fc0.26 R² = 0.71 Ec= 6.3954fc0.29 R² = 0.72 Ec= 4.733fc0.5 Ec= 6.6763fc0.3 R² = 0.7 13 15 17 19 21 23 25 27 29 31 33 15 20 25 30 35 40 45 SF1- H SF2- H SF3- H Ctrl- H Power (SF1- H) Power (SF2- H) Power (SF3- H) Power (ACI 318) Power (Ctrl- H)
Cylindrical compressive strength(MPa)
M o d u lu s o f el a s c it y ( G P a )
overestimated the ME of LC with SF, as seen in Figs. 13(c) and (d). Of the different calibration curves of FRC mixes, the one of LC made with 1% SF was closer to that of ACI 318 [58].
Ac-cording to Fig. 13, all correlation coefficients ( ) were higher than 0.7; therefore, all equations
for LC mixes can reliably estimate the ME.
4. Conclusions
This paper investigated the effect of SF and PF at various contents on the mechanical proper-ties of concrete with LECA under six curing conditions at early and old ages. According to the experimental results, the following main conclusions can be drawn:
The CS of the LC control mixes under wet, 3-day and 14-day wet curing were nearly the same, particularly at early ages (3 days and 7 days), while these values for W/B ratios of 0.37 and 0.42 under wet curing were on average about 11% and 17.2%, respectively, higher than those under 3-day and 14-day wet curing at 28 and 60 days. In addition, the CS of the LC control mixes under 3-day wet curing were higher than those under air-dry uncontrolled curing, particularly at early ages, while there was no significant difference between the results under these curing regimes at older ages;
A comparison of the various curing conditions showed that, under 90 °C vapour and wet curing, the hydration process and chemical reactions increased more for concrete mixes with the low W/B ratio (0.37), leading to an increase in the difference between the re-sults of low and high W/B ratios;
The 90 °C vapour curing can be considered as the best curing condition for FRC mixes with LECA to achieve the highest CS, where the cube CS of concrete mixes under 90 °C vapour curing was on average 7.2% higher than that of the mixes under wet curing;
1% SF can be seen as the optimum content in concrete mixes with LECA to achieve the highest CS and ME. Meanwhile, 3% SF or 0.3% PF can be considered the opti-mum content to obtain an adequate STS of LC;
The ductile failing behaviour of LC with SF was more evident than that of concrete with PF and it seems that SF can better bridge the cracks and further delay the growth rate of tensile cracks;
Similarly to the CS test, the FRC mixes containing LECA were efficiently cured under 90 °C vapour curing to achieve the highest STS and ME;
The comparison of data under two initial curing conditions of 3-day wet curing and 90
°C vapour curing for 2 days showed that the difference between the results of these curing conditions increased by increasing the age of concrete specimens and the initial
period of curing by 90 °C vapour for 2 days was more effective than that by water for 3
days in improving the mechanical properties of FRC and LC, particularly at older ages;
For CS, the SD of FRC mixes increased as the SF and PF content increased, contrarily to STS. Meanwhile, the CS values of concrete mixes made with SF were more scattered than those of concrete mixes made with PF. However, the STS values of concrete mixes made with SF were less scattered than those of concrete mixes made with PF;
The CS values of concrete mixes under wet and 90 °C vapour curing were less scat-tered than those under other types of curing, while the highest SD values were ob-tained for concrete mixes under air-dry uncontrolled curing. Meanwhile, the SD values under air-dry controlled and uncontrolled curing were very close to each other, similarly to what occurred for STS;
found to be nearly the same under wet curing, similarly to what occurred for STS. However, these values under 90 °C vapour curing for CS and STS were on average about 3% and 5.7%, respectively, lower than those under wet curing at early ages (3 and 7 days), while the corresponding values under 90 °C vapour curing were on average about 8.4% and 3.4% more than those under wet curing at older ages (28 and 60 days); In most cases, the mechanical strengths of concrete mixes with 0.37 W/B ratio were
slightly more scattered than those with 0.42 W/B ratio. However, the incorporation of LECA prevented further scatter of mechanical strengths of concrete mixes with low W/B ratio in the CS, STS and ME tests;
The one-variable equations reliably estimated the STS and ME of FRC with LECA. In addition, the correlation curves proposed by ACI 318 overestimated the STS and ME of LC and FRC with LECA;
By increasing the age of concrete mixes under different curing conditions, the estimated STS values obtained using the calibration curves for LC incorporating SF were found to
be closer to those using ACI 318 and the bridging effect of SF appeared to be more
effec-tive than that of PF in preventing macro-cracks propagation, particularly at older ages;
Of the different calibration curves to estimate the STS of FRC mixes, the one of LC made with 0.3% PF or 3% SF was closer to that of ACI 318. Concerning the estimated ME, the correlation curve of control mix and LC made with 1% SF was closer to that of ACI 318.
References
1. C. Meyer, The greening of the concrete industry, Cement and Concrete Composites, 31(8) (2009) 601–605. 2. M. Saberian, J. Li, B.T. Nguyen, S. Setunge, Estimating the resilient modulus of crushed recycled pavement
materials containing crumb rubber using Clegg impact value, Resources, Conservation and Recycling, 141 (2019) 301–307.
3. M. Kazemi, R. Madandoust, J. de Brito, Compressive strength assessment of recycled aggregate concrete using Schmidt rebound hammer and core testing, Construction and Building Materials, 224 (2019) 630-638. 4. J.A. Bogas, J. de Brito, J.M. Figueiredo, Mechanical characterization of concrete produced with recycled
lightweight expanded clay aggregate concrete, Journal of Cleaner Production, 89 (2015) 187–195.
5. M. Saberian, J. Li, D. Cameron, Effect of crushed glass on behavior of crushed recycled pavement ma-terials together with crumb rubber for making a clean green base and subbase, Journal of Mama-terials in Civil Engineering , 31(7) (2019) 1-7.
6. J.A. Bogas, J. Brito, J. Cabaço, Long-term behaviour of concrete produced with recycled lightweight expand-ed clay aggregate concrete, Construction and Building Materials, 65 (2014) 470–479.
7. M. Medine, H. Trouzine, J.B. De Aguiar, A. Asroun, Durability of five years aged lightweight concretes containing rubber aggregates, Periodica Polytechnica Civil Engineering, 62(2) (2018) 386–397.
8. S. Iqbal, A. Ahsan, K. Holschemacher, Y. Ribakov, T.A. Bier, Effect of fly ash on properties of self-compacting high strength lightweight concrete, Periodica Polytechnica Civil Engineering, 61 (2017) 81. 9. H. AzariJafari, A. Tajadini, M. Rahimi, J. Berenjian, Reducing variations in the test results of self-consolidating
lightweight concrete by incorporating pozzolanic materials, Construction and Building Materials, 166 (2018) 889–897.
10. M. Maghfouri, P. Shafigh, Z. Binti Ibrahim, V. Alimohammadi, Quality control of lightweight aggregate concrete based on initial and final water absorption tests, IOP Conference Series, Materials Science and En-gineering, 210(1) (2017) 1-14.
11. T.A. Holm, T.W. Bremner, State-of-the-art report on high-strength, high durability structural low-density concrete for applications in severe marine environments. Us Army Corps of Engineers, Washington, USA. Structural Laboratory, ERDC/SL TR-00-3, (2000).
12. S. Chandra, L. Berntsson, Lightweight aggregate concrete, science, technology and applications, Noyes pub-lications -William Andrew Publishing, USA, (2003).
13. J.B. Newman, Properties of structural lightweight aggregate concrete, In: Clarke, J.L. (Ed.), Structural Lightweight Aggregate Concrete. Chapman & Hall, London, UK, (1993) 19–44.
14. J.A. Bogas, Characterization of structural lightweight expanded clay aggregate concrete, PhD thesis in Civil Engi-neering. Technical University of Lisbon, Instituto Superior Tecnico, Lisbon, Portugal (in Portuguese), (2011). 15. Netweber. LECA [Online]. Available from: 〈http://www.netweber.co.uk/
filead-min/user_upload/Literature/LECA___LWA_Brochure_LR-V1.pdf〉 (Accessed 12 July 2015).
16. P. Shafigh, L.J. Chai, H.B. Mahmud, M.A. Nomeli, A comparison study of the fresh and hardened properties of normal weight and lightweight aggregate concretes, Journal of building Engineering, 15 (2018) 252–260. 17. L. Evangelista, J. de Brito, Mechanical behaviour of concrete made with fine recycled concrete aggregates,
Cement and Concrete Composites, 29(5) (2007) 397–401.
18. S.T. Yildirim, C. Meyer, S. Herfellner, Effects of internal curing on the strength, drying shrinkage and freeze-thaw resistance of concrete containing recycled concrete aggregates, Construction and Building Mate-rials, 91 (2015) 288–296.