58th International Congress of Meat Science and Technology, 12-17th August 2012, Montreal, Canada
EFFECT OF DURATION AND TEMPERATURE OF PREVIOUS
VACUUM-PACKED STORAGE ON THE OXIDATIVE STABILITY OF
BELGIAN BLUE MEAT PACKED IN HIGH-OXYGEN ATMOSPHERE
Pedro H. Imazaki, Assia Tahiri, Jacqueline Thimister, Marie-Louise Scippo and
Antoine Clinquart
Department of Food Science, University of Liège, Sart Tilman B43b, Liège, Belgium, 4000.
Abstract – The aim of this experiment was to study the effect of duration and temperature of previous vacuum-packed (VP) storage on the oxidative stability of Belgian Blue meat packed in high-oxygen atmosphere. VP striploins from bulls and cows were stored at −1 °C and +4 °C for up to 80 days and analyzed. These same meat samples were also repackaged under modified atmosphere (MA) – 70 % O2/30 % CO2 – at different times, stored 2 d at
+4 °C and 5 d at +8 °C, and then analyzed. Meat from cows presented a lower loss of redness than meat from bulls. A low lipid oxidation was observed in VP samples, but an increase of lipid oxidation took place after MA repackaging. Meat from cows presented a higher αααα-tocopherol content. A decrease of α-tocopherol content during storage was observed as well. The fat content was also higher in meat from cows than in meat from bulls. The duration and temperature of vacuum-packed storage influenced the sensitivity of Belgian Blue beef to pigment and lipid oxidation during subsequent high-oxygen storage.
Key Words – meat conservability, beef, Belgian Blue, color stability, lipid oxidation, modified atmosphere packaging, α-tocopherol.
I. INTRODUCTION
The shelf life of fresh meat is limited by alteration
phenomena that can degrade organoleptic
properties. In this way, a major challenge to the fresh meat industry is to maintain the fresh appearance of the product.
Oxidative processes are main non-microbiological factors implicated in quality deterioration of meat during chilled storage [1]. Lipid oxidation results in formation of aldehydes, some of them being often associated with the development of off-flavors [2] even at low concentrations [3]. The oxidation of myoglobin turns this pigment to
metmyoglobin, which gives a brown color to meat. The Belgian meat sector often complains of a sensitivity of Belgian Blue (BB) beef to oxidation processes, in particular in high-oxygen modified atmosphere packaged (MAP) meat previously aged in vacuum conditions.
The objective of this experiment was to study the effect of duration and temperature of previous vacuum-packaged storage on the conservability of BB meat packed in high-oxygen atmosphere.
II. MATERIALS AND METHODS
Samples: Two days after slaughter, eight
vacuum-packed (VP) striploins from two categories of BB animals (bulls 1.81 ± 0.10 yr and culled cows
4.99 ± 0.58 yr) were supplied by a slaughterhouse
located in the Walloon Region (Belgium). In the lab, 3 cm thick steaks were cut, vacuum packaged, and stored at −1 °C or +4 °C for up to 80 d (Fig. 1).
Figure 1. Experimental design for VP samples.
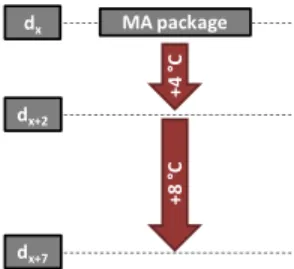
Each 20 d, a part of the samples was repackaged in trays containing a modified atmosphere (MA) – 70 % O2/30 % CO2 –, stored 2 d at +4 °C and 5 d
at +8 °C (in order to simulate distribution at the retail level according to AFNOR XP V 01-003 standard), and analyzed (Fig. 2).
reception cut in steaks
d0 -1 °C +4 °C
vacuum package
58th International Congress of Meat Science and Technology, 12-17th August 2012, Montreal, Canada Figure 2. Experimental design for modified atmosphere
(MA)-packed samples (x = 0, 20, 40, 60 or 80).
Color measurement: instrumental color of samples
was evaluated 1.5 h after removal from package using a Minolta CR-400 chromameter (11 mm aperture, D65 illuminant, 2° observation angle).
Values for CIE L*, a* and b* were measured on 10 different zones of each sample and averaged.
Metmyoglobin %: The method of Tang et al. [4]
was used to determinate the proportions of oxidized, deoxygenated and oxygenated forms of myoglobin at 503, 525, 557 and 582 nm.
Lipid oxidation measurement: To assess the lipid
oxidation, the thiobarbituric acid (TBA) test based on a spectrophotometric quantification of a complex formed with malondialdehyde (MDA) was performed as described by Raharjo et al. [5].
α-tocopherol content: A protocol adapted from Liu
et al. [6] was used to extract and quantify
α-tocopherol. HPLC analysis was carried out using a Model 600 E solvent delivery system, equipped with a Model 717 automatic injector, a MistralTM oven and both 996 PDA and 2475 Fluorescence detectors (all from Waters). HPLC conditions: stationary phase: Waters Resolve 5 µm spherical silica column (3.9 × 150 mm), column temperature: 15 °C, mobile phase: isooctane:THF 96 %:4 % (v/v), flow rate: 1.0 mL/min, injection volume:
30 µL, detection: fluorescence (excitation
wavelength 296 nm and emission wavelength 325 nm), calculation: external standard method based on peak area.
Fat content: The fat content was determined by
Soxhlet method (ISO 1444: 1996).
Statistical analysis: Experimental data for each
response variable was analyzed by ANOVA using the GLM procedure. Whenever a post-hoc test was suitable, Tukey test was performed.
III. RESULTS AND DISCUSSION
Color: An increase of chromaticity a* (redness)
was observed in VP striploins during the first 20 days of storage (Table 1). This result was also reported by Insausti et al. [7] and could be explained by the fact that the exposition of steaks to oxygen is possibly higher in vacuum bags for some days, even if high barrier bags are used, than at the core of a freshly cut muscle immediately packaged under vacuum. No spectacular color evolution or temperature impact was observed during VP storage for 80 days.
After the 40th day of conservation under vacuum, an important decrease of redness was observed once the meats were repackaged and stored under MA (Table 1).
Table 1 Chromaticity a* in striploins
Sex Days Package Storage temperature under vacuum* -1 °C +4 °C M 0 VP 22.10 ± 1.29 ac 20 25.66 ± 3.32 b 25.79 ± 4.35 a 40 26.57 ± 2.91 b 25.62 ± 3.77 a 60 25.35 ± 1.39 ab 23.25 ± 3.93 ac 80 24.67 ± 2.18 ab 21.56 ± 3.01 c 0 + 7 MAP 26.01 ± 1.64 a 20 + 7 25.89 ± 3.09 a 22.64 ± 5.79 a 40 + 7 17.43 ± 4.32 ab 10.51 ± 4.19 b 60 + 7 14.07 ± 5.23 b 8.44 ± 0.78 b 80 + 7 14.14 ± 6.45 b 7.60 ± 0.90 b F 0 VP 20.07 ± 3.26 a 20 28.54 ± 2.06 b 26.62 ± 2.80 b 40 27.59 ± 1.90 b 24.96 ± 1.60 b 60 25.38 ± 2.84 bc 19.23 ± 2.36 a 80 23.40 ± 2.01 ac 18.30 ± 3.37 a 0 + 7 MAP 26.56 ± 1.25 ab 20 + 7 27.72 ± 4.56 a 24.97 ± 4.93 a 40 + 7 24.13 ± 4.91 b 17.10 ± 6.45 b 60 + 7 17.16 ± 4.55 c 11.75 ± 1.62 b 80 + 7 15.72 ± 5.45 c 12.81 ± 3.24 b * Not applicable to day 0 (+ 7). Means and standard deviation are indicated (n = 4). Different letters within the same column (time effect) indicate significant differences (P < 0.05).
When chromaticity a* values obtained from MA-packed striploins (y) were plotted against days of previous storage under vacuum, a linear relation was found. The slopes obtained for bull meat samples (−0.18, R² = 0.87 and −0.26, R² = 0.87 for a previous storage under vacuum at −1 °C and +4 °C respectively) were higher than the slopes obtained for cow meat samples (−0.16, R² = 0.86
dx MA package + 4 ° C + 8 ° C dx+2 dx+7
58th International Congress of Meat Science and Technology, 12-17th August 2012, Montreal, Canada
and −0.19, R² = 0.89 for a previous storage under vacuum at −1 °C and +4 °C respectively) indicating that meat from cows presented a lower loss of redness than meat issued from bulls.
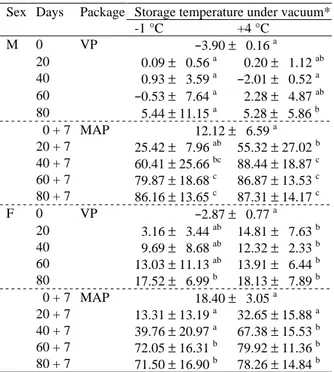
Metmyoglobin %: A low increase of
metmyoblin %, more pronounced in meat from cows, was observed in VP striploins (Table 2). At the 20th day of VP storage, a temperature effect was observed in meat from cows as well.
Once the samples were repackaged under MA, a storage time effect was clearly evident. It was also observed that the duration and temperature applied during previous VP storage influenced the sensitivity of meat to myoglobin oxidation during MAP storage. The value of 40 % reported by Greene et al. [8] to cause meat rejection by consumers was exceeded in most of the samples after 40 days of storage under vacuum and seven days of storage under MA. These results indicate that a seven day shelf life under MA can be obtained only if previous storage in VP does not exceed 40 days at −1 °C, and 20 days at +4 °C (Table 2).
Lipid oxidation measurement: A low lipid
oxidation was observed in VP samples. Among the MA-packaged samples, lipid oxidation was more apppapapapapapapapapppppppapapapapa
Table 2 Metmyoglobin % in striploins
Sex Days Package Storage temperature under vacuum* -1 °C +4 °C M 0 VP −3.90 ± 0.16 a 20 0.09 ± 0.56 a 0.20 ± 1.12 ab 40 0.93 ± 3.59 a −2.01 ± 0.52 a 60 −0.53 ± 7.64 a 2.28 ± 4.87 ab 80 5.44 ± 11.15 a 5.28 ± 5.86 b 0 + 7 MAP 12.12 ± 6.59 a 20 + 7 25.42 ± 7.96 ab 55.32 ± 27.02 b 40 + 7 60.41 ± 25.66 bc 88.44 ± 18.87 c 60 + 7 79.87 ± 18.68 c 86.87 ± 13.53 c 80 + 7 86.16 ± 13.65 c 87.31 ± 14.17 c F 0 VP −2.87 ± 0.77 a 20 3.16 ± 3.44 ab 14.81 ± 7.63 b 40 9.69 ± 8.68 ab 12.32 ± 2.33 b 60 13.03 ± 11.13 ab 13.91 ± 6.44 b 80 17.52 ± 6.99 b 18.13 ± 7.89 b 0 + 7 MAP 18.40 ± 3.05 a 20 + 7 13.31 ± 13.19 a 32.65 ± 15.88 a 40 + 7 39.76 ± 20.97 a 67.38 ± 15.53 b 60 + 7 72.05 ± 16.31 b 79.92 ± 11.36 b 80 + 7 71.50 ± 16.90 b 78.26 ± 14.84 b * Not applicable to day 0 (+ 7). Means and standard deviation are indicated (n = 4). Different letters within the same column (time effect) indicate significant differences (P < 0.05).
important in meat from bulls. An important time effect was also observed (Table 3).
If a critical limit of 1.0 mg MDA/kg meat were established, the maximum shelf-life of tested VP meat permitting a subsequent seven day shelf life under MA would be less than 20 days for meat from bulls and 40 days for meat from cows.
α-tocopherol content: VP samples from cows
presented an initial α-tocopherol content higher than the recommended concentration of 3.5 µg/g proposed by Liu et al., which would be “the
minimum muscle α-tocopherol concentration that
provides for near maximal suppression of lipid oxidation and metmyoglobin formation in fresh beef” [9]. After 40 days of storage, the content of α-tocopherol tended to decrease (Table 4), which was also reported by Insani et al. [1].
Fat content: The fat content was 1.13 ± 0.41 % in
meat from bulls and 1.83 ± 0.79 % in meat from
cows. The higher content of α-tocopherol in meat
from cows may be partially explained by its higher fat content, since this molecule is lipophilic. Even thought discoloration and lipid oxidation were discrete in VP samples, an important change of these two variables was observed when the same samples were repacked under MA.
aaaaaaaaaaaaaaa
Table 3 MDA-equivalent (mg/kg) in striploins
Sex Days Package Storage temperature under vacuum* -1 °C +4 °C M 0 VP 0.10 ± 0.01 a 20 0.10 ± 0.06 a 0.17 ± 0.07 ab 40 0.12 ± 0.01 a 0.17 ± 0.05 ab 60 0.24 ± 0.08 b 0.30 ± 0.09 b 80 0.15 ± 0.02 ab 0.27 ± 0.09 b 0 + 7 MAP 0.66 ± 0.58 a 20 + 7 1.40 ± 0.42 ab 1.33 ± 0.64 ab 40 + 7 2.19 ± 0.72 bc 3.12 ± 1.37 c 60 + 7 3.36 ± 0.59 d 2.68 ± 0.98 bc 80 + 7 2.73 ± 0.90 cd 3.00 ± 1.65 c F 0 VP 0.17 ± 0.10 a 20 0.08 ± 0.05 ab 0.10 ± 0.05 ab 40 0.09 ± 0.01 ab 0.13 ± 0.05 ab 60 0.12 ± 0.03 b 0.21 ± 0.04 b 80 0.13 ± 0.02 b 0.17 ± 0.04 b 0 + 7 MAP 0.24 ± 0.09 a 20 + 7 0.48 ± 0.15 ab 0.47 ± 0.22 a 40 + 7 0.90 ± 0.23 ab 1.47 ± 0.16 b 60 + 7 1.16 ± 0.27 b 1.34 ± 0.32 b 80 + 7 1.89 ± 0.62 1.48 ± 0.75 b * Not applicable to day 0 (+ 7). Means and standard deviation are indicated (n = 4). Different letters within the same column (time effect) indicate significant differences (P < 0.05).
58th International Congress of Meat Science and Technology, 12-17th August 2012, Montreal, Canada Table 4 α-tocopherol content in VP striploins (µg/g)
Sex Days Storage temperature* -1 °C +4 °C M 0 3.01 ± 0.66 ab 40 3.38 ± 0.81 a 3.38 ± 1.38 a 80 2.64 ± 1.08 b 2.20 ± 0.92 c F 0 3.99 ± 0.50 a 40 3.92 ± 0.70 a 4.03 ± 0.47 a 80 3.29 ± 0.54 b 3.34 ± 0.66 b
* Not applicable to day 0. Means and standard deviation are indicated (n = 4). Different letters within the same column (time effect) indicate significant differences (P < 0.05)
Furthermore, the higher α-tocopherol content in cows could have prevented these meats from loss of redness and lipid oxidation.
A strong correlation was observed between the individual α-tocopherol content at the moment of MA repackaging and the lipid oxidation (R = −0.63), suggesting that the decrease of α-tocopherol content could disrupt lipid stability.
IV. CONCLUSION
The duration and temperature of vacuum-packed storage seemed to influence the sensitivity of Belgian Blue beef to pigment and lipid oxidation during subsequent high-oxygen MAP storage. In the conditions of the present experiment, the storage of VP Belgian Blue beef permitting a subsequent seven day shelf-life under MA has to be inferior to 20 days for bulls and inferior to 60 or 40 days for cows (for a previous VP storage at
−1 °C and +4 °C respectively).
The decrease of α-tocopherol content could be
associated with the decrease of the analyzed quality parameters.
ACKNOWLEDGEMENTS
This study was funded by the General Operational Direction of Agriculture, Natural Resources and Environment (DGARNE) of the Walloon Region (Belgium).
REFERENCES
1. Insani, E. M., Eyherabide, A., Grigioni, G., Sancho, A. M., Pensel, N. A. & Descalzo, A.M. (2008). Oxidative stability and ist relationship with natural antioxidants during refrigerated retail display of beef produced in Argentina. Meat Science 79: 444-452.
2. Smith, G. C., Morgan, J. B., Sofos, J. N. & Tatum, J. D. (1996). Supplemental vitamin E in beef cattle diets to improve shelf-life of beef. Animal Feed Science and Technology 59: 207-214.
3. Stetze, A. J., Cadwallader, K., Singh, T. K., Mckeith, F. K & Brewer, M. S. (2008). Effect of enhancement and ageing on flavor and volatile compounds in various beef muscles. Meat Science 79: 13-19.
4. Tang, J., Faustman, C., Hoagland, T. A. (2004). Krzywicki revisited: equations for spectrophotometric determination of myoglobin redox forms in aqueous meat extract. Journal of Food Science, 69: C717-C720.
5. Raharjo, S., Sofos, J. N. & Schmidt, G. R. (1992). Improved Speed, Specificity, and Limit of Determination of an Aqueous Acid Extraction Thiobarbituric Acid-C18 Method for Measuring
Lipid Peroxidation in Beef. Journal of Agricultural and Food Chemistry, 40: 2182-2185.
6. Liu, Q. P., Scheller, K. K., Schaefer, D. M. (1996). Technical note: A simplified procedure for vitamin E determination in beef muscle. Journal of Animal Science, 74: 2406-2410.
7. Insausti, K., Beriain, M. J., Purroy, A., Alberti, P., Lizaso, L. & Hernandez, B. (1999). Colour stability of beef from different Spanish native cattle breeds stored under vacuum and modified atmosphere. Meat Science, 53: 241-249.
8. Greene, B. E., Hsin, I. M. & Zipser, M. W. (1969). Retardation of oxidative color changes in raw ground beef. Journal of Food Science, 36: 940-942. 9. Liu, Q. P., Lanari, M. C. & Schaefer, D. M. (1995). A review of dietary vitamin E supplementation for improvement of beef quality. Journal of Animal Science, 73: 3131-3140.