PROPOSED 2012-2013 PROGRAM-BUDGET
Maintaining the Current Level of Operation with Budget Adjustments (assuming 4.7% inflation)
Main Document
San Jose, Costa Rica July 2011
IICA/CE/Doc. 582(11) Original: Spanish 12–14 July 2011
Contents
I. INTRODUCTION ... 2
II. STRATEGIC GUIDELINES FOR THE 2012-2013 BIENNIUM (ASSUMING 4.7% INFLATION) ... 3
III. OVERALL BUDGET FOR 2012 – 2013 (ASSUMING 4.7% INFLATION) ... 4
IV. TECHNICAL COOPERATION SERVICES FOR 2012-2013 (ASSUMING 4.7% INFLATION) ... 5
V. ALLOCATION OF REGULAR FUND RESOURCES BY CHAPTER (ASSUMING 4.7% INFLATION) ... 6
VI. ALLOCATION OF REGULAR FUND RESOURCES BY TECHNICAL CONCENTRATION PROGRAM (ASSUMING 4.7% INFLATION) ... 1
2
I.
Introduction
This present proposal for the IICA Program Budget for the 2012-2013 biennium takes into consideration the criteria analyzed at the 2011 Regular Meeting of the Special Advisory Committee on Management Issues (SACMI).
This 2012-2013 Program Budget proposal contemplates a scenario in which the Institute’s current levels of operation would be maintained, with some budget adjustments, based on the following considerations:
• The importance of ensuring that the Institute remains a viable instrument of the Member States and to support their efforts to achieve the sustainable development of agriculture, food security and poverty reduction
• The need to gradually make progress in restoring the Institute’s financial capacity to enhance its cooperation services in benefit of the Member States
• Ensure that the Institute has the capacity to respond to the growing demand for cooperation services generated by the new challenges facing agriculture in the Member States • Prevent the loss of purchasing power of the quotas of the
Member States, which was 4.7%1 in 2010, and for
subsequent years
1
This 4.7% corresponds to a weighted average of the inflationary effects of the different currencies in the countries where the Institute operates and the exchange rates between the national currencies and the United States dollar, the currency in which Member State quotas are paid. The Information Document entitled: “Loss of Purchasing Power of Member States Quota Contributions 1995-2010. San Jose, Costa Rica, July 2011” explains the methodology applied to determine that percentage.
• Capitalize on the major efforts made by the Institute to reduce its operating and personnel costs, thereby increasing efficiency
• Assume the depletion of alternative sources of financing used in the past, such as the recovery of quotas owed and miscellaneous income
• Promote the policy established by the current administration to improve the level of the Institutional Net Rate (INR), used to cover the increased costs generated by the administration of projects financed with external resources. This strategy is expected to produce results in the medium term
The proposed budget under which technical cooperation services would be maintained at current levels is based on the need to reduce the amount of resources allocated to cover operating costs (major objects of expenditure 3 to 9) with respect to the 2011 Program Budget and to offset the increases in personnel costs associated with: i) changes in post adjustments of international personnel; ii) salary increases required by law, due to loss of value and to maintain IICA’s current position in the local labor market; and, iii) unfavorable exchange rate movements in some countries. This situation calls for additional financing of US$1,283.1 thousand in 2012 and US$1,343.3 thousand in 2013.
Analysis of Additional Scenarios
The SACMI analyzed two additional scenarios, which are described in Appendix 2: “Program Budget 2012-2013. Scenario 1: Loss of Real Value of Regular Fund Income (without changes in the current level of income)” and Appendix 3: “Program Budget 2012-2013. Scenario 3: Financial Recovery for Implementation of the 2010-2014 MTP (recognizing the effects of the accumulated loss of purchasing power in 2010)”.
The first Scenario (1), in essence, contemplates the loss of value of the Regular Fund income in real terms (without changes in the
current level of income), together with the effects of increased staff costs that must be covered by the Institute due to legal requirements by governments to increase salaries, the effects of inflation in the countries and the revaluation of national currencies in relation to the US dollar.
For 2012, this scenario implies a deficit of US$1,879.1 thousand to cover additional personnel costs, which is reduced to US$1,050.8 thousand by cutting operating costs by US$828.3 thousand. This is the maximum adjustment possible without causing irreversible organizational impacts.
Under this scenario, to cover the deficit in 2012, it would be necessary to make adjustments in the following aspects of the 2010-2014 Medium Term Plan:
• Innovation, technology transfer and extension services (two international professionals)
• Agrobiotechnology and biosafety (two international professionals)
• Clean energies (one international professional, one local professional and one general services position)
• Risk management and risk reduction in agriculture and agribusiness (one international professional)
• Formulation of technical cooperation projects (one international professional)
In 2013 the additional deficit is US$737.1 thousand, which would be covered with the following complementary adjustment measures:
• Reduction of five local professionals and 10 general services positions in the Offices in the Member States
• Reduction of two international professionals, two local professionals and one general services position in the technical concentration programs and technical support units at Headquarters
The third scenario (3) is based on financial recovery for the implementation of the 2010-2014 MTP. It takes into account the accumulated loss of purchasing power of the Institute’s quota resources during 2010, due to the combined effects of inflation, mandatory salary adjustments determined by governments and the net effect of variations in the exchange rate between the national currencies and the United States dollar; and the strengthening of key aspects of technical cooperation in accordance with the 2010-2014 MTP, through the financing of high priority projects affected by the cuts described in the preceding scenarios and some strategic projects that must be implemented as priority lines of action.
This scenario has the following implications: recovery of a deficit of approximately US$4.0 million in 2012 and an additional US$1.4 million in 2013; restoration of the purchasing power of the Institute’s quota resources to the levels reached in 2004-2005; a slight increase in the level of financing for operating costs; and, strengthening technical cooperation in priority areas of the 2010-2014 MTP.
II. Strategic guidelines for the 2012-2013 biennium
(assuming 4.7% inflation)
In implementing the 2010-2014 MTP, IICA will focus its cooperation efforts on four Technical Concentration Programs and two Programs for Cross-cutting Coordination that dovetail with the strategic objectives outlined in the MTP; and on the Center for Strategic Analysis for Agriculture, which supplies the programs with strategic information on sectoral issues.
The Technical Concentration Programs, which are institutional in nature, are as follows:
• Innovation for productivity and competitiveness • Agricultural health and food safety
• Agribusiness and commercialization • Agriculture, territories and rural well-being
4 The Programs for Cross-cutting Coordination are:
• Agriculture, natural resource management and climate change • Agriculture and food security
These Programs are implemented through technical cooperation projects (IICA), which in the case of the Offices in the Member States, respond to the technical cooperation strategies agreed with the relevant authorities.
III. Overall Budget for 2012 – 2013
(assuming 4.7%
inflation)
The Institute finances its technical cooperation activities emanating from mandates of the Governing Bodies with resources from the Regular Fund. That fund is made up of Member State quotas and miscellaneous income, basically obtained from financial yields, tax recovery and the sale of assets and services. In addition, the Institute complements its technical cooperation actions with programs and projects financed with external resources, based on agreements with partners or counterparts. For the Institute, managing external resources means increased technical and administrative personnel requirements as well as higher operating costs. These additional costs are covered by the Institutional Net Rate that the counterparts undertake to pay IICA. It is estimated that the external resources will amount to US$158.5 million in 2012 and US$141.3 million in 2013. The preliminary allocation of INR resources for those years will be US$10.2 and US$9.6 million, respectively.
The final allocation of INR resources is subject to the signing of agreements that give rise to programs and projects financed with external resources and to the projected estimate of INR resources to be generated as a result of those agreements.
The Regular Fund budget (quotas and miscellaneous) for the 2012-2013 biennium is based on the need to cover the deficit generated in
the biennium in order to maintain the technical cooperation services that the Institute provides to its Member States at the current levels. The budget financed with Regular Fund resources, under the work scenario based on maintaining technical cooperation services at current levels, has been calculated based on the following premises:
• Reduce by 5.4% the amount of resources allocated to cover operating costs (major objects of expenditure 3 to 9) in 2012, with respect to the 2011 Program Budget;
• Maintain the number of international professionals (major object of expenditure 1), with a slight increase in annual costs, due to inflation and post adjustments payable to professionals; and,
• Maintain, with only minor changes, the number of local professionals and general services personnel, with an annual increase in costs due to salary increases required by law and given the need to maintain the current position in local labor markets and offset the effects of unfavorable exchange rate movements in some countries.
Personnel costs increased by nearly 7% in 2010, due to the effects already mentioned, forcing the Institute to make savings in other areas.
The amount of additional resources required to finance the budget for this biennium are US$1,283.1 thousand in 2012 and a further US$1,343.3 thousand in 2013.
In this proposal, the Regular Fund budget amounts to US$34,681.3 thousand for 2012, made up of US$28,581.3 thousand in Member State quotas and US$6,100.0 thousand in miscellaneous income. For 2013 the Regular Fund budget is US$36,024.6 thousand, composed of US$29,924.6 in Member State quotas and US$6,100.0 thousand in miscellaneous income.
The variation in quota resources is based on assuming an institutional inflation rate of 4.7%, as mentioned in the Introduction to this document. At the same time, by applying the new percentage distribution of the quotas approved by the OAS, some Member States modify their contributions.
The overall budget for 2012-2013 is shown in Table 1 below:
2011 2012 2013
REGULAR FUND:
QUOTAS OF MEMBER STATES 27,298.2 28,581.3 29,924.6
MISCELLANEOUS INCOME 6,100.0 6,100.0 6,100.0
TOTAL REGULAR FUND 33,398.2 34,681.3 36,024.6
EXTERNAL RESOURCES FOR PROGRAMS AND PROJECTS* 154,582.0 158,451.6 141,274.6
INSTITUTIONAL NET RATE 10,097.3 10,228.4 9,628.9
198,077.5
203,361.3 186,928.1 RESOURCES BY SOURCE
TOTAL
*/ Estimates. Final figures will depend on the agreements signed. Table No. 1 Overall Budget
Maintaining Current Level of Operation with Budget Adjustments (assuming 4.17% inflation)
2011 and 2012 - 2013 Program Budget (US$ x 000)
Table No. 2, which is attached to the present document, indicates the
scales of contribution of the Member States in keeping with the new distribution approved by the OAS and the financial adjustment based on a 4.7% inflation rate.
Financing of budgetary requirements to offset inflation (4.7%)
In order to finance the additional budgetary requirements for 2012 and 2013, the following alternatives are available:
i) In light of the change in the percentage contributions to the financing of IICA, the countries whose quotas have been reduced in absolute terms (Table No. 2), would carry this differential as extra quotas, thereby maintaining the current level of contributions. There is a precedent to this resolution in the 2007 OAS budget. This would amount to US$753,536.
In order to offset the deficit of US$1,230,0002 in 2012,
US$476,500 would be required, in addition to the measure already indicated, and could be covered by in-kind contributions from the Member States in the form of office space, communication, security or other extraordinary support. ii) Combine the option of extra quotas in the point above with
taking inflation for 2013 into account.
Table 3 shows the variations in the Regular Fund budget for the
years 2011, 2012 and 2013. As can be seen in this table, the Member States’ quota contributions would have to increase by 4.7% in 2012 and 2013, merely maintain to the technical cooperation services at present levels.
Table 4 presents a breakdown of the proposed budgetary allocation
for the 2012-2013 biennium by Programming Center, in accordance with the guidelines of the 2010-2014 Medium Term Plan.
Table 5 summarizes the evolution of the Regular Fund budget since
1994 and the proposal for the 2012-2013 biennium, with the amounts indicated previously.
2
A portion of the needs (US$52,961) are met by reducing Cuba´s quota and increasing that other Member States.
6
IV. Technical cooperation services for 2012-2013
(assuming 4.7% inflation)
The resources are budgeted in accordance with the guidelines of the 2010-2014 Medium Term Plan, the Technical Cooperation Strategies agreed with the governments of the Member States and the Institute’s technical cooperation projects approved by the pertinent bodies of the General Directorate.
Furthermore, to facilitate and enhance the delivery of technical cooperation services, the operational units have prepared a Management Strategy establishing the objectives, expected results and achievement indicators.
Appendix 1 presents the general objectives, expected results and
achievement indicators of IICA’s Projects and of the Management Strategies of the operational units.
V. Allocation of Regular Fund Resources by
Chapter
(assuming 4.7% inflation)
The Institute’s budget is divided into four Chapters:
ο Chapter I: Direct Technical Cooperation Services ο Chapter II: Management Costs
ο Chapter III: General Costs and Provisions
ο Chapter IV: Renewal of Infrastructure and Equipment
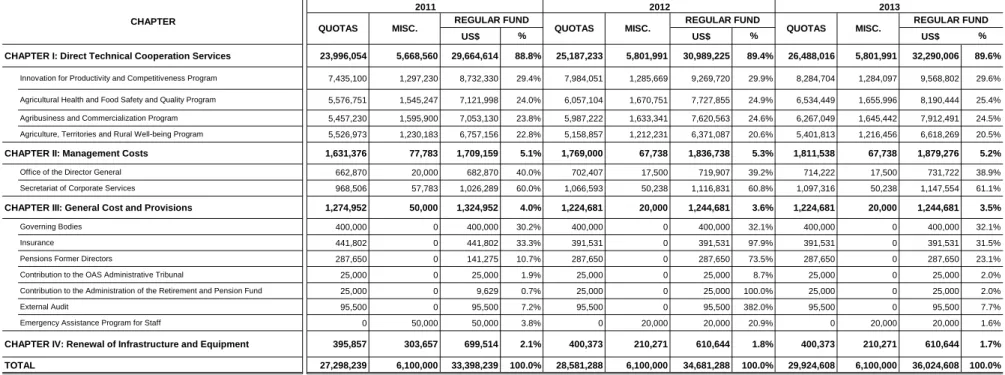
Table 6 shows the proposed allocation of Regular Fund resources by
Chapter.
Chapter I: Direct Technical Cooperation Services
This chapter includes the costs of the Institute’s technical cooperation actions at the national, regional and hemispheric levels required to achieve the objectives defined in the Medium Term Plan. It includes IICA’s contribution to the Tropical Agriculture Research and Higher Education Center (CATIE), the costs of the Center for Strategic Analysis for Agriculture (CAESPA) and the unit responsible for information and communication technologies (ICTs). The resources allocated for this chapter are as follows:
Chapter I: Direct Technical Cooperation Services (US$)
Source 2011 2012 2013
Quotas 23,996,054 25,187,233 26,488,016
Miscellaneous 5,668,560 5,801,991 5,801,991
Total 29,664,614 30,989,225 32,290,006
The resources allocated to technical cooperation account for 89.4% of the Regular Fund in 2012 and 89.6% in 2013. In 2011 they accounted for 88.8%. There is a clear tendency to give priority to the resources allocated to direct technical cooperation services (see
Table 6).
Chapter II: Management Costs
Chapter II: Management Costs includes the resources of the units responsible for managing the Institute and providing support services. Those units, which are located at Headquarters, are the Office of the Director General and the Secretariat of Corporate Services.
For the purposes of Chapter II: Management Costs, the Office of the Director General includes: the Office of the Director General, the Office of the Deputy Director General, the Coordination of the Office
of the Director General, the Internal Audit Unit, the Legal Services Unit and the Social Communication Unit.
The Corporate Services include the Office of the Director of Corporate Services and services related to finance, human resources, programming, budget, as well as general services.
The resources that these units use to renew their infrastructure and equipment (Chapter IV) are not included. The resources allocated for this chapter are:
Chapter II: Management Costs (US$)
Source 2011 2012 2013
Quotas 1,631,376 1,769,000 1,811,538
Miscellaneous 77,783 67,738 67,783
Total 1,709,159 1,836,738 1,879,276
These resources, which are allocated to management costs, account for 5.3% and 5.2% of the Regular Fund in the years 2012 and 2013, respectively. (See Table 6).
Chapter III: General Costs and Provisions
General Costs and Provisions are general commitments not directly related to the preceding chapters or to a specific Unit. They include funding for the Governing Bodies; institutional insurance; contribution to the OAS Administrative Tribunal and the OAS Retirement and Pension Fund; External Audit; pensions of former Directors General; and the Emergency Assistance Fund for IICA Personnel.
The resources for this chapter are:
Chapter III: General Costs and Provisions (US$)
Source 2011 2012 2013
Quotas 1,274,952 1,224,681 1,224,681
Miscellaneous 50,000 20,000 20,000
Total 1,324,952 1,244,681 1,244,681
These resources, which are used to cover general costs and provisions, account for 3.6% of the Regular Fund in 2012 and 3.5% in 2013. For 2011, the figure is 4% (see Table 6).
Chapter IV: Renewal of Infrastructure and Equipment
The budget items included in this chapter are improvements to IICA-owned properties and buildings and the purchase of vehicles, equipment and computer licenses.
Chapter IV: Renewal of Infrastructure and Equipment (US$)
Source 2011 2012 2013
Quotas 395,857 400,373 400,373
Miscellaneous 303,657 210,271 210,271
Total 699,514 610,644 610,644
These resources, which are used to renew infrastructure and equipment, decrease from 2.1% of the Regular Fund in 2011 to 1.8% in 2012 and 1.7% in 2013. This is the chapter on which the budgetary situation has the greatest negative impact (see Table 6).
Personnel and Operating Costs for 2012-2013 financed with resources from the Regular Fund for the work scenario under which technical cooperation services would be maintained at current levels
Table 7 shows: i) allocations by groups of objects of expenditure
(International Professional Personnel, Local Professional Personnel, General Services Personnel and Operating Costs); the number of personnel positions, by category and classification; and, iii) the sources of financing. The personnel and operating resources included are the minimum required to continue providing technical cooperation services at current levels in accordance with the Medium Term Plan.
VI. Allocation of Regular Fund Resources by
Technical Concentration Program
(assuming 4.7%
inflation)
As noted in Section II of this document, the Institute’s technical cooperation actions focus on four technical concentration programs, namely:
• Innovation for productivity and competitiveness • Agricultural health and food safety
• Agribusiness and commercialization • Agriculture, territories and rural well-being
For the 2012-213 biennium, the Regular Fund resources corresponding to Chapter I: Direct Technical Cooperation Services are allocated to technical projects and actions in one or more of the Technical Concentration Programs.
In 2012, 29.9% and 29.6% in 2013, for actions related to the Innovation for Productivity and Competitiveness Program. For actions of the Agricultural Health and Food Safety Program, 24.9%
in 2012 and 25.4% in 2013. In the case of the Agribusiness and Commercialization Program the percentages are 24.6% and 24.5 % for 2012 and 2013, respectively. Finally, 20.6% of the cooperation resources for 2012 and 20.5% in 2013 are directed at the Agriculture, Territories and Well-being Program.
VII. Allocation of Regular Fund Resources by
Major Object of Expenditure
(assuming 4.7%
inflation)
The distribution of the Regular Fund for the 2012-2013 biennium by Major Object of Expenditure (MOE) is presented below. In addition, the distribution approved in the 2011 Program Budget is shown for the purposes of comparison.
US$ x 000 % US$ x 000 % US$ x 000 %
1 International Professional Personnel 11,710.0 35.1% 12,225.2 35.3% 12,429.7 34.5% 2 Local Professional and General Services Personnel 9,738.4 29.2% 11,155.3 32.2% 11,687.9 32.4%
21,448.4 64.2% 23,380.5 67.4% 24,117.5 66.9%
3 Training and Technical Events 1,349.0 4.0% 1,332.0 3.8% 1,332.0 3.7% 4 Official Travel 1,693.3 5.1% 1,374.1 4.0% 1,374.1 3.8% 5 Documents and Materials and Supplies 1,074.7 3.2% 914.7 2.6% 914.7 2.5% 6 Plant, Equipment and Furniture 699.5 2.1% 610.6 1.8% 610.6 1.7% 7 General Services 2,833.3 8.5% 2,774.5 8.0% 2,774.5 7.7% 8 Performance Contracts and Transfers* 3,464.7 10.4% 3,472.6 10.0% 4,078.9 11.3%
9 Other Costs 835.3 2.5% 822.3 2.4% 822.3 2.3%
11,949.8 35.8% 11,300.8 32.6% 11,907.1 33.1% 33,398.2 100.0% 34,681.3 100.0% 36,024.6 100.0% SUBTOTAL PERSONNEL COSTS
SUBTOTAL OPERATING COSTS GRAND TOTAL
Major Objet of Expenditure 2011 2012 2013
*/ Includes transfer of US$1,000,000 to CATIE.
The relative weight of personnel costs in the budget will increase from 64.2% in 2011 to 67.4% in 2012 and 66.9% in 2013.
Table 8 gives a breakdown for each major object of expenditure, (the
items of which they are composed, in monetary and percentage terms), making it easier to understand the purposes of each one.
Table 9 shows the absolute and percentage variations in each of the
Major Objects of Expenditure in the period 2011-2013, under the work scenario indicated for the previous Table.
As can be seen, the amount budgeted for international personnel (major object of expenditure 1) increases by an average of 2% per year due to a partial adjustment for inflation in 2012 of 3% and the effect of post adjustments in 2011, 2012 and 2013. A number of variables affect this item, including local inflation and the effect of exchange rate movements. An increase of 4.4% is shown for 2012 due to the combined effect of years 2011 and 2012.
In the case of local personnel (major object of expenditure 2), it is estimated that costs will rise by an average of 7% in 2011 and 2012 and by 4.8% in 2013, due to the salary increases required by law, the need to be competitive in national labor markets and to reduce staff turnover (11% in 2010), and to the negative effects of exchange rate
movements, due to the revaluation of some local currencies. An increase of 14.5% is shown for 2012, due to the combined effect of years 2011 and 2012.
Table 10 shows staff positions financed with resources from the
Regular Fund between 1992 and 2013. The Institute plans to finance 93 international professionals, 154 local professionals and 210 general services positions during the 2012-2013 biennium. All of this falls under the work scenario that would maintain IICA’s technical capabilities at current levels.
With respect to operating costs (major objects of expenditure 3 to 9) these would be 5.4% lower in 2012 than in 2011, and would increase by the same percentage in 2013 to maintain the 2011 level in real terms. The items that would suffer the largest cuts in 2012 are: “Official Travel” 18.9%); “Publications and Supplies and Inputs (-14.9%); and, purchase of “Plant, Equipment and Furniture” (-12.7%).
LIST OF TABLES
Table No. 1 Overall Budget. Maintaining Current Levels of Operation with Budget Adjustments. 2011 and 2012-2013 Program Budgets.
In thousands of US dollars.
Table No. 2 Quota Scale of the Member States and Miscellaneous Income for 2012 and 2013 Based on the OAS Quota Scale for 2012
(US$)
Table No. 3 Budget of the Regular Fund Budget. Maintaining Current Levels of Operation with Budget Adjustments. 2011 and
2012-2013. In thousands of US dollars.
Table No. 4 Budget of the Regular Fund by Programming Center. Maintaining Current Levels of Operation with Budget Adjustments.
2012-2013 - US$
Table No. 5 Evolution of the Regular Fund in Nominal Values. Maintaining Current Levels of Operation with Budget Adjustments.
1994-2011 and 2012-2013. In thousands of US dollars.
Table No. 6 Allocation of the Regular Fund by Chapter. Maintaining Current Levels of Operation with Budget Adjustments. US$
Table No. 7 Overall Allocation of the Regular Fund: Quotas and Miscellaneous Income. Maintaining Current Levels of Operation with
Budget Adjustments. In US dollars and Number of Staff Positions.
Table No. 8 Structure of the Major Objects of Expenditure - Regular Fund. Maintaining Current Levels of Operation with Budget
Adjustments. In thousands of US dollars and %
Table No. 9 Relative Weight and Evolution of MOEs - Regular Fund. Maintaining the Current Level of Operation with Budget
Adjustments. 2011 and 2012-2013 Program Budgets. In thousands of US dollars and %
Table No. 10 Personnel Positions Financed with the Regular Fund. Maintaining the Current Level of Operation with Budget Adjustments.
Table No. 1
2012 - 2013
Program Budget
2011 2012 2013
REGULAR FUND:
QUOTAS OF MEMBER STATES 27,298.2 28,581.3 29,924.6 MISCELLANEOUS INCOME 6,100.0 6,100.0 6,100.0 TOTAL REGULAR FUND 33,398.2 34,681.3 36,024.6 EXTERNAL RESOURCES FOR PROGRAMS AND PROJECTS* 154,582.0 158,451.6 141,274.6 INSTITUTIONAL NET RATE 10,097.3 10,228.4 9,628.9
198,077.5
203,361.3 186,928.1 TOTAL
*/ Estimates. Final figures will depend on the agreements signed.
(assuming 4.17% inflation)
Overall Budget
Maintaining Current Level of Operation with Budget Adjustments
2011 and 2012 - 2013 Program Budget
(US$ x 000)
Table No.2
2012 OAS
% US$ % % US$3 % US$3
Antigua and Barbuda 0.022 6,052 0.022 0.022 6,329 0.022 6,627 277 4.6% 297 4.7%
Argentina 3.211 883,304 2.408 2.408 692,231 2.408 724,766 (191,072) -21.6% 32,535 4.7% Bahamas 0.077 21,182 0.062 0.062 17,825 0.062 18,663 (3,357) -15.8% 838 4.7% Barbados 0.060 16,505 0.045 0.045 12,933 0.045 13,540 (3,573) -21.6% 608 4.7% Belize 0.022 6,052 0.022 0.022 6,329 0.022 6,627 277 4.6% 297 4.7% Bolivia 0.046 12,654 0.049 0.049 14,096 0.049 14,758 1,442 11.4% 663 4.7% Brazil 7.953 2,187,765 9.941 9.941 2,857,674 9.941 2,991,984 669,908 30.6% 134,311 4.7% Canada 13.761 3,785,469 11.972 11.972 3,441,518 11.972 3,603,270 (343,951) -9.1% 161,751 4.7% Chile 1.073 295,168 1.189 1.189 341,788 1.189 357,852 46,620 15.8% 16,064 4.7% Colombia 0.839 230,798 1.049 1.049 301,553 1.049 315,726 70,755 30.7% 14,173 4.7% Costa Rica 0.187 51,441 0.221 0.221 63,534 0.221 66,520 12,092 23.5% 2,986 4.7% Dominica 0.022 6,052 0.022 0.022 6,329 0.022 6,627 277 4.6% 297 4.7% Dominican Republic 0.206 56,668 0.257 0.257 73,866 0.257 77,338 17,198 30.3% 3,472 4.7% Ecuador 0.207 56,943 0.258 0.258 74,174 0.258 77,660 17,231 30.3% 3,486 4.7% El Salvador 0.105 28,884 0.114 0.114 32,776 0.114 34,317 3,892 13.5% 1,540 4.7% Grenada 0.022 6,052 0.022 0.022 6,329 0.022 6,627 277 4.6% 297 4.7% Guatemala 0.187 51,441 0.168 0.168 48,309 0.168 50,579 (3,132) -6.1% 2,271 4.7% Guyana 0.022 6,052 0.022 0.022 6,329 0.022 6,627 277 4.6% 297 4.7% Haiti 0.045 12,379 0.034 0.034 9,785 0.034 10,245 (2,594) -21.0% 460 4.7% Honduras 0.045 12,379 0.051 0.051 14,677 0.051 15,367 2,298 18.6% 690 4.7% Jamaica 0.123 33,836 0.093 0.093 26,720 0.093 27,976 (7,115) -21.0% 1,256 4.7% Mexico 8.141 2,239,482 8.281 8.281 2,380,505 8.281 2,492,389 141,024 6.3% 111,884 4.7% Nicaragua 0.045 12,379 0.034 0.034 9,785 0.034 10,245 (2,594) -21.0% 460 4.7% Panama 0.163 44,839 0.158 0.158 45,435 0.158 47,570 596 1.3% 2,135 4.7% Paraguay 0.124 34,111 0.093 0.093 26,720 0.093 27,976 (7,390) -21.7% 1,256 4.7% Peru 0.553 152,123 0.688 0.688 197,785 0.688 207,081 45,662 30.0% 9,296 4.7%
Saint Kitts and Nevis 0.022 6,052 0.022 0.022 6,329 0.022 6,627 277 4.6% 297 4.7%
Saint Lucia 0.022 6,052 0.022 0.022 6,329 0.022 6,627 277 4.6% 297 4.7%
Saint Vincent and the Grenadines 0.022 6,052 0.022 0.022 6,329 0.022 6,627 277 4.6% 297 4.7%
Suriname 0.045 12,379 0.034 0.034 9,785 0.034 10,245 (2,594) -21.0% 460 4.7%
Trinidad and Tobago 0.152 41,813 0.180 0.180 51,730 0.180 54,161 9,917 23.7% 2,431 4.7%
United States of America 59.470 16,359,412 59.470 59.470 17,095,544 59.470 17,899,035 736,132 4.5% 803,491 4.7%
Uruguay 0.181 49,791 0.214 0.214 61,515 0.214 64,406 11,724 23.5% 2,891 4.7% Venezuela 2.060 566,679 2.186 2.186 628,390 2.186 657,924 61,711 10.9% 29,534 4.7% SUB TOTAL 99.235 27,298,239 99.425 99.425 28,581,288 99.425 29,924,608 1,283,049 4.7% 1,343,321 4.7% Cuba 0.765 210,441 0.575 0.575 165,283 0.575 173,051 (45,158) -21.5% (37,390) 4.7% TOTAL QUOTAS 100.000 27,508,680 100.000 100.000 28,746,571 100.000 30,097,659 1,237,891 4.5% 2,588,979 4.7% MISCELLANEOUS INCOME 2 6,100,000 6,100,000 6,100,000 0 0.0% 0 0.0%
TOTAL REGULAR FUND 4 33,398,239 34,681,288 36,024,608 1,237,891 3.8% 2,626,370 3.9%
Note: The percentage for Cuba is not taken into consideration when calculating the Member State quotas. 1/ As per Resolution AG/RES. 2696 (XLI-O/11), of the OAS General Assembly of June 7th, 2011.
2/ In 2010 and 2011 miscellaneous income will comprise US$3,500,000 to be generated and US2,600,000 from the Miscellaneous Income Fund. 3/ Rounded off to the nearest one hundred.
4/ The total of the Regular Fund does not include Cuba.
2012 -2013 Program Budget
Quota Scale of the Member States and Miscellaneous Income for 2012 and 2013 Based on the OAS Quota Scale for 20121 (US$)
Maintaining Current Level of Operation with Budget Adjustments (assuming 4.17% inflation)
MEMBER STATES 2011 2012 2013 2012-2011 VARIATIONS US$ 2012 QUOTAS VARIATION % 2013 QUOTAS VARIATION %
IICA IICA IICA 2013-2012
Table No. 3
2012 - 2013
Program Budget
APPROVED
2011 2012 2013 US$ % US$ %
REGULAR FUND:
QUOTAS OF MEMBER STATES 27,298.2 28,581.3 29,924.6 1,283.1 4.7% 1,343.3 4.7% MISCELLANEOUS INCOME 6,100.0 6,100.0 6,100.0 0.0 0.0% 0.0 0.0% TOTAL REGULAR FUND 33,398.2 34,681.3 36,024.6 1,283.1 3.8% 1,343.3 3.9%
PROPOSED 2012 - 2011 2013 - 2012 RESOURCES BY SOURCE
(assuming 4.17% inflation)
BUDGET VARIATIONS
Budget of the Regular Fund
Maintaining Current Level of Operation with Budget Adjustments
2011 and 2012 - 2013 Program Budget
PP-C-04 Table No. 4: Page 1 of 2
Table No. 4
Program Budget
IPP No. IPP US$
LPP No. LPP US$ GSP No. GSP US$ Total Personnel No. Total Personnel US$ Operating Cost TOTAL REGULAR FUND IPP No. IPP US$
LPP No. LPP US$ GSP No. GSP US$ Total Personnel No. Total Personnel US$ Operating Cost TOTAL REGULAR FUND I TECHNICAL COOPERATION 85 10,753,370 149 7,130,634 195 3,526,327 429 21,410,331 9,753,902 31,164,233 85 10,938,728 149 7,489,184 195 3,676,937 429 22,104,849 10,338,861 32,443,710
A. Office of the Director of Technical Cooperation 1 145,824 1 87,763 1 20,831 3 254,419 80,000 334,419 1 148,106 1 92,073 1 21,853 3 262,031 80,000 342,031
Office of the Director of Technical Cooperation 1 145,824 1 87,763 1 20,831 3 254,419 80,000 334,419 1 148,106 1 92,073 1 21,853 3 262,031 80,000 342,031
B. TECHNICAL CONCENTRATION PROGRAMS 33 4,072,556 17 715,080 10 224,003 60 5,011,639 1,213,200 6,224,839 33 4,143,172 17 749,261 10 229,655 60 5,122,088 1,213,200 6,335,288 1. Innovation for Productivity and Competitiveness Program 14 1,755,374 9 318,070 4 81,880 27 2,155,324 516,200 2,671,524 14 1,785,847 9 332,766 4 84,708 27 2,203,321 516,200 2,719,521
Program Management 1 141,833 - - 1 23,426 2 165,259 16,500 181,759 1 144,067 - - 1 24,575 2 168,642 16,500 185,142 Hemispheric Projects 8 1,000,044 8 299,608 2 35,078 18 1,334,730 262,700 1,597,430 8 1,017,223 8 314,304 2 36,757 18 1,368,283 262,700 1,630,983 Regional Projects: 5 613,497 1 18,462 1 23,376 7 655,335 237,000 892,335 5 624,558 1 18,462 1 23,376 7 666,396 237,000 903,396
Regional Cooperative Program for the Protection and Modernization of Coffee Cultivation in Central America, Panama and the Dominican Republic - PROMECAFE
1
105,405 - - - - 1 105,405 - 105,405 1 107,539 - - - - 1 107,539 - 107,539 Support to Caribbean Agricultural Research and Development
Institute - CARDI - - - - - - - - 200,000 200,000 - - - - - - - - 200,000 200,000 Cooperative Agricultural Research and Technology Transfer
Program for the Andean Subregion - PROCIANDINO 1 123,613 - - - - 1 123,613 - 123,613 1 125,738 - - - - 1 125,738 - 125,738 Cooperative Program for the Development of Agricultural
Technology in the Southern Cone - PROCISUR 1 126,213 1 18,462 1 23,376 3 168,051 5,000 173,051 1 128,591 1 18,462 1 23,376 3 170,429 5,000 175,429 Cooperative Program on Research and Technology Transfer for
the South American Tropics - PROCITROPICOS 1 136,249 - - - - 1 136,249 - 136,249 1 138,676 - - - - 1 138,676 - 138,676 Cooperative Program in Research and Technology for the
Northern Region - PROCINORTE 1 122,017 - - - - 1 122,017 27,000 149,017 1 124,012 - - - - 1 124,012 27,000 151,012 Support to the System for the Central America Agricultural
Technology Integration System - SICTA - - - - - - - - 5,000 5,000 - - - - - - - - 5,000 5,000
2. Agricultural Health and Food Safety and Quality Program 6 730,026 4 199,507 2 31,057 12 960,590 284,000 1,244,590 6 743,655 4 209,301 2 32,578 12 985,535 284,000 1,269,535
Program Management 1 138,083 - - 1 18,526 2 156,609 75,500 232,109 1 140,336 - - 1 19,434 2 159,770 75,500 235,270 Hemispheric Projects 5 591,942 4 199,507 1 12,531 10 803,981 128,500 932,481 5 603,319 4 209,301 1 13,145 10 825,765 128,500 954,265 Regional Projects - - - - - - - - 80,000 80,000 - - - - - - - - 80,000 80,000
Support to the Development and Strengthening of National Agricultural Health Systems in the Countries of the Southern Cone to Facilitate International Agricultural Trade - COSAVE
- - - - - - - 20,000 20,000 - - - - - - - - 20,000 20,000 Support to the Permanent Veterinary Committee of the Southern
Cone - CVP - - - - - - - - 60,000 60,000 - - - - - - - - 60,000 60,000
3. Agribusiness and Commercialization Program 9 1,094,831 2 104,861 3 96,975 14 1,296,667 320,000 1,616,667 9 1,113,156 2 110,005 3 97,588 14 1,320,749 320,000 1,640,749
Program Management 1 143,568 - - 2 84,444 3 228,017 182,000 410,017 1 145,737 - - 2 84,444 3 230,185 182,000 412,185 Hemispheric Projects 8 951,263 2 104,861 1 12,531 11 1,068,650 138,000 1,206,650 8 967,419 2 110,005 1 13,145 11 1,090,564 138,000 1,228,564
4. Agriculture, Territories and Rural Well-being Program 4 492,326 2 92,641 1 14,091 7 599,058 93,000 692,058 4 500,514 2 97,189 1 14,781 7 612,483 93,000 705,483
Program Management 1 141,683 - - 1 14,091 2 155,774 7,500 163,274 1 143,917 - - 1 14,781 2 158,698 7,500 166,198 Hemispheric Projects 3 350,642 2 92,641 - - 5 443,284 85,500 528,784 3 356,597 2 97,189 - - 5 453,786 85,500 539,286
C. PROGRAMS FOR CROSS-COORDINATION 2 288,039 3 127,880 2 32,242 7 448,162 67,000 515,162 2 292,743 3 131,483 2 33,082 7 457,308 67,000 524,308 1. Agriculture and Food Security 1 149,956 1 31,288 1 15,111 3 196,355 30,000 226,355 1 152,407 1 31,288 1 15,111 3 198,806 30,000 228,806
2. Agriculture, Natural Resource Management and Climate Change 1 138,083 2 96,592 1 17,132 4 251,807 37,000 288,807 1 140,336 2 100,195 1 17,971 4 258,502 37,000 295,502
D. 4 502,511 5 295,654 1 14,651 10 812,816 160,000 972,816 4 511,488 5 309,776 1 15,369 10 836,633 160,000 996,633
Hemispheric Projects 4 502,511 5 295,654 1 14,651 10 812,816 100,000 912,816 4 511,488 5 309,776 1 15,369 10 836,633 100,000 936,633 Regional Projects - - - - - - - - 60,000 60,000 - - - - - - - - 60,000 60,000
Support for the Agricultural Policy Coordination Network of the South - REDPA and Support for the Informal Group of the Agricultural Negotiators - GINA SUR
- - - - - - - 60,000 60,000 - - - - - - - - 60,000 60,000
E. TECHNICAL COOPERATION SUPPORT UNITS 6 721,015 13 558,197 5 96,032 24 1,375,244 205,000 1,580,244 6 734,005 13 585,588 5 100,735 24 1,420,327 205,000 1,625,327 1. Promotion and Formulation of Projects 6 721,015 - - - - 6 721,015 50,000 771,015 6 734,005 - - - - 6 734,005 50,000 784,005 Hemispheric Component 2 244,264 - - - - 2 244,264 10,000 254,264 2 248,508 - - - - 2 248,508 10,000 258,508 Regional Component 4 476,750 - - - - 4 476,750 40,000 516,750 4 485,497 - - - - 4 485,497 40,000 525,497
2. Hemispheric Center for Leadership in Agriculture (includes
professionals enrichment program) - - 2 94,461 1 14,091 3 108,552 20,000 128,552 - - 2 99,098 1 14,781 3 113,879 20,000 133,879
3. Inter-American Center for Information and Editorial Production - - 7 278,475 2 39,301 9 317,777 40,000 357,777 - - 7 292,138 2 41,228 9 333,366 40,000 373,366
4. Information and Communication Technologies - - 1 69,064 1 20,113 2 89,177 70,000 159,177 - - 1 72,456 1 21,095 2 93,550 70,000 163,550
5. Center for Communication and Distance Learning - CECADI - - 3 116,197 1 22,527 4 138,724 25,000 163,724 - - 3 121,895 1 23,632 4 145,527 25,000 170,527
CENTER FOR STRATEGIC ANALYSIS FOR AGRICULTURE
2012 -2013 Budget of the Regular Fund by Programming Center
Maintaining Current Level of Operation with Budget Adjustments 2012 - 2013 - US$
PROGRAMMING CENTERS
2012 PROGRAM BUDGET 2013 PROGRAM BUDGET
REGULAR FUND REGULAR FUND
F. 30 3,879,463 102 4,942,127 167 2,937,175 299 11,758,764 5,218,213 16,976,977 30 3,946,233 102 5,200,185 167 3,065,322 299 12,211,740 5,218,213 17,429,953 1. Belize 1 129,888 2 81,566 2 36,149 5 247,602 64,157 311,759 1 131,701 2 85,594 2 37,907 5 255,202 64,157 319,359 2. Costa Rica 1 130,699 4 164,608 5 80,485 10 375,792 79,633 455,425 1 132,842 4 172,687 5 84,427 10 389,957 79,633 469,590 3. Guatemala 1 127,779 2 123,231 4 51,055 7 302,065 133,790 435,855 1 129,940 2 131,623 4 54,218 7 315,781 133,790 449,571 4. Honduras 1 122,774 3 131,741 5 38,792 9 293,307 122,200 415,507 1 124,716 3 136,194 5 40,096 9 301,007 122,200 423,207 5. Nicaragua 1 129,446 3 73,725 3 25,533 7 228,704 185,981 414,685 1 131,428 3 73,254 3 25,371 7 230,053 185,981 416,034 6. Panama 1 131,464 3 135,619 4 70,618 8 337,701 84,397 422,098 1 133,661 3 142,302 4 74,095 8 350,058 84,397 434,455 7. El Salvador 1 129,904 3 119,849 7 85,755 11 335,508 56,595 392,103 1 131,923 3 124,301 7 88,707 11 344,931 56,595 401,526 8. Barbados 1 122,171 2 77,536 5 115,532 8 315,238 103,814 419,052 1 124,160 2 81,328 5 121,144 8 326,632 103,814 430,446 9. ECS 1 120,062 6 344,119 10 252,877 17 717,058 163,973 881,031 1 121,928 6 352,720 10 258,675 17 733,322 163,973 897,295 10.Guyana 1 116,788 2 63,897 9 71,772 12 252,457 123,919 376,376 1 118,494 2 68,472 9 76,608 12 263,574 123,919 387,493 11.Haiti 1 132,361 2 78,938 9 117,003 12 328,301 167,196 495,497 1 134,578 2 79,432 9 117,710 12 331,720 167,196 498,916 12.Jamaica 1 127,852 2 95,798 5 94,824 8 318,473 152,158 470,631 1 129,780 2 104,022 5 102,638 8 336,439 152,158 488,597 13.Bahamas 1 121,800 1 35,052 2 48,605 4 205,457 61,730 267,187 1 124,008 1 35,400 2 49,085 4 208,493 61,730 270,223 14.Dominican Republic 1 116,899 5 173,567 8 98,062 14 388,528 154,806 543,334 1 118,951 5 179,904 8 101,585 14 400,440 154,806 555,246 15.Suriname 1 120,272 2 48,217 4 39,197 7 207,686 129,965 337,651 1 122,208 2 50,972 4 41,328 7 214,508 129,965 344,473
16.Trinidad and Tobago 1 131,331 3 167,264 6 175,070 10 473,665 97,457 571,122 1 133,768 3 180,220 6 188,075 10 502,063 97,457 599,520
17.Bolivia 1 114,336 5 207,892 10 142,580 16 464,808 46,956 511,764 1 116,500 5 223,884 10 153,331 16 493,715 46,956 540,671 18.Colombia 1 152,950 6 333,879 13 235,236 20 722,066 402,263 1,124,329 1 155,905 6 323,718 13 228,692 20 708,314 402,263 1,110,577 19.Ecuador 1 128,535 5 192,181 10 149,510 16 470,226 169,091 639,317 1 130,559 5 201,168 10 156,164 16 487,891 169,091 656,982 20.Peru 1 136,563 4 167,303 7 99,822 12 403,689 155,218 558,907 1 138,912 4 168,520 7 100,543 12 407,975 155,218 563,193 21.Venezuela 1 147,044 4 195,606 7 112,370 12 455,020 125,774 580,794 1 150,481 4 239,027 7 135,705 12 525,213 125,774 650,987 22.Argentina 1 127,862 7 386,873 7 157,037 15 671,772 205,311 877,083 1 130,000 7 451,280 7 183,138 15 764,418 205,311 969,729 23.Brazil 1 154,606 11 791,608 1 35,859 13 982,074 961,203 1,943,277 1 157,891 11 831,094 1 37,633 13 1,026,618 961,203 1,987,821 24.Chile 1 133,502 4 178,032 5 91,292 10 402,826 116,850 519,676 1 136,071 4 183,265 5 93,648 10 412,984 116,850 529,834 25.Paraguay 1 120,141 4 140,085 5 62,329 10 322,554 107,407 429,961 1 122,130 4 143,722 5 63,943 10 329,795 107,407 437,202 26.Uruguay 1 134,782 2 119,381 4 97,404 7 351,567 123,453 475,020 1 137,231 2 119,381 4 97,404 7 354,016 123,453 477,469 27.Canada 1 129,677 - - 2 82,888 3 212,565 351,064 563,629 1 132,108 - - 2 82,888 3 214,996 351,064 566,060
28.United States of America 2 261,016 1 91,820 3 160,306 6 513,143 288,948 802,091 2 265,237 1 91,820 3 160,306 6 517,363 288,948 806,311
29.Mexico 1 126,961 4 222,740 5 109,213 10 458,914 282,904 741,818 1 129,122 4 224,879 5 110,261 10 464,263 282,904 747,167
G SUPPORT FOR INTEGRATION PROJECTS 2 218,452 - - 2 39,210 4 257,662 180,000 437,662 2 222,175 - - 2 40,790 4 262,965 180,000 442,965 1. Support to Central American Agricultural Council - CAC 1 102,327 - - 1 25,414 2 127,742 - 127,742 1 104,334 - - 1 26,657 2 130,990 - 130,990
2. Support to Alliance for Sustainable Development in the Caribbean - - - - - - - - 100,000 100,000 - - - - - - - - 100,000 100,000
3. Support to CARICOM 1 116,125 - - - - 1 116,125 25,000 141,125 1 117,842 - - - - 1 117,842 25,000 142,842
4. Support to the Secretariat of the Agricultural Council of the South - CAS - - - - 1 13,796 1 13,796 30,000 43,796 - - - - 1 14,133 1 14,133 30,000 44,133
5. Support to the Tri-National Council of the Northern Region - - - - - - - - 25,000 25,000 - - - - - - - - 25,000 25,000
H.TECHNICAL SUPPORT UNITS AND ACTIONS 7 925,510 8 403,933 7 162,181 22 1,491,624 197,000 1,688,624 7 940,805 8 420,818 7 170,134 22 1,531,757 197,000 1,728,757 1. Directorate of Management and Regional Integration 2 273,349 2 114,570 3 72,487 7 460,406 65,000 525,406 2 277,836 2 117,250 3 76,042 7 471,128 65,000 536,128
2. Secretariat of Planning and Evaluation 1 143,320 3 141,809 1 20,033 5 305,163 35,000 340,163 1 145,602 3 148,771 1 21,015 5 315,387 35,000 350,387
3. Secretariat of External Relations 4 508,841 3 147,553 3 69,662 10 726,056 47,000 773,056 4 517,368 3 154,797 3 73,077 10 745,242 47,000 792,242
4. Strenghtening of Technical Capabilities - - - - - - - - 50,000 50,000 - - - - - - - - 50,000 50,000
I. LINE/ITEM FOR TECHNICAL COOPERATION PROJECTS - - - - - - - - 1,433,489 1,433,489 - - - - - - - - 2,018,448 2,018,448
Line/Item for Technical Cooperation Projects - - - - - - - - 1,433,489 1,433,489 - - - - - - - - 2,018,448 2,018,448
- - - - - - - - - - - - - - - - - - -J.CONTRIBUTION TO CATIE - - - - - - - - 1,000,000 1,000,000 - - - - - - - - 1,000,000 1,000,000
Contribution to CATIE - - - - - - - - 1,000,000 1,000,000 - - - - - - - - 1,000,000 1,000,000
II. MANAGEMENT UNITS 8 1,159,191 5 232,328 15 245,975 28 1,637,493 208,805 1,846,298 8 1,178,294 5 243,725 15 258,013 28 1,680,031 208,805 1,888,836 A.Office of the Director General (Chapter II) 4 612,678 - - 1 33,322 5 646,000 77,467 723,467 4 622,858 - - 1 34,957 5 657,815 77,467 735,282
B.Secretariat of Corporate Services (Chapter II) 4 546,512 5 232,328 14 212,653 23 991,493 131,338 1,122,831 4 555,435 5 243,725 14 223,056 23 1,022,216 131,338 1,153,554
III. CORPORATE ACTIVITIES - 312,650 - 10,000 - 10,000 - 332,650 1,338,107 1,670,757 - 312,650 - 10,000 - 10,000 - 332,650 1,359,411 1,692,061 1. Stabilization for loss of purchasing of US$, Funding Cycles for Projects and Preinvestment - - - - - - - - 426,076 426,076 - - - - - - - - 447,380 447,380
2. Governing Bodies - - - - - - - - 400,000 400,000 - - - - - - - - 400,000 400,000
3. Insurance - - - - - - - - 391,531 391,531 - - - - - - - - 391,531 391,531
4. Pensions Former Directors - 287,650 - - - - - 287,650 - 287,650 - 287,650 - - - - - 287,650 - 287,650
5. Contribution to the Administration of the Retirement and Pension Fund - 25,000 - - - - - 25,000 - 25,000 - 25,000 - - - - - 25,000 - 25,000
6. Contribution to the OAS Administrative Tribunal - - - - - - - - 25,000 25,000 - - - - - - - - 25,000 25,000
7. External Audit - - - - - - - - 95,500 95,500 - - - - - - - - 95,500 95,500
8. Emergency Assistance Program for Staff - - - 10,000 - 10,000 - 20,000 - 20,000 - - - 10,000 - 10,000 - 20,000 - 20,000
93
12,225,211 154 7,372,962 210 3,782,301 457 23,380,474 11,300,814 34,681,288 93 12,429,672 154 7,742,909 210 3,944,950 457 24,117,531 11,907,077 36,024,608 NATIONAL COMPONENT OF TECHNICAL COOPERATION: OFFICES
IN THE MEMBER STATES
PP-C-05 Table No. 5: Page 1 of 1 1994-2011 and 2012-2013 (US$ x 000) 1994 26,707.5 2,297.3 29,004.8 1995 27,508.7 2,127.5 29,636.2 1996 27,508.7 2,527.2 30,035.9 1997 27,508.7 3,258.1 30,766.8 1998 27,508.7 2,491.3 30,000.0 1999 27,508.7 2,491.3 30,000.0 2000 27,508.7 2,491.3 30,000.0 2001 27,508.7 2,491.3 30,000.0 2002 27,508.7 2,491.3 30,000.0 2003 27,167.6 2,832.4 30,000.0 2004 27,167.6 2,832.4 30,000.0 2005 27,167.6 2,832.4 30,000.0 2006 27,167.6 2,832.4 30,000.0 2007 27,167.6 2,832.4 30,000.0 2008 27,227.8 4,100.0 31,327.8 2009 27,227.8 4,100.0 31,327.8 2010 27,298.2 6,100.0 33,398.2 2011 27,298.2 6,100.0 33,398.2 2012 28,581.3 6,100.0 34,681.3 2013 29,924.6 6,100.0 36,024.6
Note: The Cuban quota was excluded from the quota resources as of 2003.
Table No. 5 2012-2013
Program Budget
Evolution of the Regular Fund in Nominal Values
Maintaining Current Level of Operation with Budget Adjustments
PERIOD QUOTAS MISCELLANEOUS REGULAR FUND
Table No. 6
US$ US$ US$
CHAPTER I: Direct Technical Cooperation Services 23,996,054 5,668,560 29,664,614 88.8% 25,187,233 5,801,991 30,989,225 89.4% 26,488,016 5,801,991 32,290,006 89.6%
Innovation for Productivity and Competitiveness Program 7,435,100 1,297,230 8,732,330 29.4% 7,984,051 1,285,669 9,269,720 29.9% 8,284,704 1,284,097 9,568,802 29.6% Agricultural Health and Food Safety and Quality Program 5,576,751 1,545,247 7,121,998 24.0% 6,057,104 1,670,751 7,727,855 24.9% 6,534,449 1,655,996 8,190,444 25.4% Agribusiness and Commercialization Program 5,457,230 1,595,900 7,053,130 23.8% 5,987,222 1,633,341 7,620,563 24.6% 6,267,049 1,645,442 7,912,491 24.5% Agriculture, Territories and Rural Well-being Program 5,526,973 1,230,183 6,757,156 22.8% 5,158,857 1,212,231 6,371,087 20.6% 5,401,813 1,216,456 6,618,269 20.5% CHAPTER II: Management Costs 1,631,376 77,783 1,709,159 5.1% 1,769,000 67,738 1,836,738 5.3% 1,811,538 67,738 1,879,276 5.2% Office of the Director General 662,870 20,000 682,870 40.0% 702,407 17,500 719,907 39.2% 714,222 17,500 731,722 38.9% Secretariat of Corporate Services 968,506 57,783 1,026,289 60.0% 1,066,593 50,238 1,116,831 60.8% 1,097,316 50,238 1,147,554 61.1% CHAPTER III: General Cost and Provisions 1,274,952 50,000 1,324,952 4.0% 1,224,681 20,000 1,244,681 3.6% 1,224,681 20,000 1,244,681 3.5%
Governing Bodies 400,000 0 400,000 30.2% 400,000 0 400,000 32.1% 400,000 0 400,000 32.1%
Insurance 441,802 0 441,802 33.3% 391,531 0 391,531 97.9% 391,531 0 391,531 31.5%
Pensions Former Directors 287,650 0 141,275 10.7% 287,650 0 287,650 73.5% 287,650 0 287,650 23.1%
Contribution to the OAS Administrative Tribunal 25,000 0 25,000 1.9% 25,000 0 25,000 8.7% 25,000 0 25,000 2.0%
Contribution to the Administration of the Retirement and Pension Fund 25,000 0 9,629 0.7% 25,000 0 25,000 100.0% 25,000 0 25,000 2.0%
External Audit 95,500 0 95,500 7.2% 95,500 0 95,500 382.0% 95,500 0 95,500 7.7%
Emergency Assistance Program for Staff 0 50,000 50,000 3.8% 0 20,000 20,000 20.9% 0 20,000 20,000 1.6%
CHAPTER IV: Renewal of Infrastructure and Equipment 395,857 303,657 699,514 2.1% 400,373 210,271 610,644 1.8% 400,373 210,271 610,644 1.7% TOTAL 27,298,239 6,100,000 33,398,239 100.0% 28,581,288 6,100,000 34,681,288 100.0% 29,924,608 6,100,000 36,024,608 100.0%
PP-C-06 Table No. 6: Page 1 of 1
(assuming 4.17% inflation)
QUOTAS MISC. REGULAR FUND
% % %
2011 2012 2013
QUOTAS MISC. REGULAR FUND QUOTAS MISC. REGULAR FUND
2012 - 2013 Program Budget Allocation of the Regular Fund by Chapter
Maintaining Current Level of Operation with Budget Adjustments
(US$)
Table No. 7 2012 - 2013 Program Budget
US$ % US$ % Class 2012 2013 Class 2012 2013 International Professional Personnel (IPP) 12,225,211 35.3% 12,429,672 34.5% DG 1 1 PL5 8 8
Local Professional Personnel (LPP) 7,372,962 21.3% 7,742,909 21.5% SDG 1 1 PL4 39 39
General Services Personnel (GSP) 3,782,301 10.9% 3,944,950 11.0% D2 14 14 PL3 67 67
Operating Costs (MOE 3 to 9) 11,300,814 32.6% 11,907,077 33.1% D1 3 3 PL2 31 31
Total 34,681,288 100.0% 36,024,608 100.0% P6 14 14 PL1 9 9 141274.6 P5 58 58 Total 154 154 9628.9 P4 1 1 P3 1 1 Class 2012 2013 P2 G10 P1 G9 1 1 Total 93 93 G8 10 10 G7 49 49 US$ % US$ % G6 56 56
Quota Resources 28,581,288 82.4% 29,924,608 83.1% Total 364 364 G5 25 25
Miscellaneous Resources 6,100,000 17.6% 6,100,000 16.9% G4 34 34
G3 19 19
Total 34,681,288 100.0% 36,024,608 100.0% G2 10 10
G1 6 6
Total 210 210
PP-C-07 Table No. 7: Page 1 of 1
Summary GSP
Summary by Object of Expenditure 2012 2013 Summary IPP Summary LPP
Overall Allocation of the Regular Fund: Quotas and Miscellaneous Maintaining Current Level of Operation with Budget Adjustments
(US$ and Number of Positions)
Number of Positions (assuming 4.17% inflation)
Source of Funds 2012 2013
Table 8
Program Budget
1 International Professional Personnel 12,225.2 100.0% 12,429.7 100.0%
Salaries 5,501.3 45.0% 5,593.4 45.0%
Benefits and Other Costs of International Personnel 6,723.9 55.0% 6,836.3 55.0%
2 Local Professional and General Services Personnel 11,155.3 100.0% 11,687.9 100.0%
Salaries 7,808.7 70.0% 8,181.5 70.0%
Benefits and Other Costs of National Personnel 3,346.6 30.0% 3,506.4 30.0%
3 Training and Technical Events 1,332.0 100.0% 1,332.0 100.0%
Training for Personnel 159.8 12.0% 159.8 12.0%
Technical Events 1,145.5 86.0% 1,145.5 86.0%
Didactic Material 26.6 2.0% 26.6 2.0%
4 Official Travel 1,374.1 100.0% 1,374.1 100.0%
International Per Diems 728.3 53.0% 728.3 53.0%
International Transportation 494.7 36.0% 494.7 36.0%
National Per Diems 109.9 8.0% 109.9 8.0%
National Transportation 41.2 3.0% 41.2 3.0%
5 Documents and Materials and Supplies 914.7 100.0% 914.7 100.0%
Publications and Documents 448.2 49.0% 448.2 49.0%
Office Materials and Supplies 429.9 47.0% 429.9 47.0%
Materials for IICA Projects 36.6 4.0% 36.6 4.0%
6 Plant, Equipment and Furniture 610.6 100.0% 610.6 100.0%
Improvements to Land, Buildings and Immoveable Assets 79.4 13.0% 79.4 13.0% Acquisition of Equipment and Furnishings 384.7 63.0% 384.7 63.0%
Acquisition of Vehicles 146.6 24.0% 146.6 24.0%
7 General Services 2,774.5 100.0% 2,774.5 100.0%
Communications 665.9 24.0% 665.9 24.0%
Public Services 194.2 7.0% 194.2 7.0%
Repairs and Maintenance 776.9 28.0% 776.9 28.0%
Fuel 138.7 5.0% 138.7 5.0%
Rents 860.1 31.0% 860.1 31.0%
Guard and Janitorial Contracts 138.7 5.0% 138.7 5.0%
8 Performance Contracts and Transfers 3,472.6 100.0% 4,078.9 100.0%
International Technical Consulting Services 312.5 9.0% 367.1 9.0% National Technical Consulting Services 1,389.0 40.0% 1,631.5 40.0%
Support Services 816.1 23.5% 958.5 23.5%
External Auditing 86.8 2.5% 102.0 2.5%
Transfers to Third Parties 868.1 25.0% 1,019.7 25.0%
9 Other Costs 822.3 100.0% 822.3 100.0%
Insurance 592.0 72.0% 592.0 72.0%
Official Hospitality 82.2 10.0% 82.2 10.0%
Ceremonies and Awards 24.7 3.0% 24.7 3.0%
Financial Expenses 106.9 13.0% 106.9 13.0% Others 16.4 2.0% 16.4 2.0% 34,681.3 36,024.6 TOTAL (assuming 4.17% inflation) 2012 - 2013 Structure of the Major Objects of Expenditure - Regular Fund
Maintaining Current Level of Operation with Budget Adjustments (US$ x 000 and %)