HAL Id: hal-01009950
https://hal.archives-ouvertes.fr/hal-01009950
Submitted on 18 Jun 2014HAL is a multi-disciplinary open access archive for the deposit and dissemination of sci-entific research documents, whether they are pub-lished or not. The documents may come from teaching and research institutions in France or abroad, or from public or private research centers.
L’archive ouverte pluridisciplinaire HAL, est destinée au dépôt et à la diffusion de documents scientifiques de niveau recherche, publiés ou non, émanant des établissements d’enseignement et de recherche français ou étrangers, des laboratoires publics ou privés.
Effects of Climate Variations and Global Warming on
the Durability of RC Structures Subjected to
Carbonation
Thomas de Larrard, Emilio Bastidas-Arteaga, Frederic Duprat, Franck Schoefs
To cite this version:
Thomas de Larrard, Emilio Bastidas-Arteaga, Frederic Duprat, Franck Schoefs. Effects of Cli-mate Variations and Global Warming on the Durability of RC Structures Subjected to Carbona-tion. Civil Engineering and Environmental Systems, Taylor & Francis, 2014, 31 (2), pp.153-164. �10.1080/10286608.2014.913033�. �hal-01009950�
Special Issue on Climate Change Risks to Civil Infrastructure Guest Editor: Emilio Bastidas-Arteaga
Effects of Climate Variations and Global Warming on the Durability of
RC Structures Subjected to Carbonation
Thomas de Larrard
a, Emilio Bastidas-Arteaga
b, Frédéric Duprat
a, Franck
Schoefs
ba
Université de Toulouse III, UPS-INSA, LMDC (Laboratoire Matériaux et Durabilité des Constructions), 135 avenue de Rangueil - 31077 Toulouse Cedex 4, France
b
LUNAM Université, Université de Nantes-Ecole Centrale Nantes, GeM, Institute for Research in Civil and Mechanical Engineering/Sea and Littoral Research Institute, CNRS UMR 6183/FR 3473, Nantes, France
Special Issue on Climate Change Risks to Civil Infrastructure Guest Editor: Emilio Bastidas-Arteaga
Effects of Climate Variations and Global Warming on the Durability of
RC Structures Subjected to Carbonation
Carbonation affects the performance, serviceability and safety of reinforced concrete (RC) structures when they are placed in environments with important CO2
concentrations. Since the kinetics of carbonation depends on parameters that could be affected by climate change (temperature, atmospheric CO2 pressure and relative
humidity), this study aims at quantifying the effect of climate change on the durability of RC structures subjected to carbonation risks. This work couples a carbonation finite element model with a comprehensive reliability approach to consider the uncertainties inherent to the deterioration process. The proposed methodology is applied to the probabilistic assessment of carbonation effects for several cities in France under various climate change scenarios. It was found that climate change and local relative humidity have a significant impact on corrosion initiation risks.
Keywords: carbonation; reinforced concrete; corrosion; reliability; climate change
1. Introduction
The performance, serviceability and safety of reinforced concrete (RC) structures are affected by corrosion-induced deterioration when they are placed in environments with important CO2 concentrations. Carbonation is a chemical evolution of the cementitious
materials, induced by the reactive diffusion of CO2 in the porous media. Indeed,
atmospheric CO2 reacts with cement hydrates, dissolves portlandite and forms calcite. The
main consequence of this chemical reaction is a significant decrease of pH in the porous solution that induces corrosion of the reinforcing steel. The kinetics of this degradation depends on temperature, atmospheric CO2 pressure and relative humidity (RH), all
parameters related with time and climate change.
Natural and anthropogenic actions will increase environmental CO2 concentrations
in the future and produce changes in temperature and humidity. For instance, following the current patterns, it is expected an increase of CO2 concentration from 379 ppm in 2005
over 1000 ppm by the year 2100 (IPCC, 2007). Therefore, these new environmental conditions will modify the kinematics of carbonation by increasing or reducing the consequences of corrosion-induced damage. Besides climate change, there are other
uncertainties related to the carbonation process. Consequently, probabilistic approaches are suitable tools for assessing structural risk and reliability for this problem.
Various studies have focused on the effect of climate change on the durability of corroded RC structures. Bastidas-Arteaga et al. (2010) proposed a stochastic approach to study the influence of global warming on chloride ingress for RC structures. They found that chloride ingress could induce reductions of the corrosion initiation stage varying from
2% to 18%. Concerning corrosion propagation until failure, Bastidas-Arteaga et al. (2013) found that global warming could reduce the time to failure by up to 31% for RC structures subject to chloride ingress. Recent work also focused on the assessment of climate change on the durability of concrete structures in specific locations. Stewart et al. (2011) found that the temporal and spatial effects of a changing climate can increase current predictions of carbonation-induced damage risks by more than 16% which means that one in six structures will experience additional and costly corrosion damage by 2100 in Australia and presumably elsewhere. Wang et al. (2012) studied the impact of climatic change on
corrosion-induced damage in Australia. They proposed a probabilistic approach to assess corrosion damage taking into account the influence of climate change on areas
characterised by different geographical conditions. Talukdar et al. (2012) estimated the effects of climate change on carbonation in Canadian cities (Toronto and Vancouver). They found potential increases in carbonation depths over 100 years of approximately 45%. However, this work did not consider the uncertainties related to climate, materials and models.
This study uses a probabilistic approach to compare and quantify the effect of different climate change scenarios on the structural safety of a RC structure exposed to a risk of corrosion induced by the cement paste carbonation. In comparison with previous studies, this paper integrated a relevant carbonation finite element model that takes into account all these climate evolutions (Section 3). Probabilistic assessment using this finite element model requires a significant computational effort. Therefore, Section 4 presents the adopted reliability approach that is used in this work. Finally, Section 5 presents an application to the assessment of climate change effects to RC structures placed in various cities in France.
2. Climate Change Effects
2.1. Increase of carbon dioxide emissions
Following the current patterns, studies have estimated that environmental CO2
concentration could increase from 379 ppm in 2005 over 1000 ppm by the year 2100 (IPCC, 2007). Consequently, the long-term management of RC structures should consider the effect of atmospheric CO2 concentration change and global warming. The increase of
atmospheric CO2 concentration is difficult to estimate because it depends on several
socio-technical and political factors. These factors have been considered by the
Intergovernmental Panel on Climate Change (IPCC, 2007) that defined four scenarios families of global warming (i.e., A1, A2, B1 and B2). These scenarios integrate different assumptions in terms of population growth, economical development, transfer of clean technologies, etc. The A1 scenario describes a future world of very rapid economic growth, global population that peaks in mid-century and declines thereafter, and the rapid introduction of new and more efficient technologies. This scenario family is divided into three groups distinguished by different technological emphasis: fossil-intensive (A1FI), non-fossil energy sources (A1T) or a balance across all sources (A1B). The A2 scenario describes a very heterogeneous world with continuously increasing population. The
economic development is primarily regionally oriented and technological change more fragmented and slower. The B1 scenario is similar to the A1 scenario respecting to population growth, but with rapid change in economic structures toward a service and information economy, with reductions in material intensity and the introduction of clean and resource-efficient technologies. The B2 scenario describes a world in which the emphasis is on local solutions to economic, social and environmental sustainability. The population growth pattern is similar to the scenario A2 but with a lower rate. It also
includes more diverse technological solutions. Figure 1 presents a projection from 2000 of environmental CO2 concentrations the A2, A1B, and B1 global warming scenarios. These
scenarios were selected in this study because they represent pessimistic, medium and optimistic climate change effects on climate, respectively (section 2.2). These values were computed using the MAGICC software (Model for Assessment of Greenhouse-gas
Induced Climate Change) (Wigley et al., 1996). Every scenario includes 3 versions for the CO2 emissions: a lower one, a medium one and a higher one. For this study, it has been
decided to take into account only the medium one (assessing the higher the CO2 pressure,
the faster the carbonation). Taking into account the description of the scenarios presented previously, the highest projections for CO2 concentration for 2100 correspond to the A2
scenario.
Figure 1. CO2 emissions for the studied scenarios
2.2. Effects of Climate Change on Temperature and Relative Humidity
The effect of climate change on weather will change depending on the geographical and meteorological characteristics of the studied location. The impact of climate change on the future weather of the selected locations was estimated by using data computed by the French general circulation model SCRATCH-ARPEGE-V4-RETIC (Déqué et al., 1994). This model was selected because it is able to account for climate projections at a regional scale with a 8 km grid. For instance, Figure 2 presents the yearly projections of
temperature and RH for the city of Nantes and the selected climate change scenarios. It is noted that climate change projections announce temperature increase and RH decrease for all scenarios. The most important changes in temperature and RH are related to the larger emissions scenarios described in previous section. Concerning consequences on climate
300 400 500 600 700 800 900 1000 2000 2020 2040 2060 2080 2100 Low Mid High CO 2 c onc ent ra ti on (ppm ) Year B1 A1B A2
change, it is possible to define A2 as a pessimistic scenario, A1B as a medium impact scenario, and B1 as an optimistic scenario.
Figure 2. Temperature and RH projections for Nantes
3. Carbonation Model
This section presents the model used herein for describing the coupled drying and
carbonation of concrete, which is detailed in (de Larrard et al., 2013a). This is a simplified version of the model proposed in (Bary and Sellier, 2004), that assumes that the main phenomena involved in the carbonation are the water migration through the connected porosity, and the diffusion of carbon dioxide in the gaseous phase and its subsequent interactions with the hydrated phases initially present to produce calcium carbonate (calcite). Accordingly, it is governed by two coupled mass conservation equations for water (eq. (1)) and carbon dioxide in gas phase (eq. (2)):
∂
(
ρlφSr)
∂t =∇ K( )
φ ρl η kr( )
Sr ∇( )
Pl ⎡ ⎣ ⎢ ⎤ ⎦ ⎥ + H 2O W (1) ∂ 1− S(
(
r)
φPc)
∂t =∇ f⎡⎣(
φ,Sr)
Dc∇( )
Pc ⎤⎦+WCO2 (2)Eq. (1) implicitly assumes that the main transport process for moisture results from gradients of partial pressure of water in the liquid phase P
l (permeation), i.e. the migration
of vapour in gas phase is neglected (Mainguy et al., 2001; Bary and Sellier, 2004).
Moreover, the pressure of the gas phase is neglected with respect to the liquid phase, such that P
c≈ − Pl, where Pc is the capillary pressure. Eq. (1) is also driven by Pc in the
desorption isotherm that accounts for the relationships between the saturation degree S
r and P c (van Genuchten, 1980): S r = 1+ P
(
c/ P0)
1/(1−m) ⎡ ⎣⎢ ⎤ ⎦⎥ − m (3)where �! and m are calibration parameters. Other parameters involved in eq. (1) are: � � 12 13 14 15 16 17 18 2000 2020 2040 2060 2080 2100 B1 A1B A2 T em pe ra ture (º C) Year 70 75 80 85 2000 2020 2040 2060 2080 2100 A2 A1B B1 Re la ti ve H um idi ty (%) Year
is the intrinsic permeability coefficient that depends on the initial porosity φ and the initial intrinsic permeability
K0 (van Genuchten, 1980); ρl and η are the density and dynamic
viscosity of water, respectively; k
r
( )
Sr is the relative permeability for liquid that dependson the saturation degree S
r (van Genuchten, 1980); and
W
H
2O
is the rate of water formation.
Eq. (2) is driven by the partial pressure of CO2 in the gaseous phase denoted as Pc.
f
(
φ,Sr)
and Dc are the reduction factor (Millington, 1959) and the diffusion coefficient
of CO2 in gas phase, respectively, such that their product can be considered as the effective
diffusion coefficient of CO2 through the porous material. and
W
CO
2
is the rate of CO2
dissolution. The coupling between eqs. (1) and (2) appears through (i) the saturation degree
S
r, and (ii) the rates of water formation and carbon dioxide dissolution. These rates,
WH2O
and
WCO2 respectively, derive from the molar formation rate of calcite (
N
cal, eq. (4)), and
the molar dissolution rate of portlandite ( , eq. (5)) and of other hydrates (
NCSH, eq.
(6)), mainly C-S-H. We have indeed considered separately the dissolution - precipitation processes of portlandite and of the other hydrates, due to the higher reactivity of
portlandite (Bary and Sellier 2004, Thiery et al. 2007).
CSH por cal N N N = + (4)
( )
r H p( )
p c sl por k S k k V P N = ~ (5)( )
r H CSH(
cal)
c sl CSH k S k k C P N = ~ (6) where ksl
( )
Sr is a function introduced by Bazant and Najjar (1972) to describe at amacroscopic scale the influence of the saturation degree on the chemical reaction processes (i.e. the reduction of water in the pores leads to decrease the reactions); kH is the Henry constant for carbon dioxide; and the functions
kp
( )
Vp and kCSH
(
Ccal)
are kineticcoefficients depending on the current volume fraction of portlandite Vp and concentration of calcium in solid phase Ccal, respectively. It should be stressed that the simplified
chemical reactions relative to the hydrate dissolution – calcite precipitation as expressed by these equations correspond to first order kinetic law with respect to the CO2 pressure. The
kinetic coefficient for the calcite formation from portlandite
kp is assumed to evolve as proposed in Thiery et al. (2007), i.e. the calcite is supposed to form a growing layer
surrounding the portlandite crystals during the dissolution process. The consequence is that this layer progressively reduces the corresponding chemical reactions kinetics, which are driven by the diffusive phenomena through the calcite layer. The kinetic coefficient for the
other hydrates is assumed to evolve linearly with the calcium concentration.
The main simplification of this numerical model in comparison to the previous version (Bary and Sellier, 2004) concerns the calcium concentration calculation. In the present approach, no diffusion of calcium is considered and it is instead replaced by a local chemical equilibrium of calcium, meaning that the calcium dissolved from portlandite and the other hydrates is locally transformed into calcite. Formally, this is equivalent to
considering that the whole calcite formation process (including CO2 diffusion) is faster
than calcium migration through the solution. (de Larrard et al., 2013a) numerically
demonstrated that this simplification has a very weak influence on the results in the case of accelerated carbonation. Further investigations, which are beyond the scope of this paper, would be necessary to analyse its effects in atmospheric carbonation conditions.
The model presented above has been modified to take into account the influence of temperature variations on carbonation. The modifications of the carbonation model to take into account temperature effects are detailed in (de Larrard et al., 2013b), based upon the studies proposed in (de Larrard et al. 2012). These modifications include the influence on the following thermo-activated parameters/phenomena: (i) the CO2 diffusion coefficient,
(ii) the dissolution of portlandite, as well as other hydrates, (iii) the constant of Henry (eq. 5), and (iv) the sorption-desorption isotherms. The dependency of temperature of all these parameters/phenomena is modelled with Arrhenius functions. According to Yuan and Jiang (2011), we assume that temperature inside concrete is constant and equal to the atmospheric temperature. It is to be noted that the effective temperature of RC elements exposed to solar radiation may differ from the ambient temperature, but it is assumed that the time steps used for numerical simulations are large enough to work with a mean value for the temperature and the difference (as the kinetics for the heat transfer is important with regards to these for the aggressive species diffusion) involved by this assumption are neglected. This will be the subject for a future study, beyond the scope of the present paper.
This carbonation model was implemented in the finite element code Cast3M (www-cast3m.cea.fr), and the equations solved successively and iteratively with a fully implicit numerical scheme. To conclude, the present model turns out to provide results in terms of calcite and portlandite concentration profiles very close to the ones obtained with a previous and more complex version of the model. Further, the phenolphthalein
carbonation depths calculated in the case of an accelerated test appear in very good
agreement with both experimental and numerical results (de Larrard et al. 2013a). We then consider that the model is relevant and suitable for the probabilistic simulations required to determine the reliability index of RC structures under the combined action of climate change and carbonation.
4. Reliability Analysis
A common practical measure of the structural reliability is the Hasofer-Lind’s reliability index denoted β (Hasofer and Lind, 1971). This index is defined in the standardised space of reduced normal and independent variables as the minimum distance from the origin to a point of the failure surface, the so-called design point P*. The determination of β is a
constrained optimization problem (Hasofer and Lind, 1971; Rackwitz and Fiessler, 1979). The function to be minimised is the Euclidean distance ||u|| in the standardised space under the constraint G(u)=0, where G is the limit state function. If u* is the solution of the
optimization with β=||OP*||=||u*||, then:
u*=arg min u
( )
G u( )=0 (7)
As the carbonation depth is not directly accessible numerically, the failure function for the carbonation model presented in this paper is based on the quantity of portlandite dissolved at the steel/concrete interface. The carbonation depth, as defined by the widely used phenolphthalein test, is simply estimated from the portlandite profile for a threshold value of dissolution. For instance, if the remaining volume fraction of portlandite is less than 33% of the initial value after dissolution at the cover depth, it is considered that corrosion starts. This threshold is among the values reported by Chang and Chen (2006), de Larrard et al. (2013a) and Park (2008). Thus, for this threshold value, the limit state function becomes:
G u
( )
= Vp(
u,ct( )
u ,tfin)
−0.33×Vp
(
u,ct( )
u ,t0)
(8)where Vp is the volume fraction of portlandite, depending on ct, being the concrete cover thickness from the exposed face, and the time. Vp is calculated with the FE model
presented above. tfin is the final time of the simulations (100 years), and t0 is the initial time (0 year). It is clear that the choice of the dissolved portlandite threshold will affect the assessment of reliability index. However, for a comparative study of climate change effects on various climates, the global trends will be the same for all the studied cases if the
threshold is fixed.
According to design codes, G(u) defines a limit-state function, which is expected to be continuous, at least in the neighbourhood of the design point P*. Most part of
optimization algorithms used in structural reliability are useful for differentiable constraint functions. However, in the carbonation model considered in this study, the limit state function G is computed by using the finite element method. Therefore, the reliability index is computed according to the gradient projection algorithm in the standardised space (Duprat et al., 2010). The result of the reliability analysis could therefore provide β over the lifetime tfin.
5. Numerical Example: Application to RC Structures Placed in France 5.1. Problem description
The objective of this example is to estimate the effects of several scenario of climate change on the carbonation of a RC structure placed in several cities in France. The material considered is a CEM I concrete with a water/cement ratio equal to 0.42 and 68% aggregate volume fraction. The material is initially set to saturation degree corresponding to the year
before 2,000, and exposed to drying, carbonation and temperature variations according to climate change scenarios for each city. It is also supposed that carbonation takes place in one dimension. The material properties as well as the model parameters were chosen equivalent to those proposed in de Larrard et al. (2013a).
Table 1 presents the five random variables considered in this study. Concrete cover corresponds to a global structural uncertainty related to a variability introduced by the building process. The initial porosity of the cement paste has a significant influence on the kinetics of the diffusion processes studied here, as it appears in every term of the
governing equations. Two other variables concern the drying process: the intrinsic permeability K0 and the m parameter from the van Genuchten model, which governs the desorption isotherm. The last random variable is the diffusion coefficient for CO2. These 4
last parameters are materials properties. Their “randomness” stands for the natural uncertainty and spatial variability of the materials properties, even for the same concrete formulation. These random variables follow independent normal distributions with a coefficient of variation (COV) equal to 5%. These means and COVs are among the values observed for a given concrete formulation (de Larrard et al., 2010, 2013a). It is to be noted that the choice of a normal distribution may not be the most relevant, even though it is in good accordance with the data observed in de Larrard et al. (2013). Besides, these values for the COVs are within the lower values experimentally observed. The COVs depend on the mix design and the implementation process of the concrete. However, this study aims mainly at comparing the different scenarios for different locations; therefore it is mostly important to keep the same hypothesis for all cases.
Table 1. Statistical parameters of the random variables (de Larrard et al., 2010, 2013a)
Variable Unit Distribution Mean COV
concrete cover, ct cm Normal 2 5%
Initial porosity, φ0 % Normal 30 5%
Intrinsic permeability, K0 m2 Normal 1.8×10⁻²² 5%
Parameter, m (eq. (3)) Normal 0.532 5%
Diffusion coefficient, Dc m2/s Normal 1.9×10⁻⁸
5%
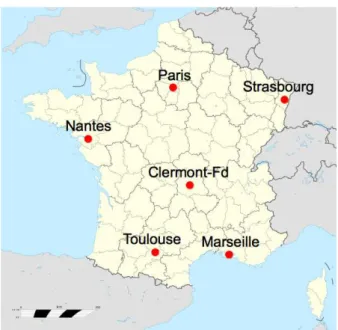
This work focused on the study of the effects of climate change on specific locations in France: Marseille, Paris, Toulouse, Strasbourg, Clermont-Fd. and Nantes (Figure 3). These cities correspond to different types of climate: Nantes is close to the Atlantic Ocean in the Northern part of the country and has a temperate oceanic climate; Toulouse is in the South and its climate has continental, oceanic, and Mediterranean influences; Marseille in the South-East on the Mediterranean coast and has a
Mediterranean climate rather hot and dry; Strasbourg in the North-East, close to the German frontier with a northern continental climate; Paris is more in the centre of the country with an intermediate continental climate; and Clermont-Fd. is in the mountains of ‘Massif Central,’ in elevated south-central France and has rather a continental climate.
Figure 3. Studied locations in France
5.2. Results and Discussions
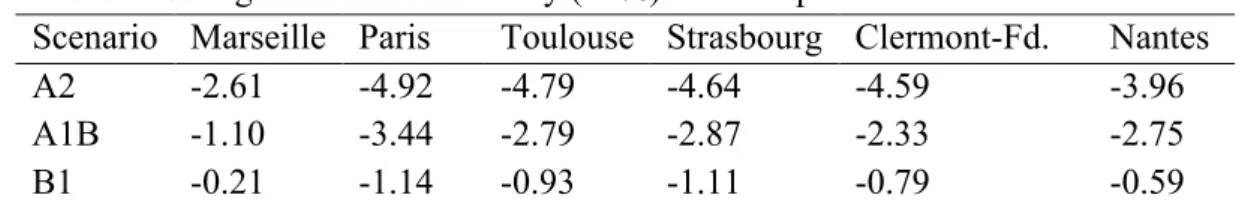
As mentioned in Section 2, climate change effects on weather will be different for each location. By using the outputs of the French atmosphere model, Table 2 describes the mean temperature and RH for the first decade of the study (2001-2010). It is observed that Marseille is the most hot and dry city, Strasbourg is the most cold and Nantes is the most humid. Tables 3 and 4 summarise the effects of climate change by comparing the mean values of the first (2001-2010) and the last decade (2091-2011) for each climate change scenario. Figure 2 presented an example of evolution of T and RH for one of the studied locations, whereas Tables 3 and 4 summarizes these evolutions for the different cities and for various periods through the elevation of their mean values. Table 3 indicates that temperature could increase from 1.14 up to 3.63 ºC with respect to current values for all the locations over the period 2001-2100. It is noted that Strasbourg could be more affected by climate change. Table 4 shows that climate change could reduce the current RH by -0.21% up to -4.92% with respect to current RH. The major changes could be expected for Paris. It is also confirmed that the A2 scenario is the most pessimistic with larger
temperature increases and RH decreases. The B1 scenario predicts lower changes in temperature and RH and the A1B scenario is intermediate between A2 and B1. Table 2. Mean temperature and RH over the period 2001-2010
Scenario Marseille Paris Toulouse Strasbourg Clermont-Fd. Nantes Temperature 14.75 13.04 14.08 11.53 11.66 12.76
RH 68.78 74.22 77.36 77.02 75.44 80.65
Table 3. Change in temperature (in ºC) over the period 2001-2100
Scenario Marseille Paris Toulouse Strasbourg Clermont-Fd. Nantes
A1B +2.21 +2.56 +2.29 +2.58 +2.39 +2.23
B1 +1.16 +1.33 +1.18 +1.40 +1.28 +1.14
Table 4. Change in relative humidity (in %) over the period 2001-2100
Scenario Marseille Paris Toulouse Strasbourg Clermont-Fd. Nantes
A2 -2.61 -4.92 -4.79 -4.64 -4.59 -3.96
A1B -1.10 -3.44 -2.79 -2.87 -2.33 -2.75
B1 -0.21 -1.14 -0.93 -1.11 -0.79 -0.59
Table 5 presents the reliability indexes for these climate change scenarios over a period of 100 years. It is observed that there is a large variation of the reliability index from β < 0 to β > 8. Let us specify here that a reliability index negative refers to a situation where the probability of corrosion initiation is higher than 50%. This implies a larger difference in the safety issues for the extreme cases. This larger variability is due to the fact that the same material has been tested for cities with different climates (Table 2). For instance, the climate is very different in Nantes and Marseille. Since the exposure
conditions are not the same, we should design a specific formulation for a concrete or select a different concrete cover adapted for each city. Considering the same concrete mix design for such different exposure conditions was required only for the needs of the comparison within the framework of this study. The reliability index for Marseille was β < 0, indicating that the probability of corrosion initiation is very high in a period of 100 years. The lower values of β for Marseille are explained, on the one hand, because the temperature is more important and carbonation is thermo-activated. On the other hand, RH varies between 65 and 70% by accelerating carbonation. These results could justify the implementation of an adaptation measure for this type of climate that could consist of increasing the concrete cover or the strength grade (Bastidas-Arteaga and Stewart, 2014). Table 5. Reliability indexes for the different climate change scenarios
City A2 A1B B1 Marseille < 0 < 0 < 0 Paris 1.70 3.68 6.55 Toulouse 2.09 3.90 6.91 Strasbourg 7.51 > 8 > 8 Clermont-Fd. > 8 > 8 > 8 Nantes > 8 > 8 > 8
On the opposite, corrosion initiation risks are very low for the cities of Strasbourg, Clermont-Fd., and Nantes. Even considering the effects of climate change, the lower temperatures and higher RH for these cities decelerate the carbonation process. For example, RH in Nantes remains between 80 and 85% which corresponds to a “retarding effect”, modelled by the function presented in eq. (2) (Millington, 1959): when RH is larger (RH > 80 %), there is not enough gaseous phase in the pores for the diffusion
process to occur efficiently. This “natural safety” due to a higher RH appears mainly because only carbonation is studied here, but the opposite effect would appear if the corrosion process were considered instead (because its kinetics is driven by water saturation).
Climate change could have important effects in structures placed in Paris and Toulouse. Although Paris has lower temperatures than southern cities, the value of RH for the decade 2001-2010 is within the optimal interval for accelerating carbonation (Table 2). Climate changes also accelerate carbonation in Paris by a significant decrease of RH (Table 3). Toulouse has a similar behaviour to that of Paris. On the one hand, the higher Temperature in Toulouse accelerates the carbonation effects; on the other hand, the larger RH reduces them. It is therefore possible to conclude that, for the studied locations, carbonation is more sensitive to RH than temperature. It is to be noted that, except for Marseille, the reliability index is higher to the 1.5 value given for a serviceability limit state in Eurocode 0. The reliability index calculated here only takes into account the carbonation process, and not the oxygen transfer for instance which is linked to the
corrosion process kinetics. Therefore, no conclusion concerning actions required on the RC elements considered here can be drawn directly from these results.
Concerning the effects of different climate change scenarios, it appears that the reliability index decreases when temperature increases and RH decreases. The impact of the scenario is significant for Paris and Toulouse. For instance in Paris, according to B1-scenario, the reliability index is close to 6.6, which corresponds to a rather safe area, but according to A2-scenario, it is reduced to 1.7. This means that, under A2-scenario, the RC structures should be surveyed with care or adaptation measures implemented, because the risk of carbonation around the steel rebar (and corrosion initiation) is significant.
This discussion will end with some comments about the coordinates of the design point in the standardised space. These coordinates are presented in Table 6 for the A1B (intermediate scenario). These coordinates indicate how many standard deviations separate the design point from the origin of the standardized space (being the mean value for each input parameter). A high value for a coordinate indicates that the design point is located in the distribution tail for the considered parameter. Therefore, it implies that this parameter has a significant influence on whether the mean point is in the security domain or in the failure area.
Table 6. Design point coordinates in the standardised space for A1B scenario
City ct φ0 K0 m Marseille 3.05 -1.58 -0.28 -1.62 -4.49 Paris -3.09 0.72 0.38 0.91 1.58 Toulouse -3.48 0.87 0.38 1.03 1.07 Strasbourg -8.26 1.29 0.76 1.64 2.37 Clermont-Fd. -10.68 1.46 0.69 1.73 2.55 Nantes -14.29 1.26 0.63 1.53 1.81
These results indicate that the most influent random variable on the reliability analysis is the concrete cover thickness. The other random variables have a similar order of
c
importance. One can also discuss the physical sense of these coordinates. It is obvious that increasing cover thickness increases the structural reliability for it lengthens the path from the external environment to the steel rebar. A reduction of the coefficient of diffusion or the permeability, as well as the porosity, decreases the transfer ability of the porous
material (either for CO2 or water, or even both). The last parameter is the m factor from the
desorption isotherm (eq. (3)). A decrease of this parameter rises the desorption isotherm curve in a (RH; Sr) plot, meaning that for the same hydric state (governed by the water pressure, and therefore the relative humidity RH), the saturation degree Sr is higher. This reduces the gaseous phase in the pores, where the CO2 diffuses, and thus decelerates the
carbonation process.
6. Conclusions and perspectives
In this paper, we proposed a probabilistic finite element model for carbonation under variable conditions of temperature, relative humidity and CO2 concentration. This model
allows us to determine the reliability index of RC structures exposed to a risk of corrosion induced by the cement paste carbonation and climate change. We calculated this reliability index for six cities in France corresponding to different kinds of climate (oceanic,
Mediterranean and continental) according to several scenarios of climatic changes. This study has shown that carbonation is very sensitive to local climate. There are locations with a large carbonation risk for which current environmental conditions could accelerate corrosion initiation (Marseille). A specific design improvement and/or
adaptation strategy should be considered for these climates. There are also other climates for which carbonation risks are lower for an optimistic climate change scenario but could be significantly increased for the most pessimistic scenario (Paris and Toulouse). These results highlight the importance of considering the climate evolution in lifetime assessment to predict, as precisely as possible, carbonation risks. This study has also shown that in first approach, the most influent parameter on the structural safety remained the concrete cover thickness, more than materials properties (such as porosity, permeability, diffusion coefficient or desorption isotherm). This work appeals in-depth studies about a
comprehensive characterization of the probability distributions of the random variables. Also the correlations between the materials properties involved in the degradation
processes could be considered. Another last of improvement is the selection of a threshold defining the carbonation depth and its relationship with effective corrosion initiation. Acknowledgements.
The authors would like to thank Météo-France for providing the climate change projections used in this work, and the French Alternative Energies and Atomic Energy Commission (CEA) for its financial and technical support to implant the numerical model in CAST3M.
References
Bary, B. and Sellier, A., 2004. Coupled moisture–carbon dioxide-calcium transfer model for carbonation of concrete. Cement and Concrete Research, 34, 1859–1872.
Bastidas-Arteaga, E., Chateauneuf, A., Sánchez-Silva, M., Bressolette, P., and Schoefs, F., 2010. Influence of weather and global warming in chloride ingress into concrete: A stochastic approach. Structural Safety, 32, 238–249.
http://dx.doi.org/10.1016/j.strusafe.2010.03.002
Bastidas-Arteaga, E., Schoefs, F., Stewart, M. G., & Wang, X. (2013). Influence of global warming on durability of corroding RC structures: A probabilistic approach. Engineering Structures, 51, 259–266.
http://dx.doi.org/10.1016/j.engstruct.2013.01.006
Bastidas-Arteaga, E. and Stewart, M. G., 2014. Damage Risks and Economic Assessment of Climate Adaptation Strategies for Design of New Concrete Structures Subject to Chloride-Induced Corrosion. Submitted to Structural Safety
Bazant, Z.P. and Najjar, L.J., 1972. Nonlinear water diffusion in nonsaturated concrete.
Materials and Constructions, 5, 3-20.
Chang, C.F. and Chen, J.W., 2006. The experimental investigation of concrete carbonation depth. Cement and Concrete Research, 36, 1760–1767.
de Larrard, T., Benboudjema, F., Colliat, J.B., Torrenti, J.M. and Deleruyelle, F., 2010. Concrete calcium leaching at variable temperature: Experimental data and numerical model inverse identification. Computational Materials Science, 49:35-45.
de Larrard, T., Poyet, S. Pierre, M., Benboudjema, F., Le Bescop, P., Colliat, J.B. and Torrenti, J.M., 2012. Modelling the influence of temperature on accelerated leaching in ammonium nitrate. European Journal of Environmental and Civil
Engineering, 16 (3-4), 322-335.
de Larrard, T., Bary, B., Adam, E. and Kloss, F., 2013a. Influence of aggregate shapes on drying and carbonation phenomena in 3D concrete numerical samples.
Computational Materials Science, 72, 1-14.
de Larrard, T., Duprat, F., Bastidas-Arteaga, E. and Schoefs, F., 2013b. Carbonation under variable temperature: effects of climate variations and global warming on the durability of RC structures. European Journal of Environmental and Civil
Engineering. Submitted.
Déqué, M., Dreveton, C., Braun, A. and Cariolle, D., 1994. The ARPEGE-IFS atmosphere model: a contribution to the French community climate modelling. Climate
Dynamics, 10, 249-266.
Duprat, F., Sellier, A., Nguyen, X.S. and Pons, G., 2010. The projection gradient algorithm with error control for structural reliability. Engineering Structures, 32, 3725–3733. Hasofer, A.M. and Lind, N.C., 1971. An exact and invariant second moment code format.
Journal of Engineering Mechanics, 100, 111-121.
IPCC, 2007. Climate Change 2007: The Physical Science Basis. Contribution of Working Group I to the Fourth Assessment Report of the Intergovernmental Panel on Climate Change. Cambridge, United Kingdom and New York, NY, USA: Cambridge University Press.
Mainguy, M., Coussy, O. and Baroghel-Bouny, V., 2001. Role of air pressure in drying of weakly permeable materials. Journal of Engineering Mechanics, 127, 582-592.
Millington, R.J., 1959. Gas Diffusion in Porous Media. Science, 130, 100-102.
Park, D.C., 2008. Carbonation of concrete in relation to CO2 permeability and degradation
of coatings. Construction and Building Materials, 22, 2260–2268.
Rackwitz, R. and Fiessler B., 1979. Structural reliability under combined random load sequences. Computers and Structures, 9, 489-494.
Stewart, M. G., Wang, X., & Nguyen, M. N. (2011). Climate change impact and risks of concrete infrastructure deterioration. Engineering Structures, 33(4), 1326–1337. Talukdar, S., Banthia, N., Grace, J. R., & Cohen, S. (2012). Carbonation in concrete
infrastructure in the context of global climate change: Part 2, Canadian urban simulations. Cement and Concrete Composites, 34(8), 931–935.
Thiery, M., Villain, G., Dangla, P. and Platret, G., 2007. Investigation of the carbonation front shape on cementitious materials: effects of the chemical kinetics. Cement and
Concrete Research, 37, 1047–1058.
van Genuchten, M.T., 1980. A closed-form equation for predicting the hydraulic
conductivity of unsaturated soils. Soil Science Society of America Journal, 44, 892–898.
Wang, X., Stewart, M. G., & Nguyen, M. (2012). Impact of climate change on corrosion and damage to concrete infrastructure in Australia. Climatic Change, 110(3-4), 941–957. doi:10.1007/s10584-011-0124-7
Wigley, T.M.L., Richels, R. and Edmonds, J.A., 1996. Economic and environmental choices in the stabilization of atmospheric CO2 concentrations. Nature, 379, 240– 243.
Yuan, Y. and Jiang, J., 2011. Prediction of temperature response in concrete in natural climate environment. Construction and Building Materials, 25, 3159–3167.