HAL Id: hal-00810906
https://hal.archives-ouvertes.fr/hal-00810906
Submitted on 23 Apr 2012
HAL is a multi-disciplinary open access
archive for the deposit and dissemination of
sci-entific research documents, whether they are
pub-lished or not. The documents may come from
teaching and research institutions in France or
abroad, or from public or private research centers.
L’archive ouverte pluridisciplinaire HAL, est
destinée au dépôt et à la diffusion de documents
scientifiques de niveau recherche, publiés ou non,
émanant des établissements d’enseignement et de
recherche français ou étrangers, des laboratoires
publics ou privés.
How far can the resonance frequencies give informations
about the playing frequencies? The trumpet example
Pauline Eveno, Benoît Kieffer, Joël Gilbert, Jean-François Petiot, René Caussé
To cite this version:
Pauline Eveno, Benoît Kieffer, Joël Gilbert, Jean-François Petiot, René Caussé. How far can the
res-onance frequencies give informations about the playing frequencies? The trumpet example. Acoustics
2012, Apr 2012, Nantes, France. �hal-00810906�
How far can the resonance frequencies give informations
about the playing frequencies? The trumpet example
P. Eveno
a, B. Kieffer
a, J. Gilbert
b, J.-F. Petiot
cand R. Causs´e
aa
IRCAM, 1 place Igor Stravinsky, 75004 Paris, France
bLaboratoire d’acoustique de l’universit´e du Maine, Bˆ
at. IAM - UFR Sciences Avenue Olivier
Messiaen 72085 Le Mans Cedex 9
c
Ecole Centrale de Nantes, 1 rue de la noe, BP 92101, 44321 Nantes, France
pauline.eveno@ircam.fr
Measurements and calculations of the input impedance of wind musical instruments are now well mastered. The purpose of this work is to study experimentally how far the resonance frequencies of brass instruments, taken from their input impedance, are able to give informations about the playing frequencies. Three different trumpets, obtained by changing only the leadpipe of the same instrument, were considered for the experiment. After a measurement of the input impedance of these trumpets, four musicians were asked to play the five first playable notes (regimes 2 to 6), for four different fingerings. This exercise was done for three nuances and was repeated three times. Finally, these 3∗ 4 ∗ 5 ∗ 4 ∗ 3 ∗ 3 = 2160 notes allow us to make a quantitative assessment of the relations between the resonance frequencies and the playing frequencies. Results show first, a limited influence of the musician on the overall intonation of the instrument. Second, the pitch of the notes does not vary much with the nuances. Finally, the results confirm the fact that variations of the resonance frequencies lead to variations of the playing frequencies of the same order.
1
Introduction
Measurements and calculations of the input impedance of wind musical instruments are now well mastered [1, 2, 3, 4]. As part of a project aiming at helping instruments makers to design and characterize their musical instrument, this work focuses on how the resonance frequencies taken from the input impedance can be related to the playing frequencies. Indeed, an instument maker is first interested by the over-all tone of his/her instruments in playing situation and thus needs an indicator which is able to predict their intonation.
The purpose of this work is to study experimentally how far the resonance frequencies of a trumpet, taken from the input impedance of the instrument, are able to give informa-tions about the playing frequencies. This will be done by recording a large number of notes played by several musi-cians on three trumpets.
Section 2 presents some basic informations about the acoustics of the trumpet. Then, section 3 explains the record-ing of the musicians playrecord-ing the different trumpets and the analysis of the data. From these measurements, an analysis of the musicians behaviour is done on section 4. In section 5 the playing frequencies of the recorded notes are compared to the resonance frequencies taken from the input impedance of the trumpets. Then, in order to minimize the influence of the musician on the results section, 6 focuses on the differ-ences of frequencies instead of the frequencies themselves.
2
Trumpets resonances and playing
frequencies: Preliminary discussion
2.1
Trumpet geometry
The canal of the trumpet can be separated in two parts: first, a long central cylindrical part on which are connected cylindrical bypasses brought in/out working order by valves and second, a flared part, the horn. Then, the mouthpiece is an independant piece which fits into the instrument input and whose role is to fulfil the adaptation between the musician’s lips and the instrument. This mouthpiece can be represented in broad outline by two cones, the first with a strong conic-ity closes until the throat where the radius is minimum, the second of small conicity opens slightly in order to fit into the trumpet input, on a piece called the leadpipe (see figure 1) which is a part quite influential on the acoustic behaviour of the instrument [5]. Its internal rotation-symmetrical ge-ometry has a priori a complex shape (neither cylindrical nor conical).
Figure 1: Photo of a trumpet with the “100” fingering (1 for the first valve pushed in and 0 for the others which are not
depressed). The position of the leadpipe is shown by a dashed line.
2.2
Input impedance and playable notes
The acoustic response of an instrument at different frequencies can be characterized by its input impedance (impedance computed or measured at the input of the com-plete instrument, that is to say at the input plane of the mouth-piece), ratio of the acoustic pressure amplitude to the acous-tic flow amplitude. A typical input impedance of brass instru-ment (see figure 2) shows a large number of resonance fre-quencies, where the impedance amplitude is maximum and the phase is passing by zero. Each of these resonance fre-quencies is associated to a note (or oscillation regime) played by the musician. In the example of figure 2, corresponding to the basic fingering of a Bb trumpet where none of the three valves are in action, the eight first resonances correspond to the series of concert notes Bb2, Bb3, F4, Bb4, D4, F5, Ab5, Bb5 (the harmonic series of Bb). The three valves offer thus 8 combinations which allow the construction of the whole chromatic range. Indeed the activation of a valve produces an elongation of the air column. The resonance frequencies of the instrument are thus dropped of a value that depends on the added length. The first valve brings down the frequencies of a tone, the second of a semi-tone and the last one of one and a half tone. In the rest of the article, a pushed in valve will be noted 1 and a valve not activated will be 0. In this way, the fingering of the trumpet in figure 1 can be written as “100”.A first approximation of the intonation of the instrument can be done by comparing the resonance frequencies to their corresponding notes in the equally-tempered scale of A 440 as it is shown in figure 3 for one of the three trumpets used in
0 200 400 600 800 1000 1200 −10 0 10 20 30 40 Frequency (Hz) Amplitude (dB)
Figure 2: Measurement of the input impedance amplitude of a trumpet (bottom) with the notes corresponding to each
impedance peaks (top).
this study. This diagram shows the increasing inharmonicity with the length of the cylindrical part. Indeed the 000 finger-ing, when the air column is the shortest, is close to zero in cents whereas the 111 fingering which gives the longest air column gives also resonance frequencies which are far from the notes of the scale. Thus, once the geometry of the instru-ment is fixed, the art of the craftsman consists in choosing the three bypasses lengths in order to make trumpet as in tune as possible. 1 2 3 4 5 6 7 −80 −60 −40 −20 0 20 40 60 80 Regime Number (Hz) Intonation (cents) 000 100 110 111
Figure 3: Intonation of a trumpet in cents, realized by calculating the difference between each resonance frequency
of the trumpet input impedance for the four fingerings and its corresponding note in the equally-tempered scale of A
440.
However, the playing frequencies are not exactly equal to the resonance frequencies. The difference results from the coupling between the vibrating lips of the musician and the instrument. The musician can thus choose one note from the harmonic series by making his/her lips vibrate at the
fre-quency of the chosen note. Furthermore, a wind instrument is not an instrument with a fixed sound, that is to say the mu-sician can modify the pitch and the timbre of the played note by controlling his/her embouchure. The term embouchure means the capacity of the musician to control the mechani-cal parameters of his/her vibrating lips by changing his/her facial musculature and the bearing force of the lips on the mouthpiece. It also includes his/her ability to command the air flow between his lips.
3
Set-Up and Data Analysis
3.1
Set-Up
A parametrised leadpipe, made of four different inter-changeable parts, was designed [6, 7]. Four parts with var-ious radii values have been manufactured with a numeri-cally controlled turning machine. One letter has been given for each part of the leadpipe, corresponding to its dimen-sions. Thus, using the same trumpet (Bach model Vernon, bell 43) and the parametrised leadpipe, different instruments with small different acoustical behaviour can be designed. Three leadpipes were considered for the study: two of the manufactured leadpipes (DKNR and CHMQ) and a leadpipe originally provided with the trumpet, called NORM as “nor-mal leadpipe”.
Then the input impedances of these trumpets were mea-sured for four different fingerings: 000, 100, 110 and 111. In the trumpet, contrary to the trombone, the first regime is not played. Regimes 2 to 6 are normally played by musi-cians for fingerings 000 and 100. In this part, notes will be expressed as written notes for the trumpet and no as concert pitch. For the 110 fingering, musicians play notes from the second regime to the fifth and the sixth is generally not used since the E5 note can be played with the fifth regime of 000 fingering. As for the 111 fingering, only the regimes 2 and 3 are usually played. Regimes 4, 5 and 6 are an alternative way to play Gb4, Bb4 and Db5, notes for which musicians usu-ally use the third regime of 010 fingering (Gb4), the fourth regime of 100 fingering (Bb4) and the fifth regime of 110 fingering (Db5). These extreme fingerings are chosen in or-der to study the whole range of trumpet frequencies, from the lowest pitch to the highest. Furthermore, even if several regimes are almost never used by the musicians, it is inter-esting to record them in this study. Indeed, trumpet players are not used to play these notes so there is no “learning ef-fect” which means that they are more likely to play without focusing on the intonation.
Four musicians were asked to play the three trumpets for recording the sounds. After a short period of warming-up the instrument, the trumpet player had to play the five first playable notes (regimes 2 to 6) by saying the name of the note before playing in order to “forget” the pitch of the previous note. Indeed, the musicians were asked to play the note with the easiest emission, without focusing on the intonation. This recording was done for three nuances: first mezzo forte, then piano and finally forte in order to study the influence of the nuance on the playing frequencies. Then, the trumpet player had to move to the next fingering with the same protocole and so on for the four fingerings and the three trumpets. Then, they had to repeat the whole exercise three times in order to test their repeatability. Finally, 4 trumpet players times 3
trumpets times 4 fingerings times 5 regimes times 3 nuances times 3 attempts gives 2160 notes to analyze.
3.2
Data Analysis
0 0.2 0.4 0.6 0.8 1 1.2 1.4 1.6 −0.1 0 0.1 Time (s) Amplitude (V) 0 0.2 0.4 0.6 0.8 1 1.2 1.4 1.6 226 228 230 232 234 236 238 Time (s) Frequency (Hz)Figure 4: Waveform (top) and evolution of the frequency (bottom) of the Bb2 played by a musician with the basic fingering 000. Dashed lines separe on the left the strinking
up and on the right the break from the rest of the “permanent” signal. The dotted line represents the mean
value and the error bar the standard deviation of the frequency during the permanent signal.
The musician cannot play a steady note and is oscillating around one frequency. This fluctuating playing frequency can be observed as a function of time thanks to YIN [8], a fundamental frequency estimator for speech and music. Fig-ure 4 shows an example of the frequency evolution of one note, concert Bb3, played by a musician with the basic fin-gering (000) at mezzo forte. At the beginning, the frequency rapidly increases: this is a typical striking up. The same ef-fect is happening at the end: the musician has run out of air so that the pitch rises. Between the striking up and the break, there is a “permanent” part where the frequency is fluctuat-ing of a few hertz around an average value. Thus, from a measured signal like the one in figure 4, what we call, in this paper, the playing frequency will be determined as the mean of the instantaneous frequency during the time t of the per-manent part and the standard deviation is calculated in order to estimate the “precision” of the trumpet player.
The measurements of the trumpets input impedances and the recording with musicians have been realized at different temperatures. Indeed, the input impedance was measured at 23◦C whereas notes were played at around 28.5◦C (estima-tion between the room temperature and the musician’s body temperature as proposed in [9]). Consequently, to do a re-liable comparison, resonance frequencies need to be moved forward of the equivalent temperature shift. Since the res-onances frequencies of both cones and cylinders are pro-portional to the sound velocity, which can be written as
c = 331.45√T/T0 with T the temperature in Kelvin and
T0 = 273.16K, it can be considered that resonance fre-quencies of a trumpet are proportional to the square root of the temperature expressed in Kelvin. Consequently, res-onance frequencies from the measured input impedances are increased by 16 cents which is the equivalent of 5.5◦C in order to be at the same level of temperature as the playing frequencies.
4
Musicians behaviours
In order to study the behaviour of each musician, it is possible to represent his playing, characterized here only by the pitch of the notes he plays, by a boxplot. A boxplot is a convenient way of graphically depicting groups of numerical data through their five-number summaries: the smallest ob-servation (sample minimum), lower quartile (25th percentile, bottom of the box), median, upper quartile (75th percentile, top of the box), and largest observation (sample maximum).
One boxplot per nuance allows one’s to study the influ-ence of the nuance on the playing frequencies. The sec-ond regime (first note played in the harmonic serie) is iso-lated from the boxplot since the playing frequencies for this regime are far from the resonance frequencies, that will be explained later on section 5. The boxplots are constructed from the difference between each playing frequency and its respective resonance frequency in cents. In each boxplot of figure 5, plotted here for one of the four trumpet players, there are 144 notes which represent 3 trumpets∗ 4 fingerings ∗ 4 regimes (3 to 6) ∗ 3 attempts. −30 −20 −10 0 10 20 30 40 pp mf ff
Figure 5: Boxplots representing the statistics of one trumpet player for the three nuances.
These boxplots show that globally the nuance does not have a strong influence on the playing frequencies. Nev-ertheless, and surprisingly, the trumpet player plays with a higher pitch at the piano nuance than at mezzo forte or forte. The same conclusion can be drawn for the three other musi-cians. It is thus possible for the rest of this study to merge the results for the three nuances and therefore to analyze the playing frequencies regardless of nuances. The four trumpet players have a similar behaviour as they all play in the order of 7 to 12 cents above resonance frequencies. Consequently there is no need to consider that each musician has a per-sonal embouchure that can influence the playing frequencies in a different way.
5
Playing frequencies Vs Resonance
frequencies
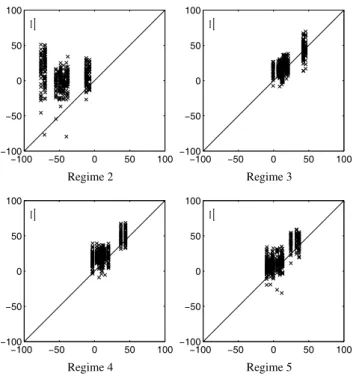
−100 −50 0 50 100 −100 −50 0 50 100 Regime 2 −100 −50 0 50 100 −100 −50 0 50 100 Regime 3 −100 −50 0 50 100 −100 −50 0 50 100 Regime 4 −100 −50 0 50 100 −100 −50 0 50 100 Regime 5Figure 6: Playing frequencies as function of resonance frequencies, given in cents (taking the 12 equal temperament
tuned relative to A 440 as a reference) for all the notes. Figure 6 presents the playing frequencies as functions of the resonance frequencies. Both of these frequencies are ex-pressed as cents taking the equally-tempered scale of A 440 as a reference. In this figure, and the figures thereafter, there are two error bars in the upper left-hand corner. The error bar on the left represents the average standard deviation of a note. For example, a musician who plays a note at a fre-quency f0will fluctuate between f0−σ and f0+σ. This error bar thus stands for the mean of theσ for all the musicians on all their played notes (540 notes for each musician in total). The error bar on the right represents the average repeatabil-ity of the trumpet players. Indeed, each musician will repeat 9 times the same note (3 nuances * 3 attempts). The stan-dard deviation is thus calculated on these 9 notes and then, the mean of these standard deviations is calculated on all the notes played by all the musicians (it is in fact a mean on 240 standard deviations).
In this figure there are 12 colums which represent all the combinations of the 4 fingerings on the 3 trumpets. In each column there are 36 points which represent the notes played 3 times by the 4 musicians for the 3 nuances. As it was said in the previous sections, the second regime is the most shifted from the resonance frequencies. Indeed the resonance fre-quencies of this regime are lower than the played notes, what could be explained by a tranfer of energy from higher modes, as first explained by Wogram [10] and took up by Pratt and Bowsher [11]. Nevertheless, this discrepancy occurs espe-cially for long portions of cylinder, as for the 111 fingering, where the inharmonicity is high, as previously shown in fig-ure 3. Notes played with this fingering are thus located in the three columns the most on the left. Obviously this fingering is practically never used. On the other hand, for short tubes,
as for the 000 fingering, the playing frequencies are quite close to the resonance frequencies. It is indeed the case for the three columns the most on the right. Finally, except for the second regime, it can be considered that the playing fre-quencies are almost equal to their corresponding resonance frequencies.
6
Frequencies variations
In order to have a less impact of the musician’s behaviour, it is interesting to focus on the differences of frequencies in-stead of the frequencies themselves. The goal is now to an-swer to the question: to what extent the variations of the reso-nance frequencies can give informations about the variations of playing frequencies? For ease of reading, the abbreviation dFres will be used to designate the difference between two resonance frequencies and dFplay for the difference between two playing frequencies.
For calculating differences, a reference is needed. Several can be chosen, according to what kind of variations needs to be studied. In order to observe small differences on geome-tries, the NORM trumpet is taken as the reference. In this part, all the notes played with the NORM trumpet are taken as a reference. The differences are thus calculated between the playing frequency of each note (trumpet i, fingering j, regime k, attemp l) and the playing frequency of the respec-tive note (fingering j, regime k, attemp l) played with the trumpet NORM. The same protocol is applied to the reso-nance frequencies. −50 0 50 −50 0 50 Regime 2 −50 0 50 −50 0 50 Regime 3 −50 0 50 −50 0 50 Regime 4 −50 0 50 −50 0 50 Regime 5
Figure 7: dFplay as a function of dFres, in cents, with the NORM trumpet as the reference.
Each plot of figure 7 is composed of 8 columns, the four fingerings of the trumpets CHMQ and DKNR, since each fingering actually leads to a different trumpet. In each column there are 36 points (4 trumpet players∗ 3 nuances ∗ 3 attempts). This figure shows that the differences of playing frequencies are centred around the line of equation dFplay=dFres. Only the second regime is more spread out
but the distance of the points the furthest from this line is in the order of magnitude of the musicians repeatability er-ror. Consequently, it can be considered that variations of the resonance frequencies lead to variations of the playing fre-quencies of the same order. This is an interesting case for the instrument making since craftsmen often work on small changes of geometry. Consequently, by measuring the vari-ation of the input impedance of their instrument before and after a modification the crafstman will be able to quantify the variation of the playing frequencies.
7
Conclusion
This study realized with four trumpet players on three trumpets for a large number of notes allows making a quanti-tative assessment of the relations between the resonance fre-quencies and the playing frefre-quencies. It was already known that playing frequencies were close to resonance frequencies but no detailed work had been previously carried out to quan-tify it.
For relatively small geometry variations, the differences on the resonance frequencies can predict the differences pro-duced on the playing frequencies: it is a good objective in-dicator as it does not take into account the influence of the musician. That is interesting for craftsmen who need to make instruments playable by every musician and who often work by doing small modifications of their instrument in order to make it in tune.
Moreover this study gives an order of magnitude of the musicians variability which confirms that the resonance fre-quency is a sufficient indicator of the playing frequency and that there is no need to search for a more precise one. In-deed the variability is quite high and each musician has his own way of playing and his own embouchure, thus it will be zealous to try finding a more accurate predictor.
Acknowledgments
This research was funded by the French National Re-search Agency ANR within the PAFI project (Plateforme d’Aide `a la Facture Instrumentale in French). The authors would like to thank all the trumpet players who participated in this study as well as J.-P. Dalmont for interesting discus-sions.
References
[1] J. Backus,“Input impedance curves for the brass instru-ments”, J. Acoust. Soc. Am. 60(2) 470-480 (1976) [2] R. Causs´e, J. Kergomard, X. Lurton, “Input impedance
of brass musical instruments - Comparison between ex-periment and numerical models”, J. Acoust. Soc. Am. 75(1) 241-245 (1984)
[3] P. Eveno, J.-P. Dalmont, R. Causs´e, J. Gilbert, “Wave propagation and radiation in a horn: comparisons between models and measurements”, Acta Acustica
united with Acustica 98(1), 158-165 (2012)
[4] J.-P Dalmont, “Acoustic impedance measurement”,
Journal of Sound and Vibration 243(3), 427-459 (2001)
[5] M. Bertsch, “Bridging instrument control aspects of brass instruments with physics-based parameters”,
Pro-ceedings of SMAC 2003, Stockholm, Sweden, 193-196
[6] E. Poirson, Prise en compte des perceptions de
l’utilisateur en conception de produit. Application aux instruments de musique de type cuivre., Th`ese de
Doc-torat, Ecole Centrale de Nantes (2005)
[7] J-F. Petiot, E. Poirson, J. Gilbert, “Study of the relations between trumpets’ sounds characteristics and the input impedance”, Proceedings of Forum Acusticum 2005,
Budapest, Hungary, 747-752
[8] A. de Cheveign´e, H. Kawahara, “YIN, a fundamental frequency estimator for speech and music”, J. Acoust.
Soc. Am 111(4), 1917-1930 (2002)
[9] J. Gilbert, L.M. Leboso Ruiz, S. Gougeon, “Influence de la temp´erature sur la justesse d’un instrument `a vent”, Proceedings of Congr`es Fran¸cais d’Acoustique
2006, Tours
[10] K. Wogram, Ein Beitrag zur Ermittlung der Stimmung
von Blechblasininstrumenten, Technische Universit¨at
Carolo Wilhelmina, Braunschweig (1972)
[11] R.L. Pratt and J.M. Bowsher, “The objective assess-ment of trombone quality”, Journal of Sound and