Auteurs:
Authors
: Thomas Bertauld et Michel R. Dagenais
Date: 2017
Type:
Article de revue / Journal articleRéférence:
Citation
:
Bertauld, T. & Dagenais, M. R. (2017). Low-level trace correlation on
heterogeneous embedded systems. EURASIP Journal on Embedded Systems,
2017(1), p. 1-14. doi:10.1186/s13639-016-0067-1
Document en libre accès dans PolyPublie
Open Access document in PolyPublie URL de PolyPublie:
PolyPublie URL: https://publications.polymtl.ca/3077/
Version: Version officielle de l'éditeur / Published versionRévisé par les pairs / Refereed Conditions d’utilisation:
Terms of Use: CC BY
Document publié chez l’éditeur officiel
Document issued by the official publisher Titre de la revue:
Journal Title: EURASIP Journal on Embedded Systems
Maison d’édition:
Publisher: Springer Open
URL officiel:
Official URL: https://doi.org/10.1186/s13639-016-0067-1
Mention légale:
Legal notice:
Ce fichier a été téléchargé à partir de PolyPublie, le dépôt institutionnel de Polytechnique Montréal
This file has been downloaded from PolyPublie, the institutional repository of Polytechnique Montréal
R E S E A R C H
Open Access
Low-level trace correlation on
heterogeneous embedded systems
Thomas Bertauld
*and Michel R. Dagenais
Abstract
Tracing is a common method used to debug, analyze, and monitor various systems. Even though standard tools and tracing methodologies exist for standard and distributed environments, it is not the case for heterogeneous
embedded systems. This paper proposes to fill this gap and discusses how efficient tracing can be achieved without having common system tools, such as the Linux Trace Toolkit (LTTng), at hand on every core. We propose a generic solution to trace embedded heterogeneous systems and overcome the challenges brought by their peculiar architectures (little available memory, bare-metal CPUs, or exotic components for instance). The solution described in this paper focuses on a generic way of correlating traces among different kinds of processors through traces
synchronization, to analyze the global state of the system as a whole. The proposed solution was first tested on the
Adapteva Parallella board. It was then improved and thoroughly validated on TI’s Keystone 2 System-on-Chip (SoC).
Keywords: Heterogeneous embedded systems, Tracing, Traces synchronization, Traces correlation, Parallella,
Keystone 2
1 Introduction
Heterogeneous embedded systems combine the pecu-liarities of traditional embedded systems (little available memory and exotic architectures among others) with the complexity of having many processors of different archi-tectures on the same board. Usually, some processors are referred to as masters as they are the main cores, typically running a high-level OS (HLOS) like Linux, and offload-ing work to some coprocessors (slaves). Even though some coprocessors could run an HLOS [1], we assume in this paper that they are used as bare-metal units, as this brings the most compelling challenges. This is a reason-able assumption since those coprocessors are mostly used to perform very specific tasks and should not be disturbed by any other processes.
On such systems, finding the root of an issue such as a bottleneck, an abnormal latency, or even a simple bug usually cannot be done by separately looking at each core. For this reason, proper methods and tools should be used to have a complete understanding of the whole system. However, even the right tools can sometimes encounter
*Correspondence: [email protected]
Department of Computer and Software Engineering, École Polytechnique de Montréal, Montréal, Quebec, Canada
limitations on such devices: running the GDB debugger on a thousand cores, for instance, can be tough. As such, het-erogeneous system vendors often provide their own, more suited, diagnosis tools for a particular device, thus forc-ing the users to use as many different tools as there are existing platforms, without any consistency.
Tracing is an elegant and efficient way of obtaining information on a system while minimizing the moni-toring’s impact. It requires the instrumentation of the traced application (i.e., the addition of tracepoints) to output timestamp-matched events and give insights on the execution of specific parts of a system. A set of such events is called a trace. Because of its granularity (tracing can be as precise as the internal clock of the device is), traces can be massive and are not well-suited for every situation. However, tracing allows a better information-gain/performance-loss ratio than standard logging methods and requires less time and effort than classical step-by-step debugging.
In this paper, we present a generic way of tracing het-erogeneous embedded systems in an attempt to show how efficient it is to solve common problems and how it can lead to a standard analysis methodology for those systems. The described method only assumes that two common constraints are met. Under those reasonable assumptions,
© The Author(s). 2017 Open Access This article is distributed under the terms of the Creative Commons Attribution 4.0 International License (http://creativecommons.org/licenses/by/4.0/), which permits unrestricted use, distribution, and reproduction in any medium, provided you give appropriate credit to the original author(s) and the source, provide a link to the Creative Commons license, and indicate if changes were made.
only the actual implementation of the process can dif-fer from one system to another. By presenting how our solution is implemented on the Keystone 2 platform, we provide some guidelines and a complete example on how to proceed with any new platform, the key point being the implementation of the synchronization’s process.
This paper is structured as follows. Section 2 cov-ers related work on heterogeneous environments, trac-ing, bare-metal CPUs tracing and traces synchronization. Section 3 briefly describes the architectures of the two devices used in this work and highlights their specifici-ties. Section 4 introduces barectf1, a tool used to generate
traces on bare-metal systems. Section 5 then discusses in details the challenges and methods for correlating hetero-geneous traces. Finally, Section 6 exposes and discusses some results through a set of benchmarks and a complete use-case on the Keystone 2, before concluding on the state of tracing on heterogeneous embedded systems.
2 Related work
Working on heterogeneous environments can be a com-plicated task. Conte et al. [2] highlight in particu-lar how the use of different programming languages along with their respective (sometimes exotic) compil-ers and the inherent load balancing and management among heterogeneous environments are common prob-lems needing to be addressed. The latter issue is part of a more general load-balancing problem, for which it is impossible to design a universal solution, as the tasks distribution is heavily dependent on the algorithm being distributed. However, some works, such as [3], study the use of specific frameworks to balance the load between different components within the same heterogeneous environment.
Communications between heterogeneous components is a commonly addressed issue in distributed systems. It can be tackled in a similar way on embedded devices. In particular, Lamport [4] discusses the basis of interprocess communication mechanisms, where all can be reduced to a classical producer/consumer problem on a shared medium. In this model, a consumer will poll said medium and wait for a producer to change it (by adding data for instance). As far as heterogeneous embedded systems are concerned, a shared memory space can often endorse the role of the communication medium, where masters and slaves will both be producers and consumers. Of course, as underlined by Tanenbaum [5], it is mandatory to explicitly design a communication protocol to ensure that con-sumers and producers can both use the shared data. For instance, the data encoding and the bit ordering must be agreed upon before any transaction occurs.
Tracing is an efficient method to gather valuable informa-tion on a system, based on source-code instrumentainforma-tion.
The instrumentation will yield events when tracepoints are encountered, during the application’s workflow. Each event holds a payload and is associated with a finely-grained timestamp. Tracing is not to be mistaken with logging or profiling [6] as they serve different purposes. Logging is usually restricted to unusual or high-priority events such as system failures or abnormal behaviors. Pro-filing can be used to analyze the performances of separate parts of a system, giving an overview of useful metrics, without any need for events ordering. On the other hand, tracing can be used to monitor, debug, profile, or log sys-tems behaviors [7] and is often the favored solution to debug and monitor concurrent programs [8]. However, please note that logging, debugging, profiling, and tracing can all be used at different phases during the develop-ment cycle, and thus the use of one does not preclude the utilization of the others.
Since tracepoints can be placed anywhere in the appli-cation’s code, it is mandatory to ensure that the resulting instrumentation does not affect the observed state or create new issues. Indeed, tracing solutions need to be highly optimized as they should only minimally impact the monitored system, to avoid the undesired “probe effect” [9].
Tracing Linux-based systems has been proven many times to be a reliable and efficient solution. Common tools such as LTTng (Linux Tracing Toolkit next generation2)
are widely used to trace both the Linux kernel and user-space applications [10, 11]. Having the ability to trace both domains at once allows a better understanding of a system as a whole. It brings more context on abnormal behav-iors: the roots of an abnormally high latency cannot always directly be found in user-space and might require trac-ing system calls. Desnoyers and Dagenais [12] also showed that porting LTTng to different architectures could eas-ily be achieved, as long as some requirements, such as the presence of fine-grained timers, are met.
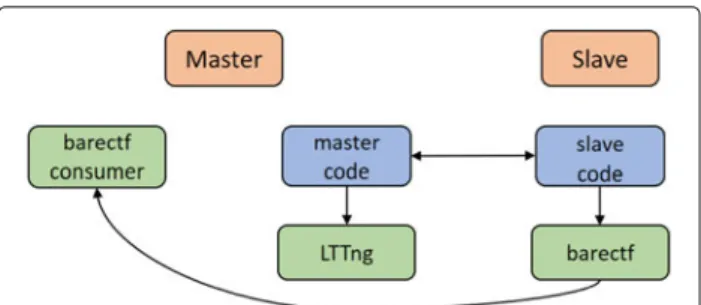
Tracing bare-metal systems is a bit more tedious as, by definition, there is no access to any of the usual Linux tools. Thankfully, barectf was created to address part of this issue. It is a python-based tool able to generate C99 code implementing tracepoints, which can then be linked with the user’s application to generate native common trace format (CTF) traces. This is particularly interesting as CTF is also the default output format for LTTng traces and aims to standardize traces’ outputs across different systems. As a proof of concept, Proulx particularly showed in [13] and [14] how barectf could be used to trace some very constrained coprocessors inside the Epiphany chip. Extending this work, we will demonstrate how barectf can be implemented on another platform, the TI’s Keystone 2 SoC. Figure 1 displays a basic setup enabling tracing of both a master CPU and its associated slave. Among other works targeting heterogeneous environments, Couturier
Fig. 1 Basic setup used to trace embedded heterogeneous systems
[15] explains how OpenCL calls can be intercepted to produce CTF-formated traces on GPGPUs. All of this lays the foundation of the standardization of traces collected on different components of a heterogeneous environment.
Having traces sharing the same format on every pro-cessor in a heterogeneous environment is a step forward towards the global monitoring of the system. However, it still is necessary to find a way to correlate said traces. In fact, traces obtained from different machines or dif-ferent processors, will most likely not share the same timestamps origin, have different working frequencies and frequency scaling policies. This is a common prob-lem when it comes to tracing distributed systems, as every component might use a different clock. As such, directly comparing traces obtained on all devices would not make much sense. Tanenbaum [5] lists traditional ways, such as NTP or the Berkeley algorithm, to achieve clocks synchronization in a distributed system. The clas-sical work of Lamport [16] summarizes the need to syn-chronize as the need to preserve the events causality. Under this constraint, only a logical clock would suffice and ensure that the events’ order is respected across the system.
In this context, Jabbarifar [17] proved that traces corre-lation can be achieved through synchronization, merging two or more traces with different timestamps’ origins into a single one with the same (fictitious) time ori-gin. Although this work addressed “live” synchronization (i.e., synchronization done while the traces are being recorded), the preferred way is to operate a post-analysis on existing traces, with a trace analysis and viewing soft-ware such as TraceCompass. This way, tracing is kept from interfering too much with the system and limits its per-formance overhead to the minimum. Poirier et al. [18], in particular, showed how generating pairs of match-ing events between traces brmatch-ings enough context for a post-tracing synchronization process. The idea is to pre-serve the causality relationship between all the events, by tracing interactions between remote cores and creating a fictitious global clock. This method will be further dis-cussed in Section 5.
As far as we are aware, no other published work was directed at tracing embedded heterogeneous systems in a generic and structured way, with traces taken at differ-ent levels being synchronized and analyzed in a suitable trace viewing tool. By using the tools and concepts previ-ously presented, we intend to show how such tracing can be achieved and how it can tackle common problems.
3 Background
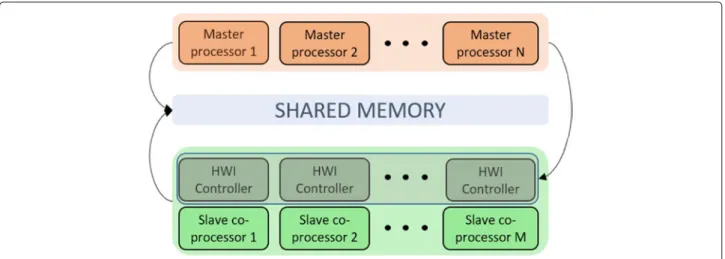
Our methodology aims at tracing both generic CPUs and coprocessors in an attempt to correlate the traces and analyze complex heterogeneous systems. Most of the het-erogeneous embedded devices used in industry are com-posed of generic-purposes ARM processors, coprocessors of various designs (from generic to highly specialized) and a shared memory space. The ARM processors can run an HLOS such as Linux and thus have common tracing tools at their disposal. The coprocessors are used as bare-metal computing units, on which the masters will offload part of the work. No common solution presently exists to con-sistently trace them and correlate the traces at a global scale. Figure 2 represents the common pattern on which this paper is focused.
The two primary devices used to develop and test our tracing method devices are of great interest as they respect this pattern and provide an interesting range of specifications. The first one (Adapteva’s Parallella) is an FPGA-based, custom board that could easily be used as a prototyping device, with very limited hardware and minimal coding APIs. By contrast, the Keystone 2 offers eight widely used TI’s DSPs a very powerful hardware and extensive APIs and could thus be adopted as a production device.
3.1 Adapteva’s Parallella
The Parallella board [19] was the first platform used to better understand the constraints of heterogeneous embedded systems. The tested version contained 16 generic coprocessors (called eCores). Because of its exotic architecture, valuable lessons were learned, and it allowed us to infer the minimal requirements to trace a heteroge-neous embedded system.
The core of the Parallella board is composed of a Zynq 70xx SoC containing a dual-core ARM Cortex A9 and an Artix-7 FPGA, an Epiphany chip (where the eCores are located) and 1 GB DDR memory. All coprocessors are little-endian, C-programmable, and best used as bare-metal units.
The Parallella’s limitations are very challenging, which forced us to explore different technical alternatives, and allowed us to tackle complex systems more easily. For instance, the communication mechanism between the master (ARM) and the slaves (coprocessors) is one way. This situation does not allow a slave to send any kinds
Fig. 2 High-level view of the devices of interest
of information to its master directly. Thus, the first min-imal requirement emerged: it is mandatory to dispose of (at least) a shared memory space to allow communication between the masters and the slaves. The very constrained memory space, the lack of interruptions queue, the absence of ordering for memory transactions and the lack of software components made the Parallella a fas-cinating device to experiment with, and from which we gained a better understanding of what issues one could have to tackle to trace a heterogeneous embedded system properly.
3.2 TI’s Keystone 2
Looking at TI’s Keystone 2, SoC is a logical next step, allowing us to test our tracing solution from scratch on a more complex and powerful device. This way, having addressed the issues of the weaker Parallella’s hardware, we dispose of a solid range of devices. Moreover, since the DSPs featured in this SoC are also present in many other systems, everything done for this platform will have much wider repercussions.
TI’s EVMK2H evaluation board features a 66AK2H12 SoC containing 4 ARM Cortex A15 and 8 TI’s C66 CorePacs DSPs [20]. It also provides 2-GB DDR memory and a faster 6-MB shared memory. This SoC is commonly used in industry and is thus a representative platform.
TI provides a set of C modules acting as a real-time micro-kernel that can be loaded on each and every DSP. This micro-kernel (named SYS/BIOS3) is capable of han-dling basic tasks, memory management and communica-tions between ARM and DSPs. Because it is lightweight and well-optimized, its usage is somehow standardized. Our main interest in this product is to see how it is possi-ble to instrument it, like the Linux kernel, to obtain traces at a lower level. For instance, tracing context switches between tasks would provide much information regarding
the global state of the system. Being able to trace the SYS/BIOS kernel, along with user-specific applications, would open the way to new opportunities such as critical path analysis [21].
No solution currently exists to trace the Keystone 2 platform, and the only tools provided are mostly target-ing profiltarget-ing. Those tools are in no way sufficient enough to compete with the benefits of tracing a device: more information with a lower performance impact.
Part of the challenge of tracing this platform is to eval-uate how a tool such as barectf can be integrated into TI’s micro-kernel, and how the provided communication mechanisms impact the way we see the master/slave rela-tionship. Since barectf has not yet been ported to this platform, Section 4 will explain how it can be done and provide some general guidelines regarding this process.
4 Bare-metal tracing with barectf
In this section, we will briefly present barectf and describe the procedure to implement it on a new plat-form. Barectf ’s traces’ output follows the CTF, which is a memory-wise efficient binary format. Bit-manipulating functions are needed to generate events in this format. For instance, it is perfectly acceptable to declare and trace a 3-bit integer. To ensure that a parser can read through such traces, a set of metadata, describing the content of each event, is required. Barectf handles the cre-ation of the trace’s metadata and all the bit-manipulating functions.
Barectf is a tool generating sets of C tracepoints. To do so, the user provides a configuration file written in YAML defining what are the required tracepoints (i.e., the description of the metadata): each tracepoint is given a name and a payload that can be anything from a single integer to a complex structure.
Fig. 3 High-level view of barectf’s workflow, extracted with permission from [14]
In order to use barectf with any device, one needs to implement a client-side API in charge of managing the packets generated by the tool. Packets are sets of events, initially recorded in a local buffer on each monitored core. They have a limited length and can thus only store a finite set of events. As such, they need to be handled when full, before recording new events. Therefore, because barectf is hardware-agnostic and thus does not provide those mech-anisms, one has to implement an API called a “barectf platform” on every newly studied platform (see Fig. 4).
While implementing these functions, a few things should be taken into consideration:
• The barectf_init function is in charge of allocating and instantiating the data structures holding the packets (either locally or on external memory). Those can be circular buffers, regular queues or even a single global variable holding one packet. However, some systems might not handle dynamic allocation very well (as it was the case for the Parallella board). Thus, particular care must be taken when
instantiating the structures.
• When implementing the barectf_get_ctx function, it is possible to allow multiple contexts to be created. In that case, no assumptions should be made about any preexisting checking mechanism, and potential coherency issues should be tested.
• The barectf_get_clock and barectf_init_clock functions should use a proper 64-bit counter. Usually, a cycle counter is used, and when not available, special care must be taken to ensure the coherency of
platforms (like the Parallella board) might only offer one 32-bit counter which can be reset after hitting its maximum value, in which case a custom-made counter should be incremented at each reset to simulate a 64-bit counter.
• The barectf_close_packet function is the core of the API, as it is in charge of handling a full packet. Such packet can be flushed into a shared memory space, directly sent to the master or even discarded because of lack of space. The choice is at the user’s discretion. For instance, the first implementation of the API on the Parallella copies the local packet into a shared memory location for the master to consume it. It requires proper initialization of the shared memory space and a custom protocol to retrieve the data. Our Keystone 2 implementation, however, uses TI’s MessageQ API4to directly send the packet to the master. This API allows the host to sleep on a semaphore’s lock while waiting for a packet to be received, thus eliminating the need to poll a shared memory space.
Obviously, every choice made on the slave regarding the handling of barectf packets should have its counterpart on the master, to ensure that the data can be retrieved and processed afterward. For instance, if the packets are written into a special memory location, the master should periodically poll this area and write new packets in a CTF file. In this case, extra care must be taken to ensure the coherency of the data read, since both the consumer and the producer might try to access the shared memory location at the same time.
5 Correlating heterogeneous traces
Being able to trace every component of a heterogeneous system separately is only the first step to trace its global state. Indeed, directly analyzing all the raw traces without processing them would be pointless, as different compo-nents most probably have different clock origins. Thereby, synchronizing the traces on the same (fictitious) time
origin is mandatory to preserve timestamps and cause-effect coherency.
5.1 Generating pairs of matching events
Synchronization can be achieved either “live” or as a post-tracing process. Since the monitoring process should minimally impact the system, we chose to use the second solution. For this to work, one needs to generate pairs of
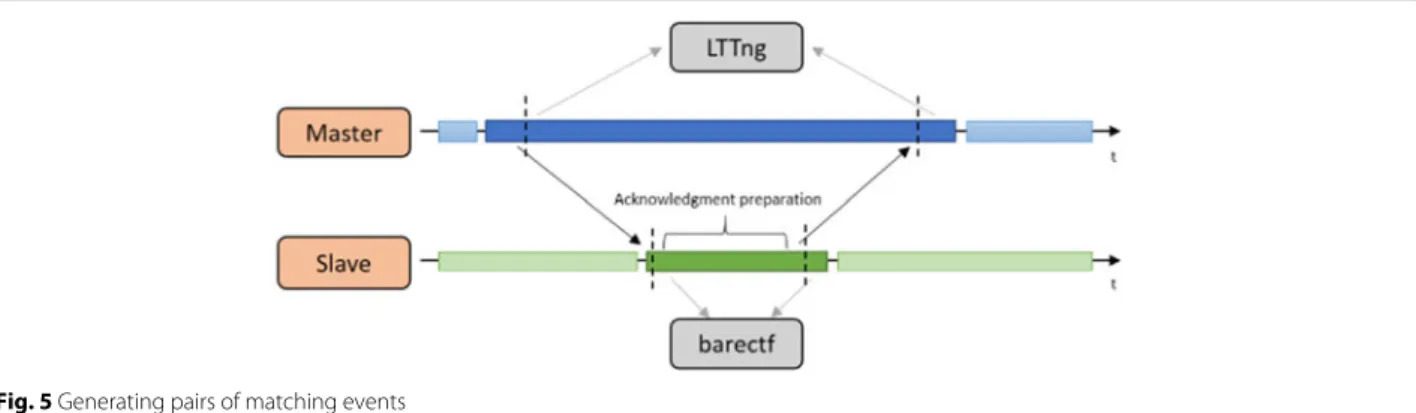
matching eventsduring the tracing session. Those events can be seen as a “handshake” between a master, which will be used as the synchronization origin, and a slave, for which the trace’s timestamps will be adjusted to match those of the master. This method is already well-used in distributed systems where the synchronization’s process uses TCP exchanges. The following process can be seen as the generalization of this mechanism (see Fig. 5):
1. The master generates its first matching event of sequence n and proceeds to ask for its counterpart on the slave to be generated.
2. Once the request is handled by the slave (which should happen as fast as possible to obtain results as accurate as possible), the second event (seen as an ACK ) of the first pair is generated on the slave (with sequence number n).
3. The slave then generates the first event of the second pair of sequence n+ 1 and notifies its master. 4. Once the master handles the notification, it
generates the second event of the second pair with sequence n+ 1, thus concluding the first exchange. Those events can later be processed, post-tracing, to compute the time conversion function to convert the timestamps in the slave’s traces to the master’s time refer-ence. Note that each pair needs to be uniquely identified during the post-tracing process, thus explaining the need for unique sequence ids.
In the next subsection, we propose a generic and effi-cient way to make the right interactions between a master and slave during the matching events’ generation process.
5.2 Workflow and synchronization
The below-described method aims at being hardware-agnostic and will work under these reasonable assump-tions:
(H1) The slaves can be interrupted by the masters (H2) A shared memory space is accessible by both the masters and the slaves.
To generalize our approach, we assume that the slaves are single-core processors and thus cannot handle multi-ple threads at a time. For this reason, (H1) ensures that there will always be a way for a master to halt a slave’s workflow and generate the synchronization events.
Since we cannot assume either that a proper communi-cation mechanism (such as a message passing interface) exists on every platform, (H2) allows data communi-cations and is available on almost every heterogeneous embedded platform.
As previously seen, generating pairs of matching events, across different traces, requires the master to send a request to the slave. This can be achieved by having the master trigger a hardware interrupt on the slave, thus forcing its workflow to be suspended in order to process the incoming interruption. Upon reception of the inter-ruption, the slave can write its ACK flag in the shared memory. In the meantime, the master would poll said memory and wait for the slave to complete.
To generate a set of matching events, a background task (referred as a synchronization daemon) can run on the master to periodically generate the interrupts and cor-responding events. The interruptions’ frequency needs to be adjusted so that the synchronization is accurate enough (enough matching events can be used) but does not significantly impact the system’s performance.
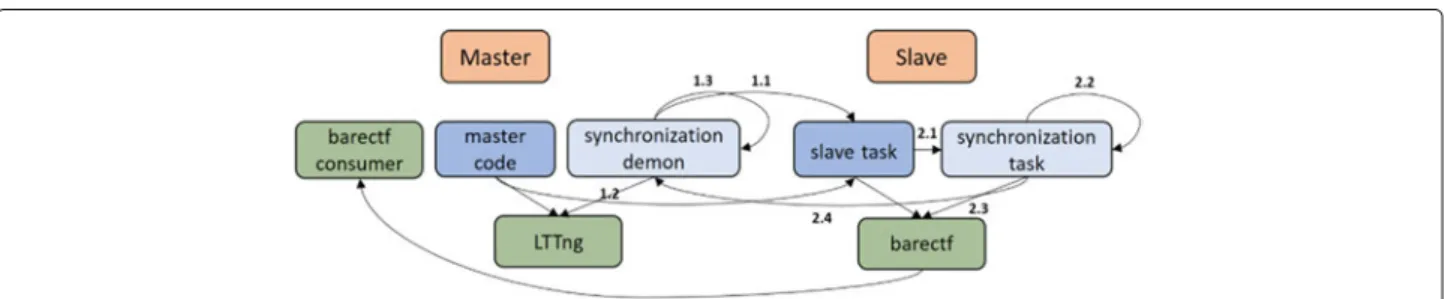
The global scheme of this generic process, for which the only requirements are (H1) and (H2), can be summarized by Fig. 6, where
1. The synchronization daemon (master’s side): 1.1 Interrupts the slave workflow to request
synchronization
1.2 Generates the first event of the first pair 1.3 Polls the shared memory location where the
ACKs are to be written by the slave 2. On the slave:
2.1 The interruption is handled and thus begins the synchronization task (which can be a real task or a function, in which case the next step does not apply)
2.2 The synchronization task is “awoken” from its waiting state
2.3 The second event of the first pair is then generated
2.4 The slave ends its synchronization task by writing the proper ACK flag in the shared memory space and consecutively generating the first event of the second pair
3. The synchronization daemon (master’s side):
3.1 Receives the ACK and leaves state 1.3 3.2 Generates the last matching event (same
transition as 1.2)
3.3 Stays on standby until the next periodic synchronization
This process could be tweaked in harmony with hardware-specific components for better results. For instance, the Keystone 2 platform allows the use of TI’s message passing API (MessageQ) to send the ACKs from the slave to the host, thus eliminating the need to con-stantly poll a shared memory location (the synchroniza-tion daemon can simply wait on a blocked semaphore for the ACK to arrive). Similarly, if the device of interest does not provide any shared memory space but handles local network packets, those could be used instead.
5.3 Post-analysis treatment
Once the pairs of matching events are created, a post-analysis process can handle the traces and proceed to the timestamps’ transformation.
The chosen method, whose efficiency is well proven, is based on the convex hull algorithm, as discussed in
[18] and [22]. It has been widely used to synchronize kernel traces using network packets among distributed systems. The pairs of matching events described here are the generic equivalent of those packets.
The convex hull algorithm’s goal is to find a suitable linear transformation of the slaves timestamps. The pairs of events are displayed on a 2D graph where each axis represents the timestamps of the events on one device. The upper-half (respectively lower-half ) of the hull is used to determine the conversion function with the maximum (respectively minimum) slope. Duda et al. [22] suggest to take the bisector of the angle formed by those two lines as the linear transformation.
Each part of the hull should contain a minimum of two points. Obviously, the more points there is, the better the approximation gets. However, in the case of tracing, the compromise is to have enough points while keeping the process from interfering too much with the system.
The TraceCompass5 trace visualization tool can eas-ily take a set of traces, compute the hull, and apply the corresponding linear transformation to each trace.
6 Results
6.1 Benchmarks—tracing overhead
Since tracing should be minimally intrusive (to avoid any “probe effect” and maintain good performance), some benchmarks were executed to evaluate the performance of our barectf implementation on the TI Keystone 2 and compare it to the preexisting one on the Parallella board. The barectf platform built for the Keystone 2 relies on the TI MessageQ API to send the packets from a slave to its master. This way, we take advantage of the built-in wait-ing queues, used for message passwait-ing, and do not have to worry about memory overlapping when writing packets. The Parallella’s implementation uses the shared memory space to store the packets.
The platforms configurations for the benchmarks are as follows:
• Keystone 2:
– 8 C66 CorePac DSPs running at 1.2 Ghz.
– barectf platform using MessageQ API. – barectf platform configured to allow at most
256 packets of 256 bytes each, at a time. – Compilation ensured by TI’s compiler with
-02 optimization option • Parallella:
– 16 eCores running at 1 GHz.
– barectf platform using shared memory. – barectf platform configured to allow at most
90 packets of 2048 bytes each, at a time. – Compilation ensured by a customized gcc
with -02 optimization option
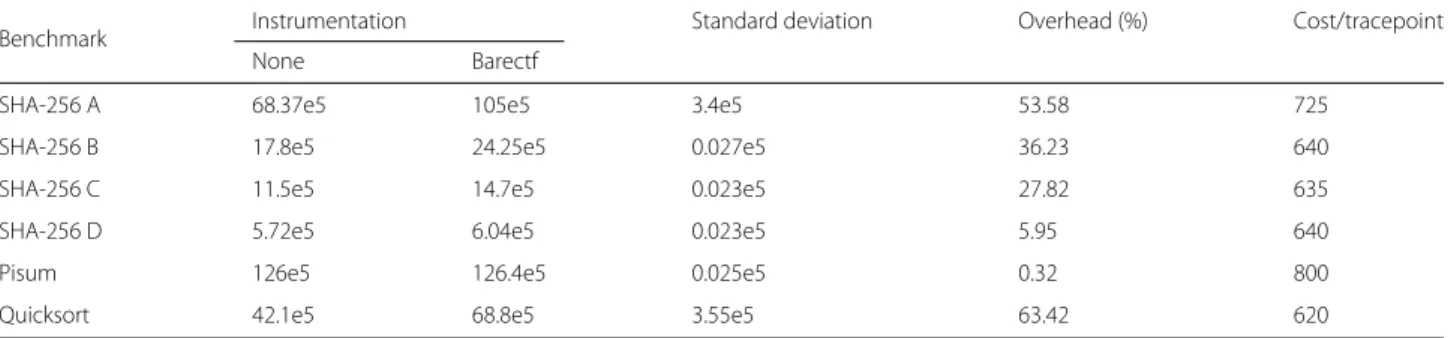
The results (given in cycles) are computed in Tables 1 and 2 and represented in Figs. 7 and 8. Six workloads were executed on each device. The first four compute the sha-256 hash of a set of strings. This set, composed of the 5040 permutations of the string “barectf,” is created while the benchmark is being executed. Those tests require heavy computations and simulate a generic demanding task. The two other tests are the computation of pisum6 and of a quicksort on an array containing 10,000 random integers.
• SHA-256 A: Computes the sha-256 hash of each permutation and produces a tracepoint for each result (5040). Note that the tracepoint is composed of a 32-bit integer and not of the 256-bit result, because directly tracing the result would require 4
(respectively 8) 64-bit integer (respectively 32-bit integer) tracepoints to be sent, thus artificially increasing the overhead.
• SHA-256 B: Computes the sha-256 hash and produces a tracepoint for every set of 5 permutations (1008).
• SHA-256 C: Computes the sha-256 hash and produces a tracepoint for every set of 10 permutations (504).
• SHA-256 D: Computes the sha-256 hash and produces a tracepoint for every set of 100 permutations (50).
Table 1 Benchmarking results (in cycles) on the TI Keystone 2
Benchmark Instrumentation Standard deviation Overhead (%) Cost/tracepoint
None Barectf
SHA-256 A 68.37e5 105e5 3.4e5 53.58 725
SHA-256 B 17.8e5 24.25e5 0.027e5 36.23 640
SHA-256 C 11.5e5 14.7e5 0.023e5 27.82 635
SHA-256 D 5.72e5 6.04e5 0.023e5 5.95 640
Pisum 126e5 126.4e5 0.025e5 0.32 800
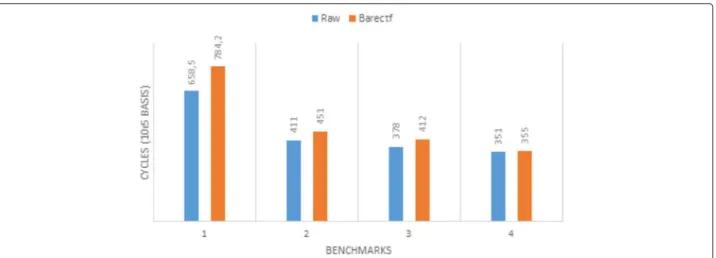
Table 2 Benchmarking results (in cycles) on the Parallella board
Benchmark Instrumentation Standard deviation Overhead (%) Cost/tracepoint
None Barectf
SHA-256 A 658.5e5 784.2e5 125.7e5 19.08 2500
SHA-256 B 411e5 451e5 41e5 9.73 3900
SHA-256 C 378e5 412e5 34e5 8.99 6700
SHA-256 D 351e5 355e5 4e5 1.14 8000
Pisum 196808e5 196820e5 2.48e5 0.006 24,000
• Pisum: Computes 50 iterations of the pisum and produces a tracepoint for each of them.
• Quicksort: Computes the quicksort of an array of 10,000 random integers and produces a tracepoint at each recursive call. Note that this test was too demanding to be directly reproduced on the Parallella board.
Each one of those operations was repeated 10,000 times, and the results presented in Tables 1 and 2 reflect the mean values of the metrics.
As expected, the measured overhead is directly pro-portional to the number of tracepoints triggered. On the Keystone 2, triggering 5040 tracepoints in less than 100 ms produces more than 50% overhead on the monitored application. However, the mean cost per tracepoint stays consistent for each test on this platform, indicating that there is no bottleneck induced by tracepoints. Even with a demanding workload, one should not expect big latency spikes brought by tracing. The built platform, even if not perfect, offers reasonable enough performance to use in a prototyping phase and eliminates the need for memory polling and checking for memory overlapping.
Sadly, the same inferences cannot be made about the Parallella board. Because the eCores are much less
powerful than TI’s DSPs, the overhead is somehow hidden behind the already huge time passed on the algorithms themselves. The cost per tracepoint is highly variable, and having fewer tracepoints will increase this inconsistency, as flushing a packet into the shared memory will take a very variable time, due to the hardware design of the board. Besides, since the shared memory space is accessed by both the consumers (the slaves) and the producers (the masters), a basic checking mechanism exists to ensure that they do not access the memory space at the same time, thus leading to additional waiting times on the slaves. This is particularly interesting to note, as instrumenting the Epiphany chip in this way could be prone to increase the so-called “probe effect,” where tracing the application affects its observed state. It is also interesting to notice that the very demanding pisum benchmark yields extreme results for the Parallella in contrast with the Keystone 2. This can be linked to the micro-architectural specifici-ties of the Epiphany chip and mostly to the absence of cache in the eCores. In fact, the pisum benchmark relies on operations on a single variable and can thus easily take advantage of TI’s DSPs cache. The eCores are also far less powerful than the DSPs in terms of raw performances, so it is likely that they have been pushed too much in this case.
Fig. 8 Barectf instrumentation influence on Parallella
Tracing performance heavily relies on the device per-formance itself and the barectf local implementation. As underlined by the Keystone 2 performance, it can be very efficient and could even be used with care in produc-tion. Moreover, even though the Parallella’s performance is modest, and the probe effect may be substantial because of the board architecture, tracing is nevertheless possible and could be useful in a lot of common use-cases such as regular logging or casual monitoring.
Since most of the commodity hardware use a setup similar as the Keystone 2, our approach should behave the same on a majority of devices and in particular with any TI’s DSPs-based platform. Tracing should also be expected to work, albeit with limited performance, on more exotic minimalistic devices such as the Parallella board.
6.2 Use-case
In order to demonstrate how the described tracing solu-tion would perform with a real-life problem, we chose to instrument an image processing algorithm running on TI’s C66x CorePacs DSPs (on the Keystone 2).
The algorithm uses Sobel’s filter to perform edges detec-tion on an input image. Since TI provides it as part of the board’s SDK, this use-case should be easily reproducible.
Sobel’s filter computes an intensity gradient for each pixel in the image, detecting brutal changes in lighting and their direction, which might point towards an edge. Even though this method is rudimentary, the mathemati-cal operations performed still benefit from the dedicated image processing APIs available on TI’s DSPs.
The global application goes through three steps:
1. A program running on the master (ARM) is waiting for the user to interactively provide an image to process.
2. Then, the master parses the image and sends some memory allocation requests to the “leader” DSP (DSP #0).
3. Finally, the image is cut into eight pieces, each piece being sent to a different DSP in the previously allocated memory spaces, and the DSPs reply back with their share of the processed image.
Communication between master (ARM) and slaves (DSPs) is achieved through TI’s MessageQ API, which relies, as its name suggests, on messages queues. The master opens a single queue, to which each slave will be connected, and every slave opens its queue, to receive orders from the master. This API is quite high-level and adds more latency than basic shared-memory communi-cation. However, it is less error-prone and allows a core to switch tasks when awaiting a message, as it will wait for a semaphore to be unlocked. It also eliminates the need to poll a shared memory space and waste CPU cycles waiting for data to arrive. Of course, in the context of a high-performance application where a slave should per-form one task only, using the shared memory would be a better solution.
Tracing a system must be done with a goal in mind. Since tracepoints can be placed anywhere in the appli-cation, tracing can serve a lot of different purposes. For instance, one might want to place tracepoints at strate-gic places to check when the application reaches them, thus using them as checkpoints. It also can be utilized for debugging and/or monitoring purposes.
In our case, tracing was employed to monitor our sys-tem by adding tracepoints at the beginning and end of every important function call. This way, the application’s weakest link can easily be found by measuring the elapsed execution time of each function and following the calls leading to it (including calls induced by remote cores).
TI’s SYS/BIOS micro-kernel was also instrumented (through the use of well-placed hooks in the APIs) so that task management and communications (among others) can be observed. This way, the generated traces also hold information regarding the tasks running on a DSP. Each DSP being single-core, they can only perform one task at a time.
Note that every added tracepoint contains a useful pay-load. For instance, in the case of the message passing API instrumentation, receiving or emitting queues are described, along with the message’s size.
In summary, the procedure is as follows:
• Add tracepoints at the beginning and end of every “useful” functions.
• Thanks to hooks, add tracepoints inside critical APIs functions, such as message passing or tasks
management functions.
Moreover, the underlying objectives are to • Monitor the whole system.
• Spot and understand abnormal latency. • Analyze dependencies between cores.
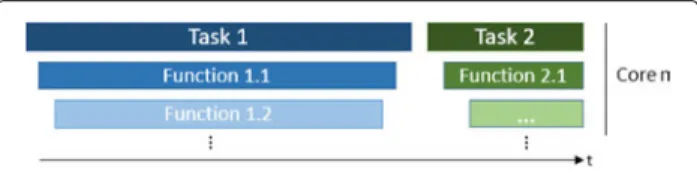
The instrumentation allows us to compute a partial call stack view in a CTF trace viewer such as TraceCompass. The following screenshots come from this software. The trace view is described in Fig. 9:
Figure 10 shows the global view of our system, from the beginning of the application to its end. Note that, for dis-play purposes, only the four first processes (the master and the first three slaves) are shown.
This figure confirms that the synchronization is working since the DSPs are all entering the main task (displayed in dark blue) approximately at the same time, i.e., when they each receive a command from the master. Without trace synchronization, some processes might appear well ahead or behind others, and any cause/effect relationship would be lost.
As highlighted, recognizing the different parts of the workflow is easy: as long as the DSPs are in the “idle” task, they are waiting for their master’s input. If the master is not doing anything, it means that it is itself waiting for user input.
Zooming on the beginning of the main task shows the main function, which actually processes a part of the
Fig. 9 Description of the callstack view of processes
image, and allows one to see how long it took (see Fig. 11). In this case, the average processing time was around 96 ms.
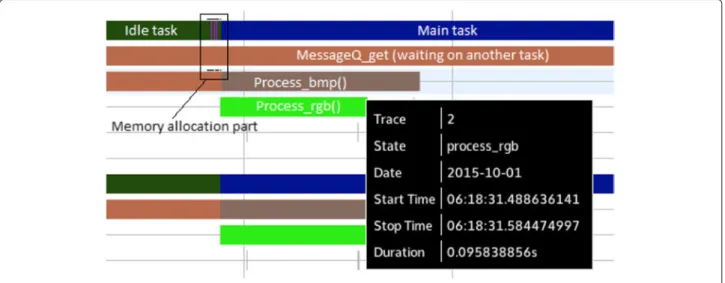
The memory allocation part better shows how the inter-action between two distinct cores can be easily distin-guished. Figure 12 displays this situation.
When tracing an entire heterogeneous system, the aim is to understand the global workflow of the sys-tem and the different interactions between its compo-nents, which cannot be achieved when looking at each of them separately. Figure 12 demonstrates how the depen-dencies between two heterogeneous cores can be eas-ily exposed, as a master and its slave are continuously waiting for each other. The back and forth exchanges presented here are characteristic of two-way communi-cations between a slave and its master. By reading the states, one can see that an exchange is structured as follows:
1. The master sends a message (a memory allocation command) to the slave and then waits for an answer. 2. The slave receives the message and allocates some
memory accordingly.
3. The slave finally sends back the information on said memory to its master.
During a normal execution, this step is followed by the actual processing of the image, as shown in Fig. 11.
We now examine a more problematic context where another high-priority task is awoken during the actual image processing. Because of its high priority, this task will run to completion before the main task can be resumed. Without tracing, this problem would only be seen at the end, where the total processing time would jump from an average 96 to 300 ms. Finding the cause of this abnormal latency would be quite difficult, even with the help of a profiling tool, as long as the slaves and the masters are examined separately and not as a whole.
However, thanks to our instrumentation, one simple look at the main task section of the trace would reveal that another task actually preempts DSPs 1 and 2, and issues communications between the two. Once the messages exchange is over, they return to the main task, allowing the master to finally get all the results. As can be seen, other DSPs are not disturbed by this task. Only the master is also impacted, as it is waiting for every slave to send back their share of the processed image. Figure 13 displays this situation.
6.3 Discussion
Thanks to the information gathered through tracing, we discovered that another task might preempt our image processing task. As such, one might try (if possible) to protect the image processing task from being preempted,
Fig. 10 Global view of the application
or ensure that the conditions triggering the other task are only met once the image processing function is finished.
Detecting the previous problem as easily would not have been possible without the help of traces. Even though this issue was artificially created for demonstration pur-poses, it is fairly representative of problems encountered in real systems. It thus demonstrates that system moni-toring through tracing on a heterogeneous device is both possible and useful.
Other common problems, such as communication faults, could also have easily been detected and corrected with our method. For instance, one could have seen that one DSP was hanging in a task, waiting for a message
to arrive, while its correspondent crashed or was itself hanging on a different task.
Finally, instrumenting TI’s SYS/BIOS micro-kernel is a step towards spreading tracing mechanisms to various platforms, as it can be used on a broad variety of TI’s products.
7 Conclusions
Tracing heterogeneous embedded systems, in a generic way, is now possible, regardless of hardware specifici-ties and existing APIs, under the reasonable assumptions that the slaves can be interrupted (H1) and that there is (at least) a shared memory space on the device (H2) to communicate. We thus filled a gap regarding the state of
Fig. 12 Zoom on the memory allocation part
tracing on heterogeneous embedded systems and brought it closer to the common methods and solutions existing for regular systems.
Bringing standard formats and tools to these new devices could help developers to easily adapt tracing methods to virtually any platform, thus allowing them to use multi-platform tools, avoiding the reliance on propri-etary or limited, single-platform tools. This would also enable quick comparisons, with the same tools, of the same application running on different platforms, for per-formance and behavioral analysis purposes.
We are confident that the work done on the Parallella board, a very limited platform with strong constraints, and the Keystone 2 platform, which is closer to the indus-try’s standards, reflects the possibilities of what can be achieved on a wide range of heterogeneous embedded sys-tems. This opens the way for even more opportunities, such as critical path analysis in a heterogeneous envi-ronment. In particular, we showed how a custom-made micro-kernel could be instrumented to obtain the same
kind of information readily available on a Linux-based device.
Even though the generic method described to obtain correlated traces on such devices appears fairly satisfying, local implementations of barectf platforms could slightly influence the tracing’s impact. For instance, due to its sim-ple design, the Parallella board offers very inconsistent performance when traced, whereas tracing’s impact on the Keystone 2 is more predictable and consistent. Moreover, barectf is still a work in progress and will surely see its features enhanced in the near future.
Trace visualization is also worthy of further work. The proposed call stack view will not easily scale to more than a few cores. A new approach will be required to visually examine systems with more than a few dozen cores.
Furthermore, it would be interesting to investigate the optimal frequency to generate synchronization points, as a compromise between performance overhead and syn-chronization accuracy. In theory, only two points in each hull are required to achieve a basic synchronization, but
having more points brings more accuracy at the cost of more overhead.
Finally, we would like to see if trace synchronization can be directly achieved by matching regular message exchanges, without requiring an external synchronization process that adds time-consuming messages exchanges, just like we can synchronize traces by looking at exist-ing TCP exchanges. Although this approach would lose its generality, the overall performance would be slightly improved. Endnotes 1https://github.com/efficios/barectf 2http://lttng.org/ 3http://www.ti.com/tool/sysbios 4http://processors.wiki.ti.com/index.php/IPC_Users_ Guide/MessageQ_Module 5http://tracecompass.org/ 6https://github.com/JuliaLang/julia/tree/master/test/ perf/micro Abbreviations
API: Application programming interface; ARM: Advanced RISC machines; C66x: Texas instrument CorePacs DSPs; CPU: Central processing unit; CTF: Common trace format; DSP: Digital signal processor; GDB: The GNU project debugger; HLOS: High-level operating system; IPC: InterProcess communication; LTTng: Linux trace toolkit next generation; RISC: Reduced instruction set computer; RTSC: Real-time software components; SDK: Software development kit; TI: Texas instruments
Acknowledgements
The authors would like to thank Geneviève Bastien, Francis Giraldeau, Philippe Proulx, and Suchakrapani Sharma for their advices and help during the implementation of the presented solution.
Funding
This research was funded by CRSNG, Prompt, Ericsson, and EfficiOS.
Competing interests
The authors declare that they have no competing interests. Received: 19 July 2016 Accepted: 27 December 2016
References
1. M Durrant, J Dionne, M Leslie, in Ottawa Linux Symposium. Running Linux on a DSP? Exploiting the computational resources of a programmable DSP micro-processor with uClinux, (2002), pp. 130–145. https://www. kernel.org/doc/mirror/ols2002.pdf#page=130
2. TM Conte, PK Dubey, MD Jennings, RB Lee, A Peleg, S Rathnam, M Schlansker, P Song, A Wolfe, Challenges to combining general-purpose and multimedia processors. Computer. 30(12), 33–37 (1997). doi:10.1109/2.642799
3. A Haidar, C Cao, A Yarkhan, P Luszczek, S Tomov, K Kabir, J Dongarra, in
Parallel and Distributed Processing Symposium, 2014 IEEE 28th International.
Unified development for mixed multi-GPU and multi-coprocessor environments using a lightweight runtime environment (IEEE, 2014), pp. 491–500. doi:10.1109/IPDPS.2014.58
4. L Lamport, On interprocess communication. Distributed Computing. 1(2), 86–101 (1986). doi:10.1007/BF01786228
5. AS Tanenbaum, Distributed systems, (2007). http://cds.cern.ch/record/ 1056310/files/0132392275_TOC.pdf
6. S Shende, in Proceedings of the Extreme Linux Workshop. Profiling and tracing in Linux, vol. 2 (Citeseer, 1999). http://www.cs.uoregon.edu/ research/paraducks/papers/linux99.pdf
7. A Bechini, CA Prete, Behavior investigation of concurrent Java programs: an approach based on source-code instrumentation. Futur. Gener. Comput. Syst. 18(2), 307–316 (2001). doi:10.1016/S0167-739X(00)00095-9 8. D Toupin, Using tracing to diagnose or monitor systems. IEEE Software.
28(1), 87–91 (2011). doi:10.1109/MS.2011.20
9. J Gait, A probe effect in concurrent programs. Software: Practice and Experience. 16(3), 225–233 (1986). doi:10.1002/spe.4380160304 10. M Desnoyers, M R. Dagenais, The LTTng tracer: a low impact performance
and behavior monitor for GNU/Linux. Proc. Linux Symp. 1, 209–224 (2006). doi:10.1.1.108.547 Citeseer
11. P-M Fournier, M Desnoyers, M R. Dagenais, Combined tracing of the kernel and applications with LTTng. Proc. Linux Symp, 87–94 (2009). doi:10.1.1.641.196 Citeseer
12. M Desnoyers, M Dagenais, in Embedded Linux Conference. Deploying LTTng on exotic embedded architectures, vol. 2009, (2009). http:// citeseerx.ist.psu.edu/viewdoc/download?doi=10.1.1.641.1965&rep= rep1&type=pdf#page=87
13. P Proulx, Tracing bare-metal systems: a multi-core story - LTTng. https:// lttng.org/blog/2014/11/25/tracing-bare-metal-systems/
14. P Proulx, Barectf2: Continuous bare-betal tracing on the Parallella board—LTTng. http://lttng.org/blog/2015/07/21/barectf-2/
15. D Couturier, MR Dagenais, LTTng CLUST: a system-wide unified CPU and GPU tracing tool for OpenCL applications. Adv. Softw. Eng. 2015, 1–14 (2015). doi:10.1155/2015/940628
16. L Lamport, Time, clocks, and the ordering of events in a distributed system. Commun. ACM. 21(7), 558–565 (1978). doi:10.1145/359545.359563 17. M Jabbarifar, On line trace synchronization for large scale distributed systems.
(ProQuest, UMI Dissertations Publishing, 2013). http://search.proquest. com/docview/1561560787
18. B Poirier, R Roy, M Dagenais, Accurate offline synchronization of distributed traces using kernel-level events. ACM SIGOPS Oper. Syst. Rev.
44(3), 75–87 (2010)
19. Adapteva, Parallella -1.× reference manual (Rev. 14.09.09) (2014). http:// www.parallella.org/docs/parallella_manual.pdf. Accessed 09 Sept 2014 20. T Instruments, 66ak2h14/12/06 multicore dsp+ arm keystone ii
systemon-chip (soc). Texas Instruments, SPRS866E (2013). http://www.ti. com/lit/ds/symlink/66ak2h12.pdf
21. F Giraldeau, M Dagenais, Wait analysis of distributed systems using kernel tracing. IEEE Trans Parallel Distrib. Syst. PP(99) (2015).
doi:10.1109/TPDS.2015.248862
22. A Duda, G Harrus, Y Haddad, G Bernard, in 7th International Conference on
Distributed Computing Systems (ICDCS’87). Estimating global time in
distributed systems, (Berlin, 1987), pp. 299–306
Submit your manuscript to a
journal and benefi t from:
7 Convenient online submission 7 Rigorous peer review
7 Immediate publication on acceptance 7 Open access: articles freely available online 7 High visibility within the fi eld
7 Retaining the copyright to your article
![Fig. 3 High-level view of barectf’s workflow, extracted with permission from [14]](https://thumb-eu.123doks.com/thumbv2/123doknet/8198080.275365/6.892.88.812.126.489/fig-high-level-view-barectf-workflow-extracted-permission.webp)

![[PDF] Cours complet d ADO.NET methodes et pratique | Formation informatique](data:image/gif;base64,R0lGODlhAQABAIAAAP///wAAACH5BAEAAAAALAAAAAABAAEAAAICRAEAOw==)