HAL Id: hal-00616687
https://hal.archives-ouvertes.fr/hal-00616687v3
Submitted on 26 Aug 2011
HAL is a multi-disciplinary open access
archive for the deposit and dissemination of
sci-entific research documents, whether they are
pub-lished or not. The documents may come from
teaching and research institutions in France or
abroad, or from public or private research centers.
L’archive ouverte pluridisciplinaire HAL, est
destinée au dépôt et à la diffusion de documents
scientifiques de niveau recherche, publiés ou non,
émanant des établissements d’enseignement et de
recherche français ou étrangers, des laboratoires
publics ou privés.
Subjective quality assessment of error concealment
strategies for 3DTV in the presence of asymmetric
transmission errors
Marcus Barkowsky, Kun Wang, Romain Cousseau, Kjell Brunnström, Roger
Olsson, Patrick Le Callet
To cite this version:
Marcus Barkowsky, Kun Wang, Romain Cousseau, Kjell Brunnström, Roger Olsson, et al.. Subjective
quality assessment of error concealment strategies for 3DTV in the presence of asymmetric
transmis-sion errors. 18th International Packet Video Workshop (PV), 2010, Dec 2010, Hong Kong SAR China.
pp.193 - 200, �10.1109/PV.2010.5706838�. �hal-00616687v3�
SUBJECTIVE QUALITY ASSESSMENT OF ERROR CONCEALMENT STRATEGIES FOR
3DTV IN THE PRESENCE OF ASYMMETRIC TRANSMISSION ERRORS
Marcus
Barkowsky
1, Kun Wang
2,3, Romain Cousseau
1, Kjell Brunnström
2, Roger Olsson
3, Patrick Le Callet
11 Dept. of Image and Video Communication, IRCCyN, University of Nantes,France; Email: Firstname.Lastname@univ-nantes.fr
2 Dept. of Netlab, Acreo AB, Sweden; Email: Firstname.Lastnamewithoutdots@acreo.se
3 Dept. of Information Technology and Media (ITM), Mid Sweden University, Sweden; Email: Firstname.Lastname@miun.se
ABSTRACT
The transmission of 3DTV sequences over packet based networks may result in degradations of the video quality due to packet loss. In the conventional 2D case, several different strategies are known for extrapolating the missing information and thus concealing the error. In 3D however, the residual error after concealment of one view might leads to binocular rivalry with the correctly received second view. In this paper, three simple alternatives are presented: frame freezing, a reduced playback speed, and displaying only a single view for both eyes, thus effectively switching to 2D presentation. In a subjective experiment the performance in terms of quality of experience of the three methods is evaluated for different packet loss scenarios. Error-free encoded videos at different bit rates have been included as anchor conditions. The subjective experiment method contains special precautions for measuring the Quality of Experience (QoE) for 3D content and also contains an indicator for visual discomfort. The results indicate that switching to 2D is currently the best choice but difficulties with visual discomfort should be expected even for this method.
Index Terms— subjective experiment, packet loss,
video quality, visual discomfort
1. INTRODUCTION
Inspired by the rapidly increasing popularity of 3D movies, 3D services are becoming popular for the home environment as well. There are many alternative technologies for the representation of 3D video content, for example, multi-view, depth plus 2D, volumetric, and holographic but at the moment the stereoscopic presentation with glasses seems to be the most mature technology and it is available on traditional terrestrial cable, satellite, IPTV services, as well as hardcopy media i.e Blu-ray disk.
Likewise, a wide variety of transmission channels is currently available for broadcasting, ranging from satellite and terrestrial transmission to mobile channels. However, for the home environment, the channels currently used for
IPTV seem most appropriate for 3D services in HDTV quality.
For encoding a stereoscopic video, several different possibilities exist, for example, Multiview Video Coding (MVC) [1]. Although MVC has a higher coding efficiency as it exploits the inherent redundancy of the left and the right view by inter-view prediction, in this paper, the simultaneous broadcast of the left and right view in H.264/AVC is favored for sake of simplicity and availability of well-known tools. These tools include packet loss tools and the state-of-the-art error concealment strategy implemented in the JM reference decoder [2]. It is also very likely that simulcast is the preferred broadcasting method initially, since it allows the broadcaster to use most of its 2D infrastructure even for 3D.
Several publications discuss the influence of transmission distortions on the quality of experience in the 2D case [3, 4, 5]. In the 3D case, a transmission distortion in one view or in both views is perceived differently. A degradation in one view or a temporal misalignment between the left and the right view leads to binocular rivalry. This binocular rivalry strongly degrades the quality of experience as it exhibits visual discomfort which might lead to headache or nausea [6]. Therefore, in this paper, the preference of the observers to several different error concealment strategies is reinvestigated for the 3D case.
In order to compare the influence of the error concealment strategies to the impact of coding artifacts, several coding-only conditions are included in the subjective experiment. The subjective experiment uses a combination of the Double Stimulus Continuous Quality Scale (DSCQS) as specified in ITU-R BT.500 [7] and the Absolute Category Rating (ACR) as specified in ITU-T P.910 [8]. DSCQS is used for training the subjects to calibrate their expectations for displaying 3D video content while ACR is used in the subjective experiment itself as more conditions can be judged. In addition to answering on a general five point ACR scale, the subjects were asked to indicate visual discomfort with a binary choice.
This paper is organized as follows. In Sec. 2, the tested coding and transmission scenarios are detailed. The subjective experiment is described in detail in Sec. 3 and in Sec. 4, the results are presented and discussed in detail in Sec. 5, before concluding the work in Sec. 6.
2. CODING AND TRANSMISSION SCENARIO 2.1 Source Material
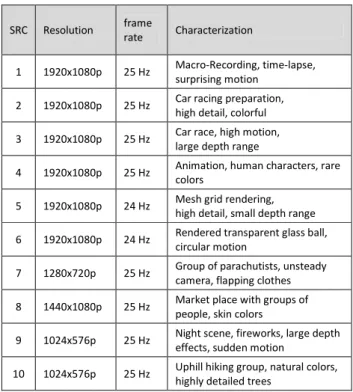
In total, 10 source stereoscopic video sequences (SRC) were extracted out of 7 different longer video clips for the subjective experiment. Each SRC is about 10 seconds long and has a higher resolution than SDTV, covered from low motion and low detail through high motion and high detail content. The scenes are summarized in Table 1.
Table 1. Source video sequences
SRC Resolution frame
rate Characterization
1 1920x1080p 25 Hz Macro-Recording, time-lapse, surprising motion
2 1920x1080p 25 Hz Car racing preparation, high detail, colorful 3 1920x1080p 25 Hz Car race, high motion,
large depth range
4 1920x1080p 25 Hz Animation, human characters, rare colors
5 1920x1080p 24 Hz Mesh grid rendering, high detail, small depth range 6 1920x1080p 24 Hz Rendered transparent glass ball,
circular motion
7 1280x720p 25 Hz Group of parachutists, unsteady camera, flapping clothes 8 1440x1080p 25 Hz Market place with groups of
people, skin colors
9 1024x576p 25 Hz Night scene, fireworks, large depth effects, sudden motion
10 1024x576p 25 Hz Uphill hiking group, natural colors, highly detailed trees
2.1 Encoding and transmission
Several different scenarios, called Hypothetical Reference Circuits (HRC) according to the terminology of the Video Quality Experts Group (VQEG) [9] were used in creating the Processed Video Sequences (PVS). The SRCs are transformed into PVS according to Figure 1.
The H.264/AVC video encoder in its reference implementation JM 17.0 was used to create the sequences. Realistic parameters for slightly error-prone channels were selected by having one slice extending one line of macroblocks and inserting an Immediate Decoder Refresh (IDR) picture each 25 frames. Both settings limit the error propagation while not severely reducing the coding efficiency.
AVC Encoding
PVS
SRC Network simulation
(optional packet losses)
AVC Decoding 3D error concealment (optional) Adaptation to display Subjective Experiment
Figure 1: Setup of encoding, transmission and processing steps in order to generate the PVS
Table 2 lists all HRC conditions. In order to cover the range of typical coding qualities, in HRC1-4 the quantization parameter (QP) was varied from 26 to 44 with a stepsize of six. Incrementing the QP by six, doubles the quantization stepsize of the linear quantizer for the Discrete Cosine Transform (DCT) coefficients in the H.264 encoder. This also approximately halves the bitrate. Further information can be found in [10]. Please note that the bitrate at the same QP depends on the properties of the SRC. This approach was preferred to choosing fixed bitrate as it helps to cover the full range of QoE for each SRC.
Table 2: List of processing conditions (HRC)
HRC Nr. H.264 QP Packet Loss Type Error concealment HRC Group 0 1 26 None - 2 32 None - 3 38 None - 4 44 None - 5 26 Short duration, 1% A 1 6 26 Short duration, 1% B 1 7 26 Short duration, 1% C 1 8 26 Short duration, 1% D 1 9 26 Short duration, 5.9% A 2 10 26 Short duration, 5.9% B 2 11 26 Short duration, 5.9% C 2 12 26 Short duration, 5.9% D 2 13 26 Long duration, 1% A 1 14 26 Long duration, 1% B 1 15 26 Long duration, 1% C 1 16 26 Long duration, 1% D 1 17 32 Short duration, 1% B 2 18 38 Short duration, 1% B 2 19 2D presentation
Transmission errors were introduced by using an improved version of the RTP packet loss simulator “rtp_loss” provided by the Joint Video Team (JVT) in their reference software package. Only one of the two views was distorted in each HRC.
In order to avoid obvious patterns for the choice of the degraded view, the PVS were split in two groups as indicated by the rightmost column of Table 2. For group 1, the left view was distorted for all odd SRC and the right
view was distorted for all even SRC. The inverse applies to group 2.
The transmission errors are grouped as follows. A “short” duration means that the bitstream is only degraded from 39% to 58% while a “long” degradation indicates that the packets are lost in between 10% and 70% of the 10 seconds PVS. This placement ensured that the scene cut at the beginning and end of the scene would not visually mask transmission error artifacts. The parameters were chosen similar to a previous publication in order to allow comparisons to the 2D case [11]. The percentage values were adapted in order to keep the same visual impairment in the sequences of 10 seconds as was previously seen in the sequences of 14 seconds.
Most of the transmission error scenarios are based on encoding at the highest evaluated video quality with a QP equal to 26. This allows for a large footroom for evaluating the quality of the introduced transmission artifacts. However, in order to learn about the relationship between quantization artifacts and transmission errors, HRC17 and HRC18 were included with the smallest transmission error impairment but a QP of 32 and 38. All bitstreams were decoded using JM15.1 as the more recent versions of the JM decoder were found to be incapable of decoding the error impaired bitstreams.
Four different error concealment strategies were applied. Error concealment strategy “A” consists of directly playing back the decoded video. This should be considered the most computationally intensive algorithm as it involves the sophisticated error concealment implemented in the H.264 software which uses spatial and spatial-temporal interpolation depending on the frame type. However, in the 3D case, only a single view is distorted and thus binocular rivalry may occur as the error concealment artifacts are visible only in one view.
Error concealment strategy “B” implements a switching to a 2D presentation when an error occurs in one view. As the other view is undistorted in our setup, this undistorted view is displayed to both eyes thus leading to a 2D impression without disparity.
In error concealment strategy “C”, the last frame that was correctly received for both views is displayed while the effects of the transmission errors are affecting one view. Thus, the observer watches a video which pauses for a certain time, showing a 3D still image of the last correctly received frame and then the scene suddenly skips to the next correctly received 3D frame and continues playing.
The fourth error concealment strategy “D” is very similar to “C” but instead of stopping the video completely, it is assumed that a buffer of video frames exists which contains half a second of decoded content, corresponding to 12 frames in our experiment. These 12 frames are slowly
played back during the recovery time of the decoder. As the exact time of the recovery is not known, the frames are played back with an exponentially increasing delay such as the last frame is displayed after 37 frames. The observer would thus see that the playback slows down, skips and then continues at normal speed.
As no error concealment would be necessary in the decoder, the methods “B”, “C”, and “D” are less computationally expensive than method “A”.
3. SUBJECTIVE EXPERIMENT
The PVS set was evaluated in a subjective experiment performed at the University of Nantes, France. The PVS set was presented to the observers on a 23” Alienware Optx LCD display (120Hz, resolution 1920x1080p). The display uses active shutter glasses from the Nvidia 3D vision system. The maximum crossed and uncrossed disparity of each SRC sequence was manually determined in order to assure displaying in the comfortable viewing zone [12]. Those objects that clearly belonged to pop-out effects were ignored. It was decided to use a viewing distance of 3 times the display height which is the same value used in the VQEG HDTV testplan[5]. The lab environments adhere to the lab setup defined in the recommendation ITU-R BT.500-11 [9]. The display was positioned far enough from the wall to avoid any conflicts of the displayed 3D content with the real world. The room illumination was adjusted in such a way that, through the activated shutter-glasses, the luminance reflected from the background is 15% of the display's peak luminance; this corresponded to 50cd/m2 without glasses. No flickering of the background light was perceived. The video sequences were displayed in uncompressed format in order to make sure that all observers were given the same presentation of the same video sequence. In order to assure that no temporal distortion was introduced by the player, the videos were preloaded into the computer’s Random Access Memory (RAM) and special care was taken that the playout of twice the Full-HD resolution was performed without temporal jitter.
The subjective experiments were preceded by a training session. The DSCQS method was used for the training session in order to make the observers become accustomed to the PVSs, their characteristics, and the range of distortion that could be expected in the experiment itself. In the DSCQS method, the sequences are presented in pairs. In our case, the observer saw a degraded sequence and its corresponding unimpaired reference sequence in random order. The videos are shown to the observers sequentially with one repetition and divided by a short gray sequence, e.g. PVS, REF, PVS, REF or REF, PVS, REF, PVS. The observers score on a 0-100 scale with two sliders displayed on the screen. The DSCQS method is very time consuming,
in our case about 50 seconds for each trial. On the other hand, it allows the observers to compare in detail the quality degradation, therefore rendering it suitable for the training session.
For the rating session, a single stimulus method is preferable. In our experiment, the “absolute category rating with hidden reference” (ACR-HR) method was used. The observers were instructed to vote on a quality of experience scale with the training session in mind. The PVSs are presented in random order and they are rated independently on a category scale corresponding to the ITU five-point quality scale (excellent, good, fair, poor, and bad1, which are later mapped to the scores 5, 4, 3, 2, and 1 respectively). An interactive test setup was used, the next presentation followed immediately after an observer validated his vote. As some of the PVS exhibit binocular rivalry, visual discomfort may be perceived by the subjects. As visual discomfort is difficult to quantify for an untrained observer, a simple checkbox was integrated in the graphical user interface in order to get a binary decision. The average time for visualization and rating of a single PVS and preloading the next sequence is about 16 seconds, thus about one third of the time needed for DSCQS.
The subjective experiment contained a total of 200 videos: 10 references and 190 impaired sequences which were presented in semi-random order. Prior to the subjective experiment, the observers were screened for visual acuity using a Snellen Chart, color blindness using Ishihara Plates and stereoscopic acuity using a Randot Stereo test. From the original 30 naïve observers, 2 were rejected in the stereoscopic acuity testing. Thus, 28 observers participated in the experiments which took place in two sessions of approximately 50 minutes each with pauses after about 15 minutes of viewing time. After the subjective experiments, the observer’s votes were screened according to ITU-R BT.500 and the VQEG HDTV testplan and no observers were rejected.
4. RESULTS
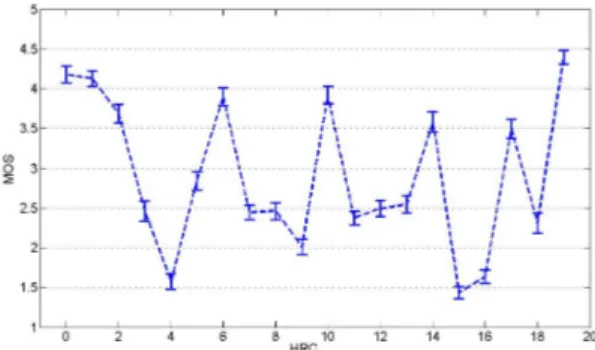
The Mean Opinion Scores (MOS) were calculated, which is an average of the numerical values that were assigned to the attributes of the ACR scale as described previously. Figure 2 displays the MOS over all observers and SRCs partitioned by 20 HRCs. The 95% confidence interval is shown in the diagram. The distribution of votes on the different categories in the complete test is approximately equal so the subjective experiment appears to be balanced. Regarding the evaluation of error concealment strategies for the videos with transmission errors, we can see that the error concealment method B (switch to 2D mode when an error occurs) used in
1
The scale was presented in the observers’ native language (French)
the HRC number 6, 10, and 14, is significantly preferred to all other methods in all 3 error categories (1% packet loss for short duration, 5.9% for short duration and 1% for long duration). The MOS value of HRC6 and HRC10 is still voted as “good”. The standard error concealment method of the H.264 decoder (version A), used in HCR number 5, 9 and 13, is preferred compared to the versions C (HCR 7, 11 and 15) and D (HCR 8, 12 and 16), when the percentage of errors is low (1% in both short and long duration). However, for a high percentage of packet loss of 5.9%, it becomes the opposite, where concealment case A (HRC9) is rated lowest. There is no statistical significant difference between the method C and D except for a slight preference (HRC 16 compare to HRC15) for the D in the case of long distributed errors, indicating that “freezing” is even more annoying than slow motion.
Figure 2: Mean value of the MOS of all SRCs per HRC
As shown in [11] for 2D, widely spread transmission errors were voted as being more disturbing than transmission errors occurring in bursts. This is corroborated in the 3D case. Among the 3 different categories of transmission errors, the MOS of the 1% packet loss for a longer duration is worse than the other two scenarios. The difference is particularly visible for the concealment methods C and D which get a MOS about 2.5 for the short duration but only 1.5 for the longer duration. There is an exception as it should be noted that for the error concealment case “A” (simulcast decoding with JM), the worst case is the strong error condition of 5.9% at short duration.
The QP value plays an important role on video quality as usual, a sharp decline occurs from HRC1 (QP26) to HRC4 (QP44). The 3D coding with a QP38 has statistically the same MOS as the error concealment C and D for the short duration error and the version A for the longer duration of errors. This may help in finding a link between the coding artifacts and transmission errors as will be further discussed later.
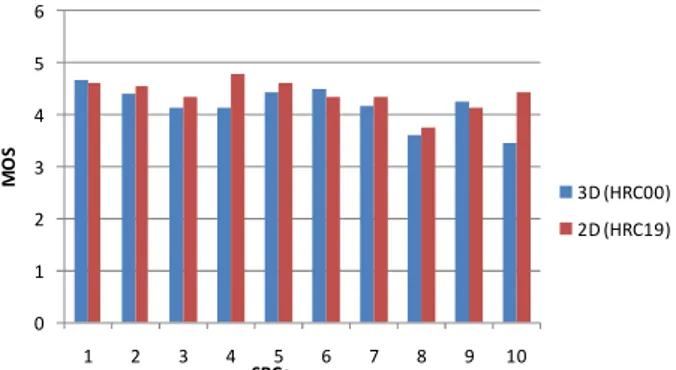
A surprising result from Figure 2 occurs in HRC19, the undistorted 2D video that displays the left view only. This video contains no transmission errors and coding artifacts, and can thus be compared to the 3D reference sequence (HRC0). It can be seen that 2D is slightly preferred to 3D
presentation although the absolute difference is small. This characteristic varies for different video source contents. The comparison between the 2D and the 3D case is shown in Figure 3 for all SRC. 7 out of 10 SRCs are voted for 2D preference, and it is particularly obvious for SRC 10 and SRC4 where the difference is statistically significant. An in depth analysis of the distribution of the observers was performed. Only one observer out of 28 preferred 2D to 3D in a statistical significant manner on a 95% confidence. For all other observers no significant difference was indicated. With 75% confidence, we get 8 observers that preferred 2D over 3D and 2 for the opposite case.
0 1 2 3 4 5 6 1 2 3 4 5 6 7 8 9 10 M O S SRCs 3D (HRC00) 2D (HRC19)
Figure 3: Comparison of 3D and 2D video presentation for different contents
Besides the MOS values, the observer was asked to indicate for each sequence whether he felt visual discomfort. The percentage of the observers that used this checkbox is detailed in Figure 4. The boxplot shows for each HRC the median as a red line, the 25% and 75% values as a box and the 95% confidence interval as a whisker. The minimum and maximum values are indicated by additional markers. The number of the SRC with the highest visual discomfort is displayed at the top. The highest visual discomfort was indicated for SRC10 at HRC14. This particular video sequence was selected by nearly 64% of all observers. It can also be seen that SRC10 is often rated topmost in terms of visual discomfort.
The discomfort indicated for HRC3, 4 and 18 is supposed to be associated mainly to coding artifacts as the high compression corresponding to QP38 value, which usually gives rise to poor 2D visual quality. In 3D presentation, the influence of coding artifacts is not only limited to a degradation of the perceived quality of the video. In addition, the coding artifacts degrade the left and the right view differently and thus, the fusion in the Human Visual System (HVS) is hindered. One particular effect of this is related to the block based approach used by most coding algorithms. The artifacts usually occur at fixed absolute positions in each image. However, the depth effect due to stereopsis is produced by disparity that is the spatial offset of the same object in the left and right view. As a consequence, there is a conflict between the position of the
object in depth and the artifacts that appear at zero disparity, e.g. on the screen plane. Therefore the coding quality expressed as QP value in our experiment is an important factor for both, the quality of the sequences and the visual discomfort. 0 1 2 3 4 5 6 7 8 9 10 11 12 13 14 15 16 17 18 19 0 0.1 0.2 0.3 0.4 0.5 0.6 SRC 10 10 8 7 10 10 10 10 10 2 8 10 8 2 10 10 10 10 10 1 V is u a l d is c o m fo rt ( o b s % ) HRC
Figure 4: Comparison of visual discomfort versus HRCs
HRC5, 9 and 13 represent the error concealment method used in traditional H.264 decoding (case A). In all three cases and for all SRC, at least one observer indicated visual discomfort. It should be noted that HRC9 (5.9% packet loss in a short duration) has the highest visual discomfort score. This verifies that the standard H.264 concealment is not suitable for 3DTV applications.
From Figure 4 it seems that visual discomfort may be a function of the SRC. This has been further detailed in Figure 5 which lists the percentage of indications of visual discomfort for all presentations of the same SRC in the experiment. SRC8 and SRC10 are topmost. Those sequences have a lower resolution and were upscaled for the presentation. They also had the highest crossed and uncrossed disparity. The choice of the comfortable viewing distance was based on those two sequences. Therefore, the objects that are most in the foreground or background of the scenes are rendered just at the limits of the comfortable viewing zone. The content is highly detailed and the video was shot in bright sunlight, thus the background of the scene appears very bright as well. A camera pan is used to track the persons that act in the scenes. On the opposite, SRC5 has the lowest discomfort vote and it should be noted that the disparity range is smallest, the background is dark and it is a rendered scene with no persons using a still camera.
0,00% 5,00% 10,00% 15,00% 20,00% 25,00% 30,00% 1 2 3 4 5 6 7 8 9 10 V is u a l d is co m fo rt ( O b s % ) SRC
The observers used the visual discomfort checkbox differently. In Figure 6 a sorted list of the percentage of sequences that were marked by each observer can be found. 3 observers did not vote for visual discomfort at all, while the most critical observer marked 30.5% of the sequences.
0,00% 5,00% 10,00% 15,00% 20,00% 25,00% 30,00% 35,00% 0 5 10 15 20 25 30 P e rc e n ta g e o f to ta l s e q u e n ce s Observers Visual discomfort
Figure 6: Sorted list of percentage of sequences marked by observers
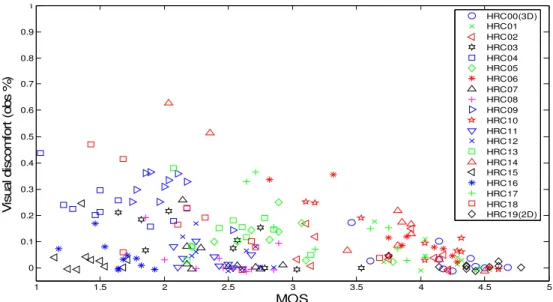
Figure 7 unfolds the relationship between visual discomfort and MOS. The vertical axis is the percentage of observers who vote for discomfort for a sequence, and the horizontal axis shows the MOS. The scatter plot shows the position of each of the 200 video sequences. As the number of observers is limited, the data on the x- and y-axis is quantized. In order to show all results, a uniformly distributed random noise was added. The highest and second highest discomfort record, at 60% and 50% of observers’ votes are represented by HRC14 which are SRC8 and SRC10 encoded at QP26 with 1% of transmission errors and concealment B. The shape resembles to a lower left triangle thus there are no high MOS values at high visual discomfort values. This indicates that a good MOS value is directly linked to the absence of visual disturbance, thus the visual discomfort has an influence on the quality perceived by the observer.
In order to further evaluate the influence of the visual discomfort on the voting, all sequences were selected where
at least 5 observers indicated visual discomfort. For those sequences the MOS of those observers that felt visual discomfort was averaged and the result was 1.9. The observers that did not feel visual discomfort for those sequences was averaged as well and resulted in 2.9. A student t-test was performed and it was seen that this is statistically significant. Thus the presence of visual discomfort and its indication had a significant influence on the voting of an observer.
So far, the analysis focused on the error concealment analysis. A high visual quality of the video content was guaranteed by using a low QP value. Using HRC17 and HRC18 the impact of coding durations in combination with error concealment can be evaluated. The best error concealment method B (switching to 2D) was used.
Table 3: MOS and visual discomfort differences between packet loss free scenarios and 1% burst packet loss scenarios
HRC1-HRC6 QP26 HRC2-HRC17 QP32 HRC3-HRC18 QP38 Mean value of MOS difference 0.236 0.19 0.15 Mean value of Visual discomfort difference -7.8% -7.5% -7.5% Table 3 compares the mean value of all SRCs in terms of the MOS differences between coding only artifacts and 1% burst transmission artifacts with concealment B case. As expected, the observers preferred the error free case when the 3D video was played back without switching to 2D. However, the difference is small indicating the high performance of the error concealment strategy across different coding qualities. On the contrary, people indicated significantly more visual discomfort for the cases in which a switch to 2D was necessary. Both results appear to be stable across different levels of coding quality indicating that the impact of coding artifacts is independent on the impact of switching from 2D to 3D. 1 1.5 2 2.5 3 3.5 4 4.5 5 0 0.1 0.2 0.3 0.4 0.5 0.6 0.7 0.8 0.9 1 MOS V is u a l d is c o m fo rt ( o b s % ) HRC00(3D) HRC01 HRC02 HRC03 HRC04 HRC05 HRC06 HRC07 HRC08 HRC09 HRC10 HRC11 HRC12 HRC13 HRC14 HRC15 HRC16 HRC17 HRC18 HRC19(2D)
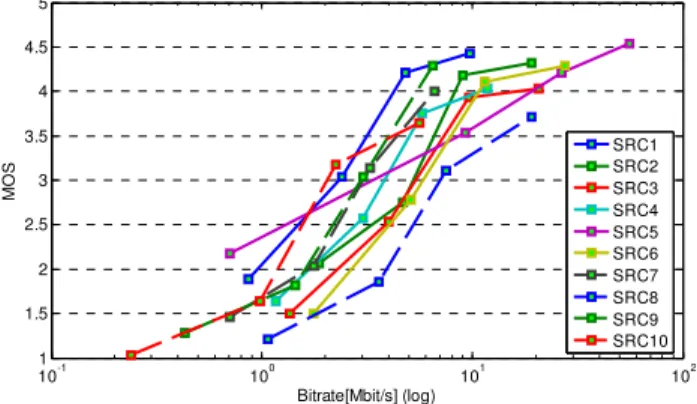
Figure 8 presents the MOS in dependence of bitrate from HRC1 to HRC4 (coding only artifacts) in a semi-logarithmic scaling. The full HD content (1920x1080p) is indicated using solid lines whereas lower resolution content uses dashed lines. For most full HD contents used in our test, the influence of the bitrate on the evaluated video quality changes significantly from the lowest quality rating level to the second highest level (for example the MOS of SRC1 reaches from 1.9 to 4.3 while the bitrate increases from 0.9Mbit/s to 4.8Mbit/s). The curve flattens when the MOS is above the second highest level (Changing the MOS from 4.2 to 4.4 needs twice the bandwidth, from 4.7Mbit/s to 9.7Mbit/s).
The Figure demonstrates why a fixed bitrate may not be suitable for subjective experiments. SRC1 achieves a MOS value of 4.3 at 4.7 Mbit/s while the same bitrates for SRC2 and SRC3 only reach a MOS of 2.8. The diagram also indicates that a bitrate of at least 10Mbps is necessary in order to achieve a mark of “fair” or higher. It can be estimated that at least 20Mbps may be necessary to reach “good” results. 10-1 100 101 102 1 1.5 2 2.5 3 3.5 4 4.5 5 Bitrate[Mbit/s] (log) M O S SRC1 SRC2 SRC3 SRC4 SRC5 SRC6 SRC7 SRC8 SRC9 SRC10
Figure 8: Bitrates versus MOS of each SRCs
5. DISCUSSION
The main purpose of the experiment was to test and compare several different error concealment strategies. The results show that error concealment method B, switching to 2D when errors occur, certainly retains the highest perceived video quality when transmission errors occur; the standard method of concealing the frames in one view is worse in 3D probably due to the effects of binocular rivalry. The sophisticated 2D error-concealment algorithms do not guarantee that the interpolated content matches well with the second, undistorted view. This mismatch will cause visual discomfort to viewers and hence it does not help the perceived quality. Staying in an undistorted 3D presentation mode but slowing or pausing the play-back as was tested in case C and D usually perform poorer than the A method, except for the large amount of burst error scenario. Further experiments are necessary in order to analyze whether there
is a higher sensibility and annoyance of the viewers for videos stopping in 3D than in 2D.
It was seen that 3D does not significantly outperform the 2D presentation and indeed it seemed that when videos with error concealment strategy B were presented, the main cause of annoyance seems to be related rather to the switch between 2D and 3D presentation and not to the time that 2D was presented. Thus, if errors occur, a longer presentation in 2D should be preferred to switching forth and back between 2D and 3D presentation.
The choice of the QP plays not only an important role on video quality, but our test results show an additional effect: For 3D videos a direct connection exists with visual discomfort. Higher QP values will generate more binocular rivalry and let viewers feel uncomfortable; thereby the degradation of the video quality due to coding may be more annoying for the observer than it was for 2D videos.
It was seen in the results that the error concealment conditions can be compared to coding degradations in terms of MOS in our test. In particular, the QP38 was found statistically equal to some of the QP26 coded conditions with error concealment. This result may be exploited in the context of joint source channel coding. It can be noted already that if the video is played back with switching to 2D as error concealment strategy, the degradation of MOS is not significant. This indicates that a channel code that is supposed to be effective in this scenario is difficult to design. It has to correct more errors than were used in the test (e.g. 5.9% of lost packets in the given time frame) with only a small reduction of the available bitrate for the video transmission. It should be noted that in the simulcast case, the left and the right view transmission approaches a repetition code. We used this effect for the error concealment case “B”.
The second goal was to work towards establishing a reliable subjective test method for 3DTV. Several important prerequisites were presented in the setup such as the viewing environment. The subjective test method that was used in our experiment was Absolute Category Rating with Hidden Reference using only one single voting session. This is opposed to doing several subjective experiments and asking the observers to judge one isolated aspect of 3D quality in each of them such as depth, naturalness etc.
The particular subjective experiment setup used in our experiment may be regarded as reliable as the votes of the observers sufficiently coincide so that none of the observers was rejected. The confidence intervals of the different sequences and their cumulative results per SRC or HRC are in the range that is known from similar 2D subjective experiments.
A counter-indication of the suitability of the ACR method for 3D testing seems to be the missing preference of 3D presentation over 2D presentation. One problem may be related to the single stimulus method, e.g. the missing reference when suddenly viewing 2D content in the context of 3D. As the DSCQS method was used in the pre-test and three of the 2D conditions (HRC19) were included a first comparison is possible: In all three cases (SRC2, 5 and 9), 3D was preferred in the DSCQS test in a statistically significant way. On the contrary, for the ACR test, no statistical significance is detected and only in one case the MOS for 3D is higher than for 2D. Please note that the value of this comparison is limited by the fact that the training session was often the first contact of the viewers with a 3D LCD screen.
The addition of the checkbox on visual discomfort provided insight into the influence of binocular rivalry on the MOS. It should be noted however that the number of votes per observer spans a large range from 0% to 30.5%. This may be improved by replacing the optional voting as a checkbox by a forced choice vote.
6. CONCLUSION
In this paper, stereoscopic 3D video sequences were transmitted over a lossless or simulated error-prone channel and their quality of experience was evaluated by observers. The influence of coding degradations and the error concealment strategy on the subjective quality was discussed. It was seen that the coding artifacts influence not only the QoE value but also the visual comfort. For error-prone channels, the H.264 standard method of concealing the frames is not suitable for 3D videos as this impacts only one view. The best method of the four tested error concealment methods is to switch to 2D presentation which also uses the inherent redundancy of the transmitted information. It was also learned that the QoE value and the visual discomfort depends strongly on the properties of the reference sequence, e.g. the 3D scene content, the camera capturing, and the resolution.
The setup, execution, and analysis of a subjective experiment for 3D content were presented. It was shown that our proposal of using the ACR-HR method with an additional checkbox for visual discomfort provides important insights into the perceived quality of 3D video sequences.
7. ACKNOWLEDGEMENT
This work has been partly conducted within the scope of the JEDI (Just Explore DImensions) ITEA2 project which is supported by the French industry ministry through DGCIS. In Sweden, the work was partly financed by VINNOVA (The Swedish Governmental Agency for Innovation
Systems). We would like to thank Mårten Sjöström at the Mid Sweden University for his advice.
8. REFERENCES
[1] A. Vetro, S. Yea, Y. Chen, S. Shimizu, P. Pandit, C. Lim; “Status of MVC text, software, and conformance” JVT-AE014, 2009
[2] H.264/AVC Software manual, ISO/IEC JTC1/SC29/WG11 and ITU-T SG16 Q.6), http://iphome.hhi.de/suehring/tml/
[3] M. Mu, R. Gostner, A. Mauthe, and G. Tyson; “Visibility of individual packet loss on H.264 encoded video stream: a user study on the impact of packet loss on perceived video quality”; Proc. SPIE, Vol. 7253, 725302 (2009)
[4] J. Meenowa, D.S. Hands, R. Young, and D. Bayart; “Subjective assessment of HDTV content: comparison of quality across HDTV formats”; Proc. SPIE, Vol. 7527, 75270I (2010)
[5] M. Pinson, S. Wolf, G. Cermak; “HDTV subjective quality of H. 264 vs. MPEG-2, With and Without Packet Loss”; IEEE Transactions on Broadcasting (2010)
[6] Ukai, K. and P.A. Howarth. 2008. Visual fatigue caused by viewing stereoscopic motion images: Background, theories, and observations. Displays, 29(2), 106–116.
[7] ITU, "Methodology for the subjective assessment of the quality of television pictures," in Recommendation BT 500-11, ed: International Telecommunication Union., 2002.B.
[8] ITU-T Study Group 12. 1997. ITU-T P.910 Subjective video quality assessment methods for multimedia applications. ITU-T P.910.
[9] Cermak, G., L. Thorpe and M. Pinson. 2009. Test Plan for Evaluation of Video Quality Models for Use with High Definition TV Content. Video Quality Experts Group (VQEG). ftp://vqeg.its.bldrdoc.gov/Documents/Projects/hdtv/VQEG_H DTV_testplan_v3.doc
[10] G. Sullivan and T. Wiegand, "Video Compression - From Concepts to the H.264/AVC Standard," Proceedings of the IEEE, vol.93, no.1, pp.18-31, Jan. 2005. Available at http://ip.hhi.de/imagecom_G1/assets/pdfs/pieee_sullivan_wie gand_2005.pdf.
[11] Barkowsky, M., M. Pinson, R. Pépion and P. Le Callet. 2010. Analysis of Freely Available Dataset for HDTV including Coding and Transmission Distortions. Fifth International Workshop on Video Processing and Quality Metrics (VPQM).
[12] Chen, W., J. Fournier, M. Barkowsky and P. Le Callet. 2010. New Requirements of Subjective Video Quality Assessment Methodologies for 3DTV. Fifth International Workshop on Video Processing and Quality Metrics (VPQM).