Titre:
Title
: High latency cause detection using multilevel dynamic analysis
Auteurs:
Authors
: Naser Ezzati-Jivan, Geneviève Bastien et Michel R. Dagenais
Date: 2018
Type:
Communication de conférence / Conference or workshop itemRéférence:
Citation
:
Ezzati-Jivan, N., Bastien, G. & Dagenais, M. R. (2018, avril). High latency cause detection using multilevel dynamic analysis. Communication écrite présentée à Annual IEEE International Systems Conference (SysCon 2018), Vancouver,
Canada (8 pages). doi:10.1109/syscon.2018.8369613
Document en libre accès dans PolyPublie
Open Access document in PolyPublie URL de PolyPublie:
PolyPublie URL: https://publications.polymtl.ca/4203/
Version: Version finale avant publication / Accepted versionRévisé par les pairs / Refereed Conditions d’utilisation:
Terms of Use: Tous droits réservés / All rights reserved
Document publié chez l’éditeur officiel
Document issued by the official publisher Nom de la conférence:
Conference Name: Annual IEEE International Systems Conference (SysCon 2018) Date et lieu:
Date and Location: 23-26 avril 2018, Vancouver, Canada Maison d’édition:
Publisher: IEEE URL officiel:
Official URL: https://doi.org/10.1109/syscon.2018.8369613 Mention légale:
Legal notice:
© 2018 IEEE. Personal use of this material is permitted. Permission from IEEE must be obtained for all other uses, in any current or future media, including
reprinting/republishing this material for advertising or promotional purposes, creating new collective works, for resale or redistribution to servers or lists, or reuse of any copyrighted component of this work in other works.
Ce fichier a été téléchargé à partir de PolyPublie, le dépôt institutionnel de Polytechnique Montréal
This file has been downloaded from PolyPublie, the institutional repository of Polytechnique Montréal
High Latency Cause Detection using Multilevel Dynamic Analysis
Naser Ezzati-Jivan
Ecole Polytechnique Montreal Montreal, Quebec H3T 1J4
Genevieve Bastien
Ecole Polytechnique Montreal Montreal, Quebec H3T 1J4 [email protected]
Michel R. Dagenais
Ecole Polytechnique Montreal Montreal, Quebec H3T 1J4 [email protected]
Abstract—The performance of applications remains a major
concern to programmers. An unexpected latency can be caused by a bug or a bad program design, but it can also be caused by external factors such as resource contention or system overload. There exist tools, program profilers, that are used to detect latency. These tools, however, provide a limited view of a system’s execution. For example, user space profilers can only detect slow functions but are unable to pinpoint the root causes -whether the problem comes from a slow I/O operation, interrupt, lock contention, or other problems. Kernel tracers, on the other hand, are able to collect detailed information about the operating system execution at various levels from hardware counters to system calls, disks, network I/O, etc, from which the main performance problems can be detected. In this paper, we combine user space and kernel space tracing data to understand and diagnose system performance problems and to guide users to identify the root causes. Our approach works by making a single data model by synchronizing and correlating the data gathered from different layers. We show the effectiveness of our approach by applying it to understand the latency of PHP web applications in handling web requests.
I. INTRODUCTION
A performance degradation in a software system many be caused by several factors including insufficient system resources, inefficient input/output operations, software bugs, bad software design, database issues, or misconfiguration. When performance degradation occurs, one needs to locate the problem and determine the root causes. There exist many debuggers and profilers that can pinpoint what went wrong. They are good at locating the modules, functions, or lines of code that do not work properly. But, they have shown to be limited in determining the root causes [13]. This is because they focus on a narrow view of the system. User space profilers, for example, are commonly used to detect the frequency and duration of (slow) function calls, but cannot determine if this is caused by another thread, a slow I/O operation, interrupt, lock contention, or other lower level problems. Kernel tracers, on the other hand, provide detailed information about an operating system’s execution but are difficult to correlate with user space requests (e.g., a function call, a web request, a database query, etc.). In other words, using existing profilers, it is usually challenging to follow a specific user request through the execution layers of a system (user space and kernel space layers) in oder to understand the causes of performance degradations.
In this paper, we present a multi-level trace-oriented analysis approach to analyze causes of latency problems in software systems. It is multi-level because it analyzes and correlates
data gathered from various layers of the computer stack including the application layer, system call layer, and the operating system layer. The proposed solution uses LTTng, a low-overhead Linux kernel and user space tracer [4] to collect execution traces. The trace data, collected from the different components of the system, are correlated, analyzed, and the extracted information is grouped in a unified data model by using some synchronization primitives, namely timestamps, thread id, process id, so that in the analysis phase, all data belonging to a specific request/task (which may come from different tracers) are investigated and visualized together.
Our approach is generic and can be used to analyze different software systems. However, the use cases presented in this paper focus on PHP web applications. We instrument the PHP core and its different modules and provide tracing probes to collect runtime information to understand and analyze the whole PHP/web request chain, from the early time when a request arrives in the server and goes through the database server(s) to the time the request is fully handled, and the response is returned to the user.
The main contributions of the paper are:
• A generic multi-level analysis solution to root cause investigation of performance bottlenecks of software sys-tems.
• An optimized data model to work with information gathered from different sources and layers, making the multi-level analysis possible and interactive.
• An instrumentation approach, tailored to the PHP lan-guage, to collect efficiently the required runtime execu-tion data for the entire PHP web chain, required for the analysis of PHP applications.
The remainder of the paper is organized as follows: After discussing the related work in Section 2, the architecture of our multi-level trace modeling and its formal definition is proposed. Three use cases are presented to show the usability and usefulness of the proposed approach. This is followed with the threats to validity. The conclusion and future work are then presented.
II. RELATEDWORK
Tracing consists of collecting execution events from a system at runtime [9]. A trace event can be a function call, a system call, a file open, etc. The payload of a trace event usually contains the event name, processor id, thread id, timestamp, file descriptor (fd), and any other data of interest. Unlike debugging where the program is executed step by step
to get its current state, tracing collects data during execution and the trace file is usually analyzed offline. The overhead of tracing should be minimal in order to preserve the normal behavior of the system.
LTTng [7] is an open source Linux tracing tool first de-veloped at DORSAL1 to provide very low overhead tracing capabilities. It is packaged as an out-of-tree kernel module and it is available in all major Linux distributions. LTTng supports kernel and user space tracing, which is useful to correlate high-level application events with low-level kernel events. Kernel tracing can be performed dynamically using Kprobes or statically using the TRACE EVENT macro.
System analysis through execution trace data can be used to study the runtime behavior of software systems. Surveys of dynamic analysis techniques are presented in [13] and [5]. The surveyed studies discuss analysis of traces, gathered from a single layer (usually user space) only. A comparison of using user space and kernel space trace data in software anomaly detection is presented in [19]. The separate analysis of different layers of kernel data is studied in [15], while the processing of system call traces are studied in [10], [11], [17]. Disk usage analysis is proposed by Daoud el al. [6], in which a comprehensive Linux tool that uses a general purpose tracer to recover high-level storage metrics from low level trace events collected from the storage subsystem. Similar tools such as Oracle ZFS Storage Software[16] and IBM XIV [20] are available in other operating systems. The visibility of this work is however limited to only one layer and does not include data from the other layers of the system.
Biancheri et al. [3] proposed a solution to analyze the host applications and contained virtual machine(s) at the same time. In their work [3], a fused view is proposed to display the executions of host applications and virtual machine(s) in a unified framework. A similar idea, but to study the kernel and user space level executions, is presented by Wininger et al.[21] and [18], which are an extension of a previous study on multilevel trace abstraction and analysis, presented by Ezzati et.al [11], [12]. Although their work is interesting in terms of performing useful trace-based analysis tasks, their solution lacks a unified data model for the collected data, hindering the ability to move one layer to another effectively, an issue that we address in this paper.
All the above studies review different aspects of trace-based analysis of software systems. However, they lack a unified way of analyzing multi-level trace data, i.e., traces that are generated from different layers of a computer stack. The main objective of this paper is to propose a solution to gather the data from different layers of a computer stack, process them, extract the required data and place them in a correlated data model. The data is then used for performance diagnosis as a posteriori analysis phase. The analysis synchronizes the data between from different layers using common various features such as clock time, process names, etc.
1Distributed Open Reliable Systems Analysis Lab (DORSAL) http://www.dorsal.polymtl.ca
III. MULTI-LEVELTRACE-BASEDANALYSISAPPROACH
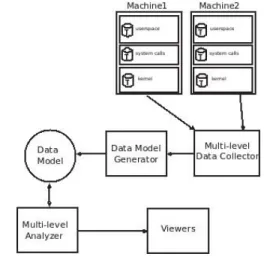
Figure 1 shows the overall architecture of our proposed approach for understanding the causes of performance degra-dation using a multi-level trace-based analysis technique. We
Fig. 1. General architecture of the proposed multilevel analysis
first start by collecting trace data from different layers. The data is then correlated, modeled, and stored in the appropriate data structures. Then the analyzer part reads the generated models and present the results in various views. We discuss each component in more detail in the subsequent sections. A. Data Collection
To collect data, we instrument the core of the application by inserting tracepoints (macros) in different modules, so that users do not need to change their source code. Whenever the executions reaches a tracepoint, the tracing macros are executed and the data log is generated, and stored in the corresponding CPU buffers.
Kernel tracers usually work by instrumenting the different modules of the operating system. The instrumentation can by accomplished dynamically (e.g., using Kprobes) or statically in the kernel. LTTng tracer [8], which is used in this work, supports both ways. LTTng provides data in the different modules of the operating system layer, including system calls, processes, file system, disk accesses, memory accesses, network layer, interrupts, timers, etc.
User space tracers, on the other hand, typically work by instrumenting the source code. However, it is also possible to trace a user space application without changing the source code. To do so, the core libraries are replaced with wrapper libraries, and therefore the program calls the functions from the new wrapper using LD PRELOAD or other interception techniques. The wrapper library in turn calls the functions from the original library but includes some tracing before and/or after.
In this paper, to collect user space traces, we have developed a PHP extension module that intercepts the core PHP function calls and wraps them by adding tracing macros before and after each function. This dynamic instrumentation method has
the advantage of not modifying the PHP code. The injected tracepoints make it possible to locate functions that cause delays in processing user requests. Table I shows the important events that the PHP tracer collects. This PHP extension is open-source and available for public use2.
For the operating system level, we use LTTng kernel tracer to gather system calls, and other events needed to reason at the level of process execution (i.e., CPU scheduling events, wakeup events, interrupts and system calls).
User space and kernel space tracers run simultaneously, and collect separately their own data. The correlation of this data is explained in the next subsection.
TABLE I PHPTRACING EVENTS
Trace Event Layer Description
request start PHP Fires when a new PHP request is arrived. It includes information about time, client ip and port, method (get,post, etc.), file re-quested, etc.
request exit PHP Fires when the handing of the PHP request is completed. It includes timestamp and the status of the request.
function start PHP Fires when a function is called. It includes file name, function name, class name.
function exit PHP Fires when a function exits. It in-cludes status of the function execu-tion.
execution start PHP Fires when a code line is executing. It includes the line number and file and function names.
execution exit PHP Fires when a execution of a line is finished. It includes the line num-ber and execution status. compile file entry PHP Fires when a file compilation starts.
It includes the file name and file path.
compile file exit PHP Fires when a file compilation ends. It includes the status of t he com-pilation.
B. Data Model
A trace event, EV, represents an interaction between a set of system resources (processors, files, disks, processes, network sockets, etc.) in a specific timestamp ti and one or more output values like vi. For example, the event EV1 = (t1, p1, read, f d1, cpu0, 100) shows that at time t1, process p1 reads 100 bytes from a file indicated with the file descriptor fd1, running running on cpu0. More formally, an EVi that appears at timestamp ti and which involves n resource and m values can be represented as follows:
EVi= (ti, r1, . . . , rn, v1, . . . , vm) (1)
2URL is not provided to respect the blind review process
A trace TR of size S is a set of ordered events. Events in a trace are ordered by their timestamps and no two distinct events have the same time values:
T R = {EV0, EV1, EV2...., EVs} (2) Trace events usually include very detailed information about a system’s execution. However, the volume of the collected data can be quite large, making it challenging to analyze their content. Different trace data reduction and abstraction approaches have been proposed. Ezzati el al. [10] proposed an approach to abstract out raw traces by grouping low-level events into compound events, enhancing the readability of traces. These techniques, however, reduce the precision of the analysis, which can make the detection of some problems impossible. But the idea behind that helped us in this work to reduce the trace data by making higher-level information out of the raw input data.
To reduce the size of traces, we introduce the concept of abstract events. Abstract events are used to denote high-level concepts such as an active network connection, process blocked, process running, CPU preempted, etc. A high-level event is constructed by grouping some raw level events. This grouping is done semi-automatically by providing the ability to software developers to define patterns depending on the objective of the analysis. This is described further in the next subsection.
A trace can be represented as a sequence of abstract events. We refer to the transition from one abstract event to another as a state change. Each state has a duration, a key, and a value. For example, the state ”an active network connection” includes a key (i.e., the network connection socket id or ip addresses) and a value (i.e., active), and a time duration (e.g., t1 to t2) in which the state value is valid for the key. This is represented in Equations (3). ⎧ ⎪ ⎨ ⎪ ⎩ T D = {[ti, tj]|ti, tj∈ N, ti< tj}
SV = {(tdi, ati, vi)|tdi∈ T D, ati∈ Attributes, vi∈ N} State DatabaseSD = {svi|svi∈ SV }
(3) As shown in the above equations, each state value svi includes a time range tdi∈ T D, an attribute ati, and a value vi. The attribute describes an aspect of a system resource. For example, an attribute fd refers to file descriptor, which is an aspect of a file. Other examples of attributes are process id, CPU number, socket address, parent pid of a process, and so on.
C. Analysis
The analysis of trace content is reduced to the problem of identifying parts of the trace that can help software developers achieve a given task. Each task may require a different view point of the trace. For example, an analysis view can be built specifically for measuring the CPU utilization of each process in the system. Another example would be to construct an analysis view to understand disk I/O failures.
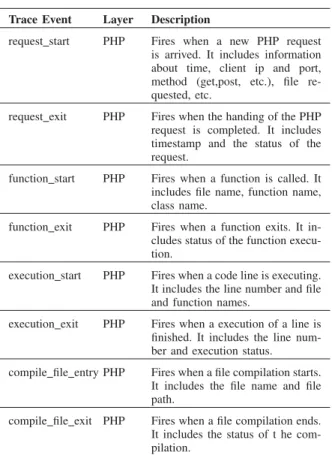
Each type of analysis requires a set of mapping rules to specify what and how to extract the required data from the in-put trace. By using these rules, we can read the corresponding trace events, process them, and generate high-level views as shown in Figure 2.
Fig. 2. Analysis converts a part of trace data to high level abstract data
We developed a powerful framework in which software developers can define these rules depending on their needs. The rules can be hard coded in JAVA or specified using XML. The framework can be used to define complex transitions from trace events to high-level states. It is also extensible to support the requirements of multiple use cases. For example, Listing 2 shows a set of rules, expressed in XML, on how to convert trace events into a set of state and the transition between these states. Once these rules are specified, we can apply them to the input trace, extracted the required information, and convert them into state values, which can later be viewed by one of the views, supported by our framework, and used for analysis. We also group the analysis rules that relate to the same host into a model to allow software developers reason about the underlying system from different point of views (see Figure 3).
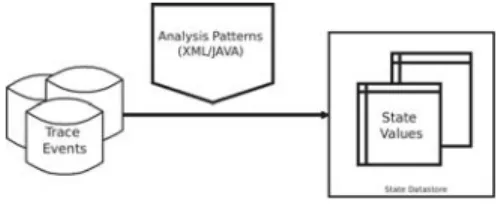
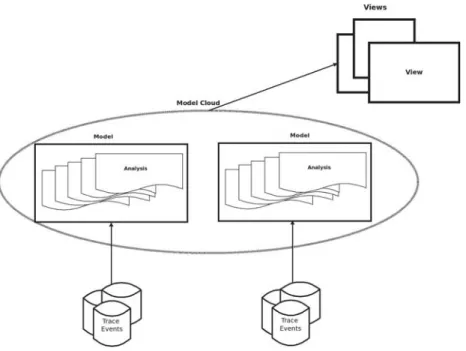
Furthermore, we introduce the concept of a model cloud, which contains all models pertaining to a system with multiple hosts. A grouping of models is necessarily when users want to trace distributed systems that involve different host machines. The traces generated from the various machines and the analysis rules can be stored into a model cloud as shown in Figure 4.
The concept of View is used to display the output of the application of mapping rules. A view is independent from analysis models as shown in Figure 3. A view can be built in a way to use data from a model. The type of analyses that a model provides constitutes the model API.
A view can be rendered using visualization techniques such as time-lines, bar charts, tables, heat-maps, etc. Views can be either predefined or specified in XML. XML views are derived from existing base views and can define several new instances of the base views. For example, a XML view can define a specific time-line for process executions, a time-line for futex analysis, a bar chart for I/O usage, a heat-map for disk utilization, and so on.
It is important to note that if the input traces come from dif-ferent tracers with difdif-ferent formats, they have to be converted into the same format. In our case, since we use LTTng and LTTng-UST as our tracer, we support CTF (Common Trace Format) [1].
The whole proposed method is implemented in Trace-Compass, an open source project [2](an open source trace viewing and analyzing tool), under the name of TraceCompass Incubator and is available to public3.
IV. EVALUATION
In this section, we discuss two use cases based on the pro-posed analysis approach. Both use cases use traces collected from two levels: kernel and user spaces. For the kernel level, we use LTTng kernel tracer and for the user space we use LTTng-UST tracer. The first use case studies the compilation time of a PHP script and the second use case focuses on the identification of the root causes of periodic performance latency in a real website. Both user space and kernel space traces are from the same host and use the same clock. A. Environment
The tests are executed in a machine with the following configuration.
Hardware configuration:
• Intel i7-4790 CPU @ 3.60GHz
• 16 GB RAM
Software configuration:
• Linux Kernel version 4.14.12 • LTTng 2.10
• Apache 2.4.23, PHP 7.0 and MariaDB 10.2 B. Use Case 1: PHP compile time analysis
The PHP language is interpreted using the PHP runtime engine (e.g, the Zend Engine). The PHP compiler reads the source code, produces an abstract syntax tree (AST), and then translates it into bytecode, that is then executed by the PHP runtime engine. The problem is that PHP recompiles the source code for every request, which may cause latency. In this use case, we want to understand the whole compilation process and the steps that may be bottleneck. More specially, we address the following questions: What is the performance cost when PHP recompiles the source code for every request? what is the percentage of the request handling time dedicated to the compilation step versus the time for the real execution? To answer these questions, we collect traces from user and kernel spaces. The user space trace includes details about PHP code compilation and execution. On the other hand, the kernel space trace contains data on the real execution of the PHP code in the kernel layer including process scheduling, interrupts, file accesses, system calls, etc.
To conduct this analysis, we run the simple PHP code shown in Listing 1. It includes the opening of three PHP files. Our objective is to investigate what happens in the system during opening and running these files.
1 <?php /*example.php*/ 2 $x = rand(0,1000);
3 include ’folder1/’.$x.’.php’; 4 include ’folder2/’.$x.’.php’;
Fig. 3. Trace events to Analysis to Model to Model Cloud
Fig. 4. Trace events generated for different modules of the LAMP stack
5 include ’folder3/’.$x.’.php’; 6 ?>
Listing 1. Sample PHP source code
For the user space trace, we define a call stack analysis, which converts the input trace events to finite state machines (FSM), enabling the visualization of the execution call stack to show active subroutines of a PHP execution over time. The XML mapping rules to generate the FSM is shown in Listing 2. The rules contain transitions that show how to interpret the trace events and how to change the state machine for each event. For each state transition, the corresponding state changes are made and stored to construct the output view. For instance, for transition in line 14 of Listing 2, a state value named ”Compile File” is generated with the time range from the corresponding compile entry event to the compile exit and stored in the state data store. Figure 5 shows the events and the generated state value.
We first start by looking at only the user space trace. The
Fig. 5. State change corresponding to the XML call stack analysis shown in Listing 2.
call stack view and the execution times are shown in Figure 6. The view shows that the time required to compile all the PHP files (the main script and the three PHP files that the main script opens) is 1/10 of the whole request time, which is somehow acceptable ( (27.4 + 13.3 + 11.2 + 9.7)/592≈ 1/10 ).
But when adding the kernel trace and analyzing both traces at the same time, we see a different diagnosis. Figure 7 shows the output of the combined call stack view. The first line shows the kernel execution and the other lines are for the user space call stack of the PHP execution. Using the kernel trace we
1<fsm id="PhpCallStack" initial="Wait_start"> 2 <state id="Wait_start">
3 <!-- The state will stay here until we have a new php request event -->
4 <transition event="request_entry" target="in_thread" action="entering_request:push_uri"/> 5 </state>
6 <state id="in_thread" >
7 <transition event="function_entry" cond="same_thread" target="in_thread" action="push_event_type"/> 8 <transition event="function_exit" cond="same_thread" target="in_thread" action="pop_event_type"/> 9
10 <transition event="execute_entry" cond="same_thread" target="in_thread" action="push_execute"/> 11 <transition event="execute_exit" cond="same_thread" target="in_thread" action="pop_event_name"/> 12
13 <transition event="compile_entry" cond="same_thread" target="in_thread" action="push_compile"/> 14 <transition event="compile_exit" cond="same_thread" target="in_thread" action="pop_event_name"/> 15
16 <transition event="request_exit" cond="same_thread" target="in_thread" action="pop_uri"/> 17 </state>
18 <final id="end_thread"/> 19</fsm>
Listing 2. XML to generate call stack state machine data from trace
can obtain information about when a PHP script opens the file to be compiled and when the PHP closes the file. The PHP engine does the compilation, optimization, and possibly, the writing into the cache between these two times. This is repeated for every other request. Therefore if we consider this time as the new compile time (compilation and optimization time together) we can see that it takes around 90% of the execution time (55us/60.2us ≈ 90%), which is quite high.
Our investigation shows that, in some cases, PHP compile-time can be much more than the compile-time required to execute the script. To solve this problem PHP introduced OPcache (Opcode Cache) to store the compiled and optimized bytecode into a cache and reuse that for subsequent uses. The result of executing the same code with having OPcache enabled is shown in Figure 8.
Fig. 6. Call Stack view of sample PHP code execution
Fig. 7. Multilevel call stack view using the kernel and user space trace events
It is important to note that this analysis is not possible (or may yield different results) if one uses traces from one space only. Integrating the data from user and kernel spaces makes this analysis possible.
Fig. 8. Execution of the sample PHP script with having OPcache enabled
C. Use Case 2: Performance latency root causes
In collaboration with an industrial partners, we observed that users of their web server were complaining about periodic latency problems in their website. We copied the web server files into our local machine and used the same configuration (for example we enabled the OPcache as it was enabled in the main server) and generated traffic with ApacheBench(ab) tool. The response time pattern for a few minutes of execution is shown in Figure 9. As the figure shows there are periodic latency every few moments. At the beginning, we traced the
Fig. 9. Response time graph for our slow web server
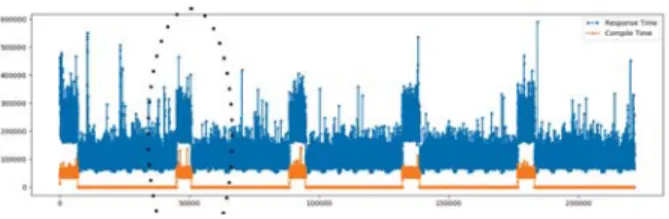
user space with our PHP tracing extension and the analysis of the output call stack confirmed the latency. We suspected the time to be the cause. Therefore, we added compile-time to the graph shown in Figure 10. This revealed that the compile times represent only a small portion of the response time and, therefore, cannot be the reason of the latency. We decided to add a kernel trace and enable multi-level analysis.
Fig. 10. Response time and compile time for our slow web server
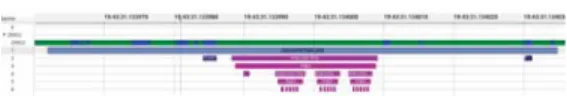
Figure 11 shows the combined call stack of three concurrent slow requests (which are handled by three separate threads). The first line of each request (the kernel stack) shows that there are blocking and waiting states in the two first threads, while the third thread is running. This shows that the PHP threads suffer from some contentions. A deeper analysis revealed that when the scripts are not yet compiled and only existed in the OPcache (e.g., when the web servers or OPcache are restarting for some reasons), the contention on OPcache may occur. It is mainly because of the contention over OPcache structure, which is a shared memory between all running PHP threads. When several scripts want to compile and write to the shared memory at the same time, they need to exclusively lock the whole shared memory and once one process takes the lock, other processes have to wait until they can obtain access and be able to write to the OPcache. This is actually the case for our problem and we could see in the kernel trace that the PHP threads are waiting for each other.
To confirm our findings, we tested our trace with Critical Flow View ([14]), which is a tool that shows dependencies among processes. The results showed that there are block-waitings between the processes (shown in Figure 12). Running with more concurrent requests yielded more apparent results on block-waiting situation between the processes, which is shown in Figure 13.
Fig. 11. Call Stack view of the concurrent PHP requests
D. Use Case 3: Examining the overhead of the approach In this use case, we analyze the overhead added by our approach. We use as a configuration an Apache Web server and the PHP language installed as an Apache module. The
Fig. 12. Call Stack view of sample PHP code execution
Fig. 13. Call Stack view of sample PHP code execution
workloads applied are generated using ApacheBench (ab) to simulate the behavior of concurrent clients navigating through-out the server. The trace was collected using LTTng 2.10. The experiment is performed using different numbers of clients (between 1 and 1,000) with the following configurations:
• No tracing: The tracing is disabled.
• Required events: Only events required for analysis are activated.
• All events in memory: All kernel and user space events are activated and the trace is kept in memory.
• All events: All kernel and user space events are activated and the trace is written to the disk.
The results of the experiment are presented in Figure 14.
Fig. 14. Comparison of kernel and user space tracing costs
The experiment is conducted on a Drupal website where serving a web request requires executing 33k lines of code in average. The graph shows that enabling the required user space events does not have a significant impact on the website performance. The server is able to process about 30,000 requests per second in both cases. The impact of tracing becomes significant if all kernel tracepoints are activated. Kernel tracing appends a lot of system details to the trace and
increases the overhead. In the case where the kernel tracing is enabled, the processing speed goes down to 21,000 requests per second if the trace is written in memory, and 19,000 if it is written to the disk. Writing data to the disk does not add much overhead, because it is done asynchronously using a separate process.
In practice, we do not necessarily need to enable all kernel tracepoints. Because in most cases, only a subset is required to generate the required analysis views. For the evaluation, we did another test in which instead of enabling all kernel events, we only enabled those are enough to draw the control flow of the kernel and extract block waiting states, i.e., system call and process scheduling events. With this new minimum configuration, the tracing impact became less than 7.5%.
V. THREATS TOVALIDITY
A threat to internal validity exists in the implementation of our approach, especially the PHP instrumentation macros. We developed this in C++ and it is possible that an incorrect implementation may cause variation in results. However, we have mitigated this threat by manually reviewing the code and working through many examples.
A threat to external validity exists in generalization of our approach to other systems. We only evaluated our approach on a PHP applications, and further experiments to generalize results on other systems are needed.
VI. CONCLUSION ANDFUTUREWORK
In this work, a unified analysis method is proposed for investigating trace data collected from the different layers and sources. The objective is to combine user space and kernel space traces for the analysis of performance latency problems. We present a unified model that enables multi-level analysis of traces. Our approach relies on mapping rules that can be defined dynamically to convert raw trace data into more meaningful abstract information that can later be viewed in different views.
The proposed solution was used to study the handling of PHP requests and also to evaluate a real web application performance problem. When a web site is slow or there is an unexpected latency, it can be difficult to find the problems because it can have several different underlying causes. The proposed solution investigates the problem using the data gathered from the user space and kernel space and discovers the root causes of the problem.
To build on this work, we will continue (a) to develop map-ping rules for various types of analyses, (b) add new views, and (c) leverage machine learning for predictive analytics.
VII. ACKNOWLEDGMENT
We would like to gratefully acknowledge the Natural Sci-ences and Engineering Research Council of Canada (NSERC), Ericsson, and EffciOS for funding this project.
REFERENCES
[1] Common trace format (ctf. Accessed: 2017-10-10. URL: https://www. efficios.com/ctf.
[2] Eclipse trace compass, year = , url = https://www.tracecompass.org, note = Accessed: 2017-10-10,.
[3] C. Biancheri, N. E. Jivan, and M. R. Dagenais. Multilayer virtualized systems analysis with kernel tracing. In 2016 IEEE 4th International
Conference on Future Internet of Things and Cloud Workshops (Fi-CloudW), pages 1–6, Aug 2016.
[4] Martin Bligh, Mathieu Desnoyers, and Rebecca Schultz. Linux kernel debugging on google sized clusters. In OLS (Ottawa Linux Symposium)
2007, pages 29–40, 2007.
[5] B. Cornelissen, A. Zaidman, A. van Deursen, L. Moonen, and R. Koschke. A systematic survey of program comprehension through dy-namic analysis. IEEE Transactions on Software Engineering, 35(5):684– 702, Sept 2009.
[6] Houssem Daoud and Michel Dagenais. Recovering disk storage metrics from low-level trace events (under review).
[7] Mathieu Desnoyers. Low-impact operating system tracing. PhD thesis, ´
Ecole Polytechnique de Montr´eal, 2009.
[8] Mathieu Desnoyers and Michel R Dagenais. Lttng, filling the gap between kernel instrumentation and a widely usable kernel tracer. In
Linux Foundation Collaboration Summit, 2009.
[9] Mathieu Desnoyers and Michel R Dagenais. Lockless multi-core high-throughput buffering scheme for kernel tracing. ACM SIGOPS Operating
Systems Review, 46(3):65–81, 2012.
[10] Naser Ezzati-Jivan and Michel R Dagenais. A stateful approach to generate synthetic events from kernel traces. Advances in Software Engineering, 2012:6, 2012.
[11] Naser Ezzati-Jivan and Michel R. Dagenais. Stateful synthetic event generator from kernel trace events. Advances in Software Engineering, January 2012.
[12] Naser Ezzati-Jivan and Michel R Dagenais. Cube data model for multilevel statistics computation of live execution traces. accepted in
Concurrency and Computation: Practice and Experience, 2014.
[13] Naser Ezzati-Jivan and Michel R Dagenais. Multiscale abstraction and visualization of large trace data: A survey. submitted to The VLDB
Journal, 2014.
[14] Francis Giraldeau and Michel Dagenais. Wait analysis of distributed systems using kernel tracing. IEEE Transactions on Parallel and Distributed Systems, 27(8):2450–2461, 2016.
[15] Francis Giraldeau, Julien Desfossez, David Goulet, Michel R. Dagenais, and Mathieu Desnoyers. Recovering system metrics from kernel trace. In OLS (Ottawa Linux Symposium) 2011, pages 109–116, June 2011. [16] Brendan Gregg. Visualizing system latency. Communications of the
ACM, 53(7):48–54, 2010.
[17] Abdelwahab Hamou-Lhadj, Syed Shariyar Murtaza, Waseem Fadel, Ali Mehrabian, Mario Couture, and Raphael Khoury. Software behaviour correlation in a redundant and diverse environment using the concept of trace abstraction. In Proceedings of the 2013 Research in Adaptive and
Convergent Systems, RACS ’13, pages 328–335, New York, NY, USA,
2013. ACM. URL: http://doi.acm.org/10.1145/2513228.2513305. [18] K. Kouame, N. Ezzati-Jivan, and M. R. Dagenais. A flexible
data-driven approach for execution trace filtering. In 2015 IEEE International
Congress on Big Data, pages 698–703, June 2015.
[19] S. S. Murtaza, A. Sultana, A. Hamou-Lhadj, and M. Couture. On the comparison of user space and kernel space traces in identification of software anomalies. In 2012 16th European Conference on Software
Maintenance and Reengineering, pages 127–136, March 2012.
[20] Ohad Rodeh, Haim Helman, and David Chambliss. Visualizing block io workloads. ACM Transactions on Storage (TOS), 11(2):6, 2015. [21] Florian Wininger, Naser Ezzati-Jivan, and Michel R. Dagenais. A
declarative framework for stateful analysis of execution traces. Software
Quality Journal, pages 1–29, 2016. URL: http://dx.doi.org/10.1007/ s11219-016-9311-0.