HAL Id: hal-01006804
https://hal.archives-ouvertes.fr/hal-01006804
Submitted on 4 Mar 2019
HAL is a multi-disciplinary open access
archive for the deposit and dissemination of
sci-entific research documents, whether they are
pub-lished or not. The documents may come from
teaching and research institutions in France or
abroad, or from public or private research centers.
L’archive ouverte pluridisciplinaire HAL, est
destinée au dépôt et à la diffusion de documents
scientifiques de niveau recherche, publiés ou non,
émanant des établissements d’enseignement et de
recherche français ou étrangers, des laboratoires
publics ou privés.
Erodibility characterisation for suffusion process in
cohesive soil by two types of hydraulic loading
Huynh Tan Tai Nguyen, Didier Marot, Fateh Bendahmane
To cite this version:
Huynh Tan Tai Nguyen, Didier Marot, Fateh Bendahmane. Erodibility characterisation for suffusion
process in cohesive soil by two types of hydraulic loading. La Houille Blanche - Revue internationale
de l’eau, EDP Sciences, 2012, 6, pp.54-60. �10.1051/lhb/2012039�. �hal-01006804�
Erodibility characterisation for suffusion process in cohesive soil
by two types of hydraulic loading
Hong Hai NGUYEN
1, Didier MAROT
1, Fateh BENDAHMANE
11Institut GeM, l’Université Nantes Angers Le Mans LUNAM, CNRS
IUT de Saint-Nazaire, BP 420, 44606 Saint-Nazaire Cedex, France
e-mail: [email protected], [email protected], [email protected]
ABSTRACT. – An experimental program was set up to study the suffusion process by using a triaxial erodimeter devel-oped in our laboratory. This device is equipped with a multichannel optical sensor in order to characterize precisely the initiation and development of suffusion process. With the objective to characterize the erodibility of clayey sand, tests were performed under either flow-rate-controlled or hydraulic-gradient-controlled conditions. The test analysis allows distinguishing three steps. First, suffusion of a small quantity of clay is detected on downstream. In flow-rate-controlled conditions, this suffusion is immediately followed by a high increase of the hydraulic gradient which continues during the second step. The second step is characterized by very low amount of particles in the effluent. During the third step, high suffusion of clay appears and induces erosion of clay and sand. The results reveal the necessity to take into account the evolutions of hydraulic gradient (or pressure gradient) and also the evolutions of velocity (or flow rate) to represent the hydraulic loading. The analysis based on energy expended by fluid flow and eroded mass permits to characterize the soil sensitivity to clay suffusion and clayey sand erosion for tests under the two types of hydraulic loading.
Key words : Geotechnical engineering, erosion sensitivity, laboratory experiments, suffusion, energy, clayey sand.
Caractérisation de la sensibilité à la suffusion d’un sol cohésif
avec deux types de chargement hydraulique
RÉSUMÉ. – Un programme expérimental est réalisé afin d’étudier le processus de suffusion en utilisant un érodimètre triaxial développé au sein de notre laboratoire. Cet appareillage est équipé d’un capteur optique polychromatique afin de caractériser précisément l’initiation et le développement du processus de suffusion. Avec l’objectif de déterminer la sensibilité à l’érosion d’un sable argileux, des essais sont menés à débits imposés ou à gradients hydrauliques imposés. L’analyse des essais permet de distinguer trois étapes. Tout d’abord la suffusion d’une faible quantité d’argile est détec-tée à l’aval. A débit imposé, cette suffusion est immédiatement suivie par une forte augmentation du gradient hydraulique qui se poursuit au cours de la deuxième étape. La deuxième étape est également caractérisée par la présence d’une très faible quantité de particules dans l’effluent. Pendant la troisième étape, une importante suffusion d’argile apparaît et elle précède une érosion de sable argileux. Les résultats soulignent la nécessité de prendre en compte les évolutions du gradient hydraulique (ou du gradient de pression) et également celles de la vitesse (ou du débit) pour représenter le char-gement hydraulique. L’analyse basée sur la détermination de l’énergie dissipée par le fluide interstitiel et la masse érodée permet de caractériser la sensibilité du sol à la suffusion d’argile et à l’érosion de sable argileux pour les essais menés suivant les deux types de chargement hydraulique.
Mots clés : Ingénierie géotechnique, sensibilité à l’érosion, essais de laboratoire, suffusion, énergie, sable argileux.
I. INTRODUCTION
Suffusion describes the process of detachment and migra-tion of finer particles of soil in the pore space between the larger soil particles. With the objective to evaluate the likeli-hood of suffusion initiation, several criteria based on the study of grain size distribution have been proposed in lit-erature by [Kenney, 1985], [Li, 2008] among others. [Wan, 2008] concluded that the most widely used methods based on particle size distribution are conservative and they pro-posed a method for assessing internal instability of broadly graded silt-sand-gravel soils. This method is based on two ratios: d90/d60 and d20/d5 (where d90, d60, d20 and d5 are the
sieve size for which 90%, 60%, 20% and 5% respectively of the weighed soil is finer).
[Kovacs, 1981] recognized that even if the geometrical conditions allow particle movements, the hydraulic condi-tions have to be studied. To take into account the hydrau-lic loading, [Skempton, 1994] proposed to relate the onset of suffusion with a critical value of hydraulic gradient. [Perzlmaier, 2007] observed that the use of local hydraulic gradient improves the precision of onset of instability detec-tion and [Moffat, 2011] defined the occurrence of internal instability by the decrease with time in local hydraulic gra-dient. It is worth stressing that variations of local hydraulic gradient can be very different by several orders of magni-tude according to the specimen part considered [Sail, 2011]. Thus the detection of onset of instability based on local hydraulic gradient measurements may depend on the locali-zation of pressure transducers. Some detached particles can
be filtrated and this filtration can induce a clogging process within the soil accompanied with the decrease of the hydrau-lic conductivity [Reddi, 2000; Bendahmane, 2008; Marot, 2011a]. Therefore, variations of both seepage velocity and hydraulic gradient (or pressure gradient) have to be taken into account to evaluate the hydraulic loading.
In the case of cohesive soils, [Reddi, 2000] proposed to represent the porous medium by a system of parallel capil-lary tubes each of a constant radius r, which can be esti-mated by:
r K
n
= 8 (1)
where n is the porosity, K is the intrinsic permeability (K=k h/gw, where k is the hydraulic conductivity, h is the
dynamic viscosity and gw is the volumic weight of water). Thus by this approach, the hydraulic shear stress along a horizontal capillary tubes system can be expressed by:
τ = ∆ = ∆ ∆ ∆ P L r P L K n 2 2 (2)
where DP = PA – PB is the pressure drop between upstream section A and downstream section B of the specimen; DL is the distance between sections A and B. It is worth noting that in eq. (2), pressure gradient and permeability are both considered.
From results of interface erosion tests, [Marot, 2011b] proposed a new analysis based on the energy expended by seepage flow which is a function of flow rate and pressure gradient. Three assumptions were used: the fluid temperature is assumed constant, the system is considered as adiabatic and only a steady state is considered. The Reynolds number can be defined by:
Re =ρUd µ 0
where r is the unit mass of water, U the mean velocity in the pore, d0 the average capillary tube diameter of the
coarser fraction defined by Kovacs’s approach [Kovacs, 1981] and m the dynamic viscosity. In the case of the suf-fusion process, the value of the Reynolds number is rela-tively low (with a high value of hydraulic gradient i=150, on clayey sand specimen with initial value of hydraulic con-ductivity k = 10–5 m/s, R
e = 0.25 [Marot, 2012]). As the
value of Reynolds number is indicating laminar flow, it is assumed that energy is mainly dissipated in the erosion pro-cess. Finally, the power dissipated by suffusion process,
Perosion is expressed by:
Perosion =
(
γ ∆w z +∆P Q)
(3) where Dz = zA - zB, zA and zB are vertical coordinates ofsec-tion A and B respectively, Q is fluid flow rate. Dz > 0 if the flow is in downward direction, Dz < 0 if the flow is upward and the erosion power is equal to Q DP if the flow is hori-zontal. The energy dissipation Eerosion is the temporal
integra-tion of the instantaneous erosion power for the test duraintegra-tion. Concerning erosion sensibility classification, different methods were proposed in the case of interface erosion. The method proposed by [Wan, 2004] assumed a linear expres-sion between the rate of eroexpres-sion and the hydraulic shear stress. The gradient of this correlation was named erosion
rate coefficient kd. According to value of the erosion rate
index Ikd = -log(kd), [Wan, 2004] proposed six categories
varying from extremely slow to extremely rapid. Another method [Marot, 2011b] was based on an erosion resistance index as:
I Eroded dry mass Eerosion α= − log10 (4)
Depending on the values of Ia index, six categories of soil
erodibility were proposed from highly erodible to highly resistant. However, suffusion erodibility classification is not yet well established,
This paper describes triaxial erodimeter tests which were performed on clayey sand with seepage flow under either constant hydraulic gradient or constant injected flow rate. The characterization of soil sensibility to suffusion under the two types of hydraulic loading is evaluated by different methods including energy analysis.
II. TRIax Ia l ERODImETER
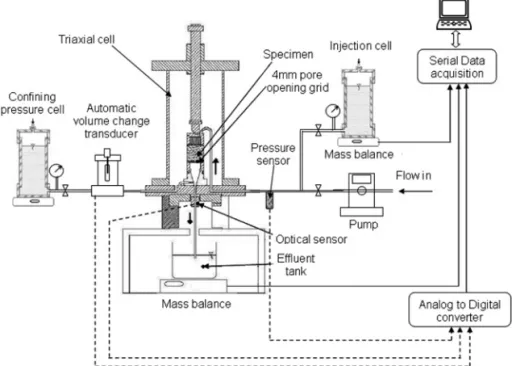
A triaxial erodimeter was designed to apply downward seepage flow on intact soil sample or on reconstituted soil specimen (see Figure 1). A detailed description of the device was reported by [Bendahmane, 2008] and a brief summary is provided hereafter.
The testing device comprises a modified triaxial cell which was designed to saturate the sample in upward direc-tion, to consolidate it under isotropic confinement and finally to force fluid through the sample in downward direc-tion. The system to generate seepage flow under constant hydraulic gradient comprises a pressure sensor and an injec-tion cell connected to air/water interface cylinder. Injecinjec-tion cell is continuously weighed in order to determine injected flow rate. The system to generate seepage flow in flow-rate-controlled conditions comprises a gear pump connected to a pressure sensor.
The sample is supported by a lower mesh screen of 4 mm opening size. The funnel-shaped draining system is con-nected to effluent tank by a glass pipe. Effluent tank is placed on a mass balance in order to continuously measure the effluent mass.
In the case of clay suffusion, the detection of suffusion is not accurate enough by weighing measurement or by visual observation. Thus a multichannel optical sensor was placed at the end of the draining pipe. Thanks to a previous cali-bration, the optical sensor allows measuring the clay con-centration, C, within the fluid which is expressed by the ratio of clay mass particles and water mass within the fluid. By neglecting the water mass change inside the sample, the eroded clay mass mclay can be computed [Marot, 2011a].
For a high value of clay concentration within effluent or when effluent contents sand grains, the mass solid measure-ment can be performed by continuous weighing as mass accuracy of a few milligrams is sufficient. The comparison of the voltages of each optical sensor LED makes it pos-sible to detect the presence of sand grains in the effluent [Marot, 2011a].
A confining pressure cell connected to an air / water interface cylinder is used to generate isotropic confinement. Sample volume change is measured by automatic volume change transducer connected between confining pressure cell and the inlet of triaxial cell.
III. PROPERTIEs Of s PECImENs
a ND TEs T PROCEDURE
III.1. material propertiesThe tested material is a mixture of 75% Fontainebleau sand (percentage by weight) and 25% Kaolinite Proclay. A laser diffraction particle-size analyzer was used to measure the grain size distribution of sand, clay and mixture. These measurements were performed with demineralised water and without deflocculation agent. As shown by Figure 2, the grain size distribution of such clayey sand is gap graded, the coarse fraction is composed of sand grains and the fine fraction corresponds to the clay fraction. By using the method proposed by [Wan, 2008] for assessing the poten-tial of suffusion, tested clayey sand would be placed in tran-sition zone (15/Log(D20/D5)=16 and 30/Log(D90/D60)=137).
III.2. s pecimen preparation
The mixture is prepared by mixing sand grains with a moisture content of 9%. Then, while mixing continues during 10 minutes, powder clay is progressively added. The specimens are prepared using a single layer semi-static
compaction technique with a 50 mm diameter and 50 mm high mould. The obtained value of dry unit weight is 16 kN/m3.
Specimen is placed in cell and a 15 kPa isotropic confine-ment pressure is applied. Carbon dioxide is injected followed by the saturation phase which requires approximately 24 h. Specimens were subjected to a seepage flow in downward direction with deaerated and demineralised water. Three tests, named N1, N2 and N3 were performed under controlled-flow-rate (values of flow rate were 1.2 cm3/min, 1.4 cm3/min
and 1.6 cm3/min respectively) and four tests, N4 to N7, under
controlled-hydraulic-gradient in the range of 5 to 18.
IV. TEs T REs Ul Ts
The erosion rate of clay is expressed per unit pore area by:
m t m t N S t clay clay p p
( )
=( )
(5)where mclay: eroded clay mass, Sp: average pore area with Sp=2 p r Dz; r: radius of average pore determined by eq. (1); Np: number of average pore calculated by:
N S n r p=
π 2 (6)
where S is the cross section of specimen.
IV.1. Effluent properties
Figure 3 shows the erosion rate of clay during the time for all performed tests. The optical detection of sand grains in effluent is indicated by the arrows in Fig. 3, at t=21 min for test N7, t=54 min for test N3, t=65 min for test N2 and t=64 min for test N1. When sand grains appear in effluent, concentration of clay cannot be computed.
Test N7, characterized by a high value of hydraulic gradient
i=18, exhibited great variations of erosion rate of clay. After
reaching in 40 s a peak of about 5 10-9 kg.s-1.m-2, erosion
rate decreased rapidly toward 10-10 kg.s-1.m-2, but at t=9 min,
another increase was measured up to 1.2 10-9 kg.s-1.m-2. f igure 1: Schematic diagram of the triaxial erodimeter.
f igure 2: Grain size distribution of clay, sand and clayey
Finally at t=21 min, the suffusion of clay was accompanied by erosion of sand grains. For tests N3 and N6, erosion rate increased slightly to reach 2 10-10 kg.s-1.m-2 after 3 min of
downward flow. Afterwards, erosion rate decreased slowly over time towards zero.
With a constant flow rate smaller than 1.6 cm3/min or
with a hydraulic gradient smaller than 10 (tests N1, N2, N4, N5) erosion rate of clay stayed near zero during 35 min. After 35 min, a sharp increase of erosion rate was meas-ured during flow-rate-controlled tests. Erosion rate exceeded 5 10-10 kg.s-1.m-2 for time between 51 min (test N3) to
60 min (test N1) and then suffusion clay was accompanied by sand erosion. At the same time, erosion rate of clay was about zero for tests N4, N5 and N6.
When suffusion clay is accompanied by sand erosion, the eroded mass of clay particles and sand grains is determined by continuous weighing. Figure 4 shows the instantaneous values of eroded mass. For flow-rate-controlled tests (N1, N2, N3), the increase of eroded mass was higher with a higher injected flow rate, whereas for test N7, under a high value of constant hydraulic gradient (i=18), the eroded mass led to an asymptote. It is worth stressing that for test N6 (i=10), finally after 235 min of seepage flow, sand erosion begun.
IV.2. s pecimen properties
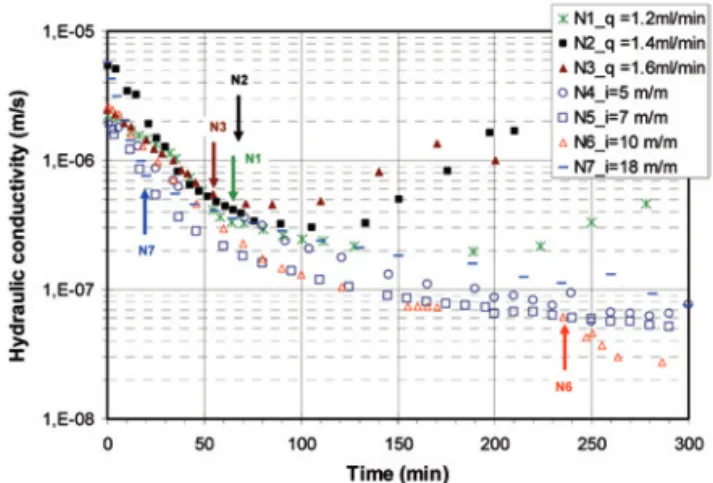
Variations of hydraulic conductivity with time of all tests are plotted in Figure 5. The initial value of hydraulic conductivity was ranging from 1.7 10-6m.s-1 (for test N5)
to 5.7 10-6m.s-1 (for tests N2 and N7). It can be noted that
hydraulic conductivity decreased during the whole dura-tion of hydraulic-gradient-controlled tests. In the case of flow-rate-controlled tests, after the hydraulic conductivity decrease, hydraulic conductivity increased with a final value between 4.7 10-7m.s-1 for test N1 and 1.7 10-6m.s-1 for test N2.
Figure 6 shows the instantaneous values of the hydraulic gradient which were measured during the flow-rate-con-trolled tests. Hydraulic gradient stayed constant over a few minutes only, with a value between 2.3 (test N2) and 5.5 (test N3). Then, hydraulic gradient increased continuously to reach about i=25 at t=55 min for test N3 and at t=66 min for tests N1 and N2. Afterwards, for tests N2 and N3, the hydraulic gradient stayed relatively constant for 1 hour fol-lowed by a sharp decrease, whereas for test N1, the hydrau-lic gradient kept on increasing up to 34. However, this sec-ond increase was lower than the previous and followed by a decrease towards average value of 18.
It is worth noting that hydraulic gradient i=25 occurred a few minutes after sand grains were detected in effluent. The detection of sand grains in effluent induced a great decrease of specimen volume. Nevertheless, for tests N4, N5 and N6 with t<235 min, a slight and continuous decrease of specimen volume could be measured during clay suffusion process without sand grain erosion.
Clay suffusion is probably not homogeneous but it seems to occur throughout the sample while clayey sand erosion first appears at the bottom of specimen and progresses in upward direction [Marot, 2009].
f igure 3: Erosion rate of clay vs time (insert: erosion rate
of clay below 2.10-10 kg.s-1.m-2).
f igure 4: Eroded mass vs time. Arrows show time detection
of sand grains in effluent.
f igure 5: Hydraulic conductivity vs time.
f igure 6: Hydraulic gradient vs time (flow-rate-controlled
V. DIs CUss ION
V.1. Characterization of suffusion sensibility by the mean of erosion rate
By using eq.(2) expressed for a system of horizontal capil-lary tubes, hydraulic shear stress is reformulated in the case of vertical system by:
τ= γ ∆ ∆ h L K n w 2 (7)
where h is the hydraulic head.
Figures 7a and 7b show the values of erosion rate of clay versus hydraulic shear stress computed by eq.(7). By select-ing some values, a linear correlation between erosion rate of clay and hydraulic shear stress can be built. The slope of this correlation corresponds to the kd coefficient. The range of
values of the erosion rate index, Ikd, was from 6.9 (test N7,
see Fig. 7a) to 9.8 (test N5, see Fig. 7b). However, as shown notably by the curve plotted for test N7, such approach implies to select only some values. Thus the value of kd
coefficient doesn’t characterize the soil erodibility for the whole duration of suffusion process.
Values of hydraulic shear stress don’t permit to estimate sand erosion as the corresponding values vary from 0.02 Pa (test N6, see arrow in Fig. 7b) to 0.12 Pa (test N3, see arrow in Fig. 7a).
The erosion power is calculated using eq.(3) for all tests and the erosion rate of clay versus erosion power is plotted in Fig. 8. The selection of some values allows defining lin-ear correlation with a slope corresponding to the coefficient a proposed by [Regazzoni, 2011] as:
α = m Perosion (8)
With a similar approach of the erosion coefficient, the parameter –log a was computed. For tests characterized by great clay suffusion (tests N1, N2, N3 and N7) the values of –log a are within the range: 4.82 to 5, whereas for tests N4, N5 and N6, the values are from 6.58 to 6.81. Thus these values don’t lead to a unique erodibility clas-sification.
These results show up the necessity to take into account the history of the hydraulic loading on one hand, and the evolution of the corresponding specimen answer on the other hand. With the objective to characterize independently the hydraulic loading and the induced surface erosion, [Marot, 2011b] proposed to compute by trapezoidal rule the energy dissipated by erosion (Eerosion) and to measure the cumulative
eroded dry mass. The erosion resistance index is calculated by eq.(4) and the obtained values during the whole test dura-tion are plotted in Fig. 9.
(a) Tests N1, N2, N3, N7 (b) Tests N4, N5, N6
f igure 7: Erosion rate of clay vs hydraulic shear stress. Arrows show time detection of sand grains in effluent.
(a) Tests N1, N2, N3, N7 (b) Tests N4, N5, N6
During the development of suffusion process, erosion resistance index reached a maximum value in a few minutes ranging from 4.8 (test N7) to 5.2 (test N1). For tests N4 and N5, erosion resistance index stayed constant during the remaining of test duration at around 4.9 and 5 respectively. For tests N1, N2, N3, N6 and N7, detection of sand grains in effluent was associated with a value of erosion resistant index between 4 (test N2) and 4.3 (test N7). The develop-ment of sand erosion induced a decrease of erosion resist-ance index which led to an asymptote value ranging from 2 (test N3) to 2.3 (tests N1, N6 and N7).
Thus for the tested soil, clay suffusion development was characterized by erosion resistance index about 5, initia-tion of sand and clay erosion was associated with a aver-age value of erosion resistance index about 4.1, and finally just before the failure of specimen, erosion resistance index was about 2.1. According to the erosion resistance index, the obtained classification of erosion processes was identi-cal for hydraulic-gradient-controlled tests and for flow-rate-controlled tests.
VI. CONCl Us ION
By using a triaxial erodimeter, tests on clayey sand were performed involving seepage flow in downward direction under either hydraulic-gradient-controlled or flow-rate-con-trolled conditions. Suffusion of clay particles is accompanied by filtration of a part of the detached clay particles. This process induces a decrease of hydraulic conductivity and in the case of flow-rate-controlled tests an increase of hydraulic gradient is also measured. Under a high hydraulic gradient or under flow-rate-controlled conditions, clay suffusion leads to sand and clay erosion which induces a great decrease of specimen volume.
Measurements of instantaneous variations of specimen hydraulic properties together with erosion rate of clay reveal that it is necessary to take into account the variations of hydraulic gradient (or pressure gradient) and the variations of velocity (or water flow rate) to represent hydraulic load-ing. Methods characterizing the erosion sensibility which are based on rate of erosion cannot allow obtaining a unique characterization of suffusion process for the whole test dura-tion. Thus, such approaches don’t permit the estimation
of the development of clay suffusion and the initiation of clayey sand erosion. The proposal erosion resistance index leads to a similar erodibility classification for hydraulic-gradient-controlled tests and flow-rate-controlled tests. These results demonstrate that this approach is efficient to char-acterize clay suffusion development and also the induced clayey sand erosion.
VII. aC k NOwl EDgm ENTs
The authors thank the World Bank (Project TRIG, University of Danang, Vietnam), the French National Research Agency (ANR-ERINOH) and the French Institute for Applied Research and Experimentation in Civil Engineering (IREX) for providing financial support for this work.
VIII. REf ERENCEs
Bendahmane F., marot d., alexis a. (2008) — Parametric study of suffusion and backward erosion. doi: 10.1061/ (ASCE)1090-0241(2008)134:1(57. Journal of Geotechnical
and Geoenvironmental Engineering. 134(1) : 57-67
Kenney t.C., lau d. (1985) — Internal stability of granular filters.
Canadian Geotechnical Journal. 22 : 215-225
Kovacs G. (1981) — Seepage hydraulic, Elsevier Scientific
Publishing Co, Amsterdam.
li m., Fannin J. (2008) — Comparison of two criteria for internal stability of granular soil. Canadian Geotechnical Journal. 45 : 1303-1309
marot d., Bendahmane F., rosquoët F., alexis a. (2009) — Internal flow effects on isotropic confined sand-clay mixtures.
Soil & Sediment Contamination, an International Journal.
18(3) : 294-306
marot d., Bendahmane F., Konrad J.m. (2011a) — Multichannel optical sensor to quantify particle stability under seepage flow. doi:10.1139/T11-074. Canadian Geotechnical Journal. 48 : 1772-1787
marot d., regazzoni P.l., Wahl t. (2011b) — Energy based method for providing soil surface erodibility rankings. doi: 10.1061(ASCE)GT.1943-5606.0000538. Journal of
Geotechnical and Geoenvironmental Engineering. 137(12) :
1290 – 1294
marot d., le V.d., garnier J., thorel l., audrain P. (2012) — Study of scale effect in an internal erosion mechanism; doi.org/10.1080/19648189.2012.667203. European Journal of
Environmental and Civil Engineering. 16(1) : 1–19
moFFat r., Fannin r.J., garner s.J. (2011) — Spatial and tem-poral progression of internal erosion in cohesionless soil. doi:10.1139/T10-071. Canadian Geotechnical Journal. 48(3) : 399-412
Perzlmaier s., muCKenthaler P., KoeleWiJn a.r. (2007) — Hydraulic criteria for internal erosion in cohesionless soil.
Assessment of risk of internal erosion of water retaining struc-tures: dams, dykes and levees. Intermediate Report of the
European Working Group of ICOLD. Technical University of Munich, Munich, Germany. 30-44
reddi l.n., lee i., Bonala m.V.s. (2000) — Comparison of inter-nal and surface erosion using flow pump test on a sand-kao-linite mixture. Geotechnical Testing Journal. 23(1) : 116-122
regazzoni P-l, marot d. (2011) — Investigation of inter-face erosion rate by Jet Erosion Test and statistical analy-sis. doi:10.3166/ejece.15.1167-1185. European Journal of
Environmental and Civil Engineering. 15(8) : 1167-1185
sail y., marot d., siBille l., alexis a. (2011) — Suffusion tests on cohesionless granular matter. doi: 10.3166/ejece.15.799-817.
European Journal of Environmental and Civil Engineering.
15(5) : 799-817
sKemPton a.W., Brogan, J.m. (1994) — Experiments on piping in sandy gravels. Géotechnique. 44(3) : 440-460
Wan C.F., Fell r. (2004) — Experimental investigation of internal instability of soils in embankment dams and their foundations.
Uniciv Report R-429. University of New South Wales, Sydney.
Wan C.F., Fell r. (2008) — Assessing the potential of inter-nal instability and suffusion in embankment dams and their foundations. Journal of Geotechnical and Geoenvironmental