HAL Id: tel-00988255
https://tel.archives-ouvertes.fr/tel-00988255
Submitted on 7 May 2014
HAL is a multi-disciplinary open access archive for the deposit and dissemination of sci-entific research documents, whether they are pub-lished or not. The documents may come from teaching and research institutions in France or abroad, or from public or private research centers.
L’archive ouverte pluridisciplinaire HAL, est destinée au dépôt et à la diffusion de documents scientifiques de niveau recherche, publiés ou non, émanant des établissements d’enseignement et de recherche français ou étrangers, des laboratoires publics ou privés.
Probabilistic and constraint based modelling to
determine regulation events from heterogeneous
biological data
Andrés Octavio Aravena Duarte
To cite this version:
Andrés Octavio Aravena Duarte. Probabilistic and constraint based modelling to determine regulation events from heterogeneous biological data. Other [cs.OH]. Université Rennes 1, 2013. English. �NNT : 2013REN1S151�. �tel-00988255�
ANNÉE 2013
!
THÈSE / UNIVERSITÉ DE RENNES 1
sous le sceau de l’Université Européenne de Bretagne
En Cotutelle Internationale avec
Universidad de Chile
pour le grade de
DOCTEUR DE L’UNIVERSITÉ DE RENNES 1
Mention : Informatique
Ecole doctorale Matisse
présentée par
Andrés Octavio A
RAVENA
D
UARTE
préparée à l’unité de recherche IRISA – UMR6074
Institut de Recherche en Informatique et Système Aléatoires
(Composante universitaire)
Probabilistic and
constraint based
modelling to
determine
regulation
events from
heterogeneous
biological data
Thèse à soutenir à Santiago le 13 décembre 2013
devant le jury composé de :
Servet MARTÍNEZ
Professeur, Universidad de Chile / Président
Edgardo UGALDE
Professeur, Universidad Autónoma de San Luis Potosi, Mexico / Rapporteur
David SHERMAN
Directeur de recherche, INRIA Bordeaux Sud-Ouest /
Rapporteur
Marie-Odile CORDIER
Professeur à l’Université de Rennes 1 / Examinatrice
Alexander BOCKMAYR
Professeur, Freie Universität Berlin / Examinateur
Nancy HITSCHFELD
Professeur, Universidad de Chile / Examinatrice
Anne SIEGEL
Directrice de recherche, CNRS, Rennes / Directrice de thèse
Alejandro MAASS
To my parents To Esra
Acknowledgements
I have the deepest appreciation for my two advisors: Anne Siegel and Alejandro Maass. Their advise and encouragement were key to the completion of this thesis. Thank you from the bottom of my heart.
I also thank to the members of the jury for their time and consideration to me.
While I developed this thesis I enjoyed the hospitality of the Symbiose/Dyliss team at IRISA in Rennes, which was a memorable experience. I made a lot of new friends, too much to mention all of them here without making an involuntary omission. Please excuse me for mentioning only a few. I am indebted to Catherine Belleannée, Fabrice Legeai, Olivier Quenez, Santiago Videla and Olivier Sallou, who were my officemates. I also appreciate the hospitality of Jacques Nicolas and Dominique Lavenier.
I enjoyed interesting discussions with Carito Vargas-Guziolowzki, Jeremie Bourdon, Damien Eveillard, Sven Thiele and Torsten Schaub. In my visits to Heidelberg, Nantes and Potsdam I also enjoyed their hospitality.
In Chile I am truly grateful to the CMM directors, Jaime San Martín and Alejandro Jofré, which were kind to gave me all the facilities to pursue this thesis until its con-clusion. I thank to the Departamento de Ingeniería Matemática for hosting me again as a student, and helping me in this challenge. I convey my personal thanks to all my coworkers at the Laboratory of Bioinformatics and Mathematics of Genome, in par-ticular Vicente Acuña, Rodrigo Assar and Nicolás Loira that had the patience to bear with me.
I thank Alejandra Medina-Rivera, Heladia Salgado and Julio Collado-Vides for useful discussions about RegulonDB database interpretation and use.
I am indebted to my parents and the rest of my extended family that supported me while I moved back and forth between France and Chile. My friend Sofía Hidalgo was particularly large-hearted. Finally my most heartfelt appreciation to Esra Özgür, whose presence in my life is a constant source of energy and motivation. ˙Iyi ki varsın. I am thankful for the mobility grants from the International College Doctoral (IDC) of Université Européenne de Bretagne (UEB), from INRIA-Conicyt 2010 mobility grant 2010–55 and from “Estadías cortas de Investigación para Estudiantes de Doctorado de
la Universidad de Chile” grant.
This work was funded by the Center for Genome Regulation (Fondap 15090007), Uni-versidad de Chile; the Laboratory of Bioinformatics and Mathematics of Genome at the Center for Mathematical Modeling (Basal Grant), UMI 2807 CNRS-Universidad de Chile; by the INRIA-U. de Chile IntegrativeBioChile Associate Team.
Contents
Résumé 1
Summary 5
1 Introduction 9
1.1 What is gene expression? . . . 12
1.2 Measuring gene expression . . . 13
1.2.1 Methods based on hybridization . . . 13
1.2.2 Methods based on sequencing . . . 15
1.3 Regulation discovery methods . . . 15
1.3.1 Gene influence networks . . . 16
1.3.2 Gene regulation networks . . . 20
1.3.3 Our proposal: an integrative method . . . 24
2 From Correlations to causalities: Theoretical Insights 25 2.1 Arc minimal subgraphs . . . 25
2.2 Minimum weight subgraphs . . . 28
2.3 Subgraphs with minimum weight paths . . . 30
2.4 Implementation and test run . . . 31
2.4.1 Answer Set Programming representation . . . 33
2.4.2 Confirmation of the complexity in a real case . . . 34
2.5 Conclusion . . . 34
3 Biological evaluation and benchmark onE.coli 37 3.1 Protocol to build the initial graphG . . . 37
3.1.1 Defining the arc weights . . . 39
3.1.2 Discrete weights of arcs for an efficient execution . . . 40
3.1.3 Contraction using operon information . . . 40
3.1.4 Gold standard . . . 41
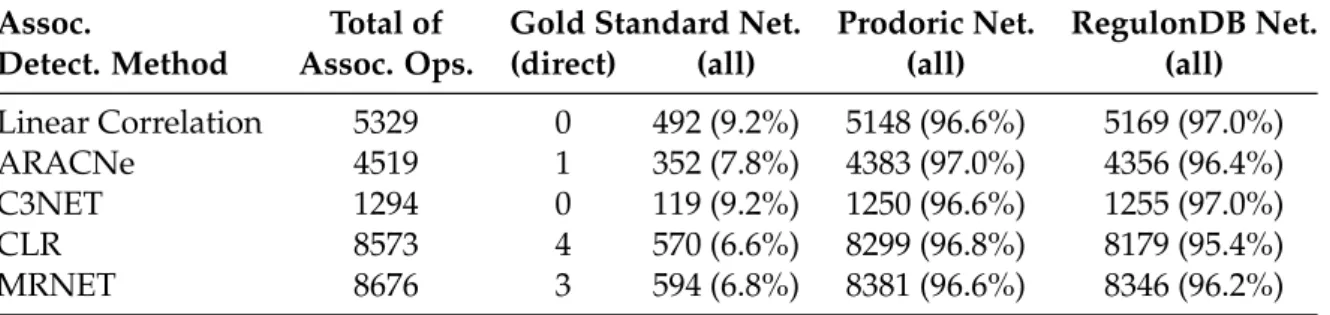
3.2 Protocol to buildO, the set of associated operons . . . 42
3.2.1 Associations explained by the Prodoric, RegulonDB and gold standard networks . . . 42
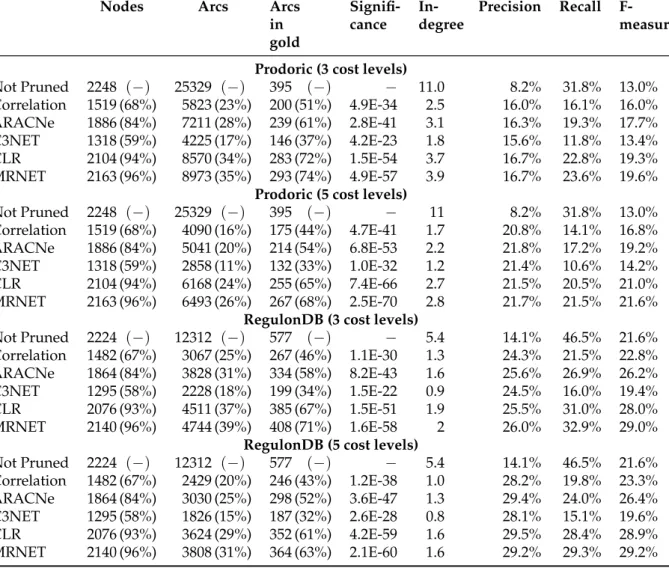
3.3.1 Explained gene associations . . . 44
3.3.2 Meaningful size reduction . . . 44
3.3.3 Precision and Recall . . . 44
3.3.4 Statistical significance . . . 47
3.3.5 In-degree reduction . . . 47
3.4 Ranking of global regulators . . . 48
3.5 Discussion . . . 50
4 Application toA.ferrooxidans case 53 4.1 Background . . . 53
4.2 Characteristics of available sequence data . . . 56
4.3 Challenges in expression analysis . . . 57
4.3.1 Proposed analysis method . . . 58
4.4 Results . . . 59
4.5 Conclusions . . . 63
5 A classification method to find regulons in Eukarya 65 5.1 Background . . . 66
5.2 Training a classifier under uncertainty for completing a network . . . 67
5.2.1 Feature selection for target gene discovery . . . 67
5.2.2 Classification using CART . . . 68
5.2.3 Building classifiers under partial knowledge for completing a network . . . 70
5.2.4 Combining multiple CART classifiers . . . 71
5.2.5 Alternatives for a combined index . . . 73
5.3 Cross-validation and comparison with other methods . . . 74
5.4 Some proposed target genes . . . 76
5.5 Ranking of relevant transcription factors . . . 77
5.6 Conclusions . . . 78
6 A mathematical model for oligonucleotide design 81 6.1 Background . . . 81
6.2 Oligoarray design problem . . . 83
6.3 Heuristic approaches . . . 84
6.3.1 Kane rules . . . 86
6.3.2 Validating Kane rules . . . 86
6.3.3 Example of application . . . 89
6.4 Thermodynamic model approach . . . 89
6.4.1 Standard nearest neighbor model of DNA duplex energy . . . 91
6.4.2 Change in luminescence as consequence of single nucleotide mis-match . . . 91
6.4.3 Experimental design . . . 93
6.4.4 Hybridization results . . . 93
6.5 Position dependent nearest neighbor model . . . 96
6.5.1 Evaluation . . . 97
6.5.2 Results of weighted model fitting . . . 99
6.5.3 Predicting family-wise factor Bj from sequence . . . 99
6.6 Conclusion . . . 101
Résumé
Cette thèse traite de la reconstruction de réseaux de régulation génétique. Elle est ba-sée sur l’intégration de données hétérogènes de sources biologiques différentes. Une croissance exponentielle de la taille des bases de données biologiques contenant, entre autres, des séquences de gènes, des génomes, des protéines et des résultats d’expéri-mentations d’expression de gènes a été observée ces vingt dernières années. En termes profanes, ces éléments peuvent être vus comme les composants d’un système méca-nique complexe. Nous pouvons décrire métaphoriquement une cellule comme une horloge mécanique, l’information génétique constituant les plans de chacun de ses grenages. Cette thèse a pour but de décrire comment s’articulent et s’ajustent ces en-grenages et comment ils s’enchaînent et se meuvent pour un résultat donné. L’objectif à long terme de ce travail est donc de décrire avec précision ces interactions de ma-nière à prédire ensuite les effets d’un changement dans le mécanisme et, en principe, à déterminer quelles modifications sont nécessaires pour obtenir un résultat souhaité. Formellement, cette thèse traite des réseaux de régulation de gènes, une abstraction qui décrit les interactions entre les gènes régulées et leurs gènes régulateurs. Plusieurs méthodes ont déjà essayé de lever le voile sur le réseau de régulation réel d’un orga-nisme donné. Dans cette thèse, nous proposons une méthode qui construit un réseau de régulation causal produisant un faible taux de faux positif. En ce sens, notre mé-thode construit des réseaux de régulation qui sont plus proches de la réalité que ceux obtenus avec les méthodes traditionnelles.
La première contribution de cette thèse est l’intégration des données hétérogènes pro-venant de deux méthodes de prédiction de réseaux pour déterminer une explication causale de toutes les coexpressions de gènes observées.
La compréhension actuelle des mécanismes de transcription cellulaire considère que les gènes régulateurs sont ceux qui codent pour des facteurs de transcription qui sont des protéines qui se lient à l’ADN et qui promeuvent, améliorent, inhibent ou bloquent ainsi l’expression d’autres gènes. Les expériences microbiologiques qui déterminent explicitement quels sont les gènes qui codent pour des facteurs de transcription et quels sont ceux qui sont régulés par ces premiers constituent une importante base de connaissance. Ces expériences sont complexes et coûteuses à réaliser. Il est difficile-ment envisageable de ne compter que sur elles pour aboutir à la construction du
ré-seau. Nous avons donc envisagé plusieurs approches bioinformatiques pour complé-ter ces expériences. Ces données expérimentales provenant d’espèces modèles seront ainsi utilisées comme étalon pour évaluer la qualité des méthodes mathématiques et informatiques présentées dans ce manuscrit.
Une partie des méthodes utilisent des données d’expression différentielle pour évaluer empiriquement les influences entre deux gènes en mesurant leur index d’information mutuelle. Les relations significatives alors sélectionnées sont celles dont l’information mutuelle satisfait un certain critère défini pour chaque méthode. Ces méthodes sont utiles quand un grand nombre d’expériences d’expression de gènes sont disponibles, incluant des activations ou des inhibitions de gènes. L’un des inconvénients de ces méthodes est l’impossibilité de déterminer la relation de causalité, c’est-à-dire quel est le gène régulateur et ceux qui sont régulés. Ces méthodes sont également mises en défaut lorsque deux gènes liés sont régulés par un troisième qui n’apparaît pas dans les données. La corrélation n’implique pas la causalité. Il n’y a pas d’explication “physique” du comportement observé.
D’un point de vue mathématique, le problème de la détermination des relations de ré-gulation à partir des données d’expression est habituellement indéterminés. Le nombre de gènes d’un organisme donné varie de l’ordre de quelques milliers à quelques des dizaines de milliers. Le nombre d’interactions mettant ces gènes en jeu est quant à lui estimé à un ordre de magnitude plus important tandis que le nombre d’expériences relevant ces interactions dépasse rarement les quelques centaines.
Une approche différente est d’utiliser une séquence génomique. Nous pouvons déter-miner quels sont les gènes qui peuvent être des régulateurs en testant par homologie la compatibilité de leur produit avec les facteurs de transcription connus. Chaque pré-diction d’un gène régulateur est caractérisée par un score et une p-valeur. Les facteurs de transcription s’associent à des sites qui dans la majorité des cas sont décrits par une séquence de consensus, une expression régulière ou une matrice de scores spécifiques des positions. Beaucoup d’outils utilisent ces descriptions pour déterminer les sites de liaison (binding sites) supposés. Ce sont les relations de causalité : un arc va de chaque gène régulateur vers chaque gène qu’il régule. L’inconvénient de ces méthodes est la faible spécificité de la prédiction. La taille du réseau proposé est habituellement dix fois plus grand que celle attendue. La majorité des relations de régulation sont des faux positifs.
Pour expliquer la dépendance de l’expression de deux gènes donnés, nous devons considérer les scénarios de régulation transcriptionnelle alternatifs suivants :
(i) le gène A régule directement le gène B,
(ii) le gène A régule indirectement le gène B (via un ou plusieurs gènes intermédiaires),
(de façon directe ou indirecte).
Une approche similaire a été mise en œuvre par Haverty et al. (2004). Ces auteurs ont exploré l’idée de grouper des gènes qui semblent être coregulés et de rechercher leur(s) facteur(s) de transcription commun(s), mais seulement en ne considérant que le scénario (i). Les scénarios alternatifs (ii) et (iii) n’ont pas été considérés. Notre méthode tient compte d’un important ensemble de régulations indirectes ; ce qui rend notre pro-blème difficile à résoudre. Novershtern et al. (2011) ont également utilisé un “modèle physique” basé sur un réseau bayésien pour expliquer les observations expérimen-tales. Notre méthode est différente. Elle consiste en une énumération de cas cohérents comme nous allons le détailler par la suite.
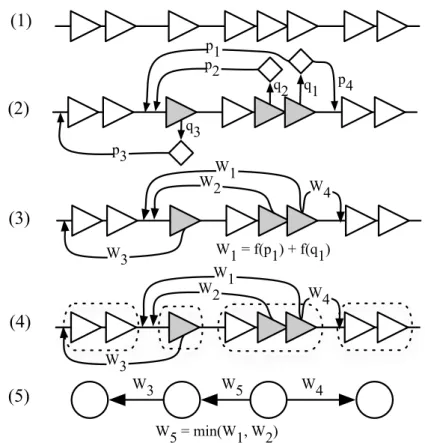
La seconde contribution de cette thèse est la modélisation de cette intégration sous la forme d’un problème d’optimisation combinatoire. Nous avons décrit ce problème de façon formelle comme étant un problème de minimisation. Nous avons recherché, dans le réseau candidat, des sous-graphes qui sont cohérents avec les observations expérimentales représentées par le réseau d’influences et qui minimisent une fonction de score global. Nous avons analysé la complexité calculatoire de cette approche et nous avons prouvé que ce problème est difficile. Nous avons en particulier présenté une preuve que ce problème appartient à la catégorie des problèmes NP-dur. Cette preuve a été accepté à la 15th International Conference on Verification, Model Checking, and Abstract Interpretation VMCAI 2014.
Étant donné sa difficulté, nous avons proposé également une approche heuristique pour obtenir une solution approchée du problème. Ceci est la troisième contribution de cette thèse. Cette solution approchée consiste en une simplification du problème. Nous avons réduit la taille du problème en ne considérant que les combinaisons de chemins de poids minimaux plutôt que la combinaison de l’ensemble des arcs. Cette réduction est significative sur les données réelles et nous permet d’obtenir des résultats concrets sur la très étudiée bactérie E. coli. Nos évaluations que notre réseau offre une meilleure précision que les réseaux candidats construits par les outils traditionnels. Une publication sur ce travail est en cours de soumission à PLoS Computational Biology. Ces méthodes ont été appliquées sur un autre cas biologique. La bactérie Acidithiobacil-lus ferrooxidans, qui n’est pas un organisme modèle mais qui intervient dans d’impor-tantes applications industrielles, présente un défi pour la détermination expérimentale de son réseau de régulation. Nous avons utilisé nos outils pour proposer un réseau de régulation candidat, puis nous l’avons analysé afin de mettre en évidence le rôle de ces régulateurs centraux. Ceci constitue la quatrième contribution de cette thèse.
Dans une seconde partie de cette thèse, nous avons exploré comment ces réseaux de régulations entrent en jeu dans un cas de santé humaine. Nous n’allons plus nous inté-resser à une reconstruction du réseau à l’échelle du génome, mais plutôt à un pathway spécifique qui n’est que partiellement connu et qui nécessite d’être complété. La
littéra-ture révèle que 55 gènes impliqués dans la réponse aux perturbations dans le pathway de la Wnt/beta-catenine, qui a été décrit comme intervenant dans la maladie d’Alzhei-mer. Dans cette thèse, nous proposons de caractériser ces gènes cibles par la présence de certains sites de régulation en aval de chaque gène du génome humain. En opposition aux classiques problèmes de classification, nous ne connaissons pas explicitement l’en-semble des gènes qui sont les cibles de ce pathway. Nous avons développé un schéma de classification qui étend les arbres de classification et de régression (CART) en utili-sant de multiples classificateurs et un schéma de vote qui nous permet de regrouper les cibles connues avec les gènes qui ne sont pas distinguables d’elles. Ces nouveaux gènes ont été validés expérimentalement, ce qui confirme la qualité de la prédiction. Ce travail a été publié dans BMC Genomics (2010).
En complément de cette thèse, nous ajoutons le problème mathématique de la concep-tion des sondes de microarray, l’un des outils utilisés pour produire les informaconcep-tions nécessaires pour les modèles décrits. La plupart des expressions différentielles sont mesurées en utilisant des microarray. Ces outils utilisent des sondes conçues pour détecter des molécules d’acide nucléique par hybridation spontanée. La plupart des outils actuels utilisés pour cette conception font usage de l’heuristique proposée par Kane (2000). La conception exacte de ces sondes nécessite un modèle théorique de l’hybridation thermodynamique des oligonucléotides liés à une surface de verre. Nous avons montré que les modèles de thermodynamique classique pour les oligonucléo-tides en solution ne sont pas utilisables dans ce cas. Nous avons utilisé un modèle mo-difié de l’énergie du plus proche voisin et nous avons évalué ses paramètres possibles à partir des données expérimentales. Nous avons conclu que pour pleinement prédire d’hybridation dynamique, un modèle d’énergie modifié pour la structure secondaire de l’ADN est nécessaire. Nous proposons un plan de recherche pour une telle fonc-tion. Ce nouveau modèle nous permettra de concevoir de meilleurs outils de mesure qui nous donneront des profils d’expression avec moins de bruit, ce qui se traduira par des réseaux d’interactions plus précises. De meilleurs outils de mesure permettent mieux prédire les réseaux de régulation.
Summary
This thesis deals with the reconstruction of genetic regulation networks. It is based on the integration of heterogeneous data from different biological sources. The last two decades have seen an explosive growth in the size of the databases containing sequences of genes, genomes, proteins and results gene expression experiments. In layperson terms this can be described as a compendium of parts of a mechanism. If we describe metaphorically a cell as a mechanical clock, the genetic information is the blueprint that describes each one of the gears. This thesis aims to describe how these gears are interconnected and how they interact for a given outcome. The long term goal is to describe accurately these interactions in a way that allow us to predict the effect of a change in the mechanism and, in principle, determine which modifications have to be made to obtain a desired result.
Formally this thesis deals with gene regulatory networks, an abstraction that describes the interactions between regulator genes and regulated ones. Many methods have been proposed to unveil the real regulatory network of a given organism. In this thesis we propose a method to build realistic causal regulatory networks, in the sense that they have a low false positive rate. In this sense our method predicts a regulatory network that is closer to the real one than the networks built with traditional methods. The first contribution of this thesis is to integrate heterogeneous information from two kinds of network predictions to determine a causal explanation to all observed gene co-expressions.
The current understanding of the cellular transcription mechanism considers that reg-ulator genes are those that code for transcription factors, that is proteins that can bind to DNA and promote, enhance, inhibit or block the expression of other genes. Microbio-logical experiments to determine explicitly which genes code for transcription factors and which ones are regulated by them have resulted in a modest but important base of knowledge. These experiments are complex and expensive, so it is not expected that the whole picture can be determined using only these means. Instead, many bioinfor-matic approaches have been considered. The experimental data, coming from model organisms, is then used as a gold standard to evaluate the quality of the mathematical models and computational methods proposed in this thesis.
Some methods use differential expression data to empirically evaluate the influence between two genes by measuring the mutual information index, and then selecting as relevant relationships the ones whose mutual information satisfies certain criteria defined by each method. These methods are useful when a big number of gene ex-pression experiments results are available. One disadvantage of these methods is that they do not determine a causal relationship. That is, we do not know which gene is the regulator and which ones are the regulated. It may also be the case that two genes seem to be related but they are instead regulated by a third one that is not visible in the data. The correlation does not imply causality, there is no “physical” explanation of the observed behavior.
From the mathematical point of view the problem of determining the regulation rela-tionships from the expression data is usually underdetermined. In a given organism there are usually in the order of thousands to tens of thousands of genes, the number of interactions is expected to be one order of magnitude bigger, while the number of experiments is often in the order of hundreds.
A different approach is to use the genomic sequence. We can determine which genes can plausibly be regulators by comparing by homology their product to known tran-scription factors. Each prediction of a regulator gene is characterized by a score and a p-value. The transcription factors bind in sites that, in many cases, have been charac-terized either by a consensus sequence, a regular expression or a position specific score matrix. Many tools use these descriptions to determine putative binding sites. These binding site predictions are also characterized by a p-value. With these predictions we can build a putative regulatory network connecting the predicted regulators with the genes located downstream of the predicted binding sites. These are causal relation-ships: there is an oriented arc from every regulator gene to each regulated one. The disadvantage of these methods is the low specificity of the predictions. This putative network is usually ten to twenty times bigger than the expected size. The majority of the regulation relationships are false positives.
To explain the dependence of expression of two given genes one must consider the following alternative transcriptional regulation scenarios:
(i) gene A directly regulates gene B,
(ii) gene A indirectly regulates gene B (via one or more intermediary genes), and
(iii) gene A and gene B are both co-regulated by a third gene X (directly or indirectly).
A similar approach was taken by Haverty et al. (2004) where the authors explore the idea of grouping genes likely to be co-regulated and finding their common transcrip-tion factor but focus their approach mainly on scenario (i), without considering alter-native scenarios (ii) and (iii). Our method considers a wider set of indirect regulations, resulting in a harder problem. In Novershtern et al. (2011), the authors also use a
“physical model” to explain the experimental evidence, using a bayesian network ap-proach. Our method takes a different approach, namely an exhaustive enumeration of coherent cases, as detailed in the following.
The second contribution of this thesis is to model this integration as a combinatorial optimization problem. We state the problem in formal terms as a minimization prob-lem. We consider the putative network built with classical tools as a weighted directed graph, with arc weight defined as a function of the p-values of the transcription factors and binding sites predictions. We look for the subgraphs of this putative network that are coherent with the experimental evidence represented in the influence network and that minimize a score function. We analyze the computational complexity of this ap-proach and prove that this problem is not easy. Specifically we show that this problem belongs to the NP-hard complexity category. This analysis was accepted at the 15th In-ternational Conference on Verification, Model Checking, and Abstract Interpretation VMCAI 2014.
In order to have an approximate solution in a practical execution time we propose also an heuristic approach. This is the third contribution of this thesis. The proposed sim-plification reduces the size of the problem by considering combinations of minimal weight paths instead of the full set of arcs. In realistic cases this reduction is significant and allowed us to obtain concrete results in a toy problem in the well studied bacteria E.coli. Our evaluation show that the network resulting of our method has better pre-cision than the putative regulation network built with traditional tools. A publication on this subject is being submitted to PLoS Computational Biology.
Once these methods have been implemented we use them in a new biological case. The bacteria Acidithiobacillus ferrooxidans, which is not a model organism and has important industrial applications, presents particular challenges for the experimental determina-tion of its regulatory network. Using the tools we developed we were able to propose a putative regulation network and analyze it in order to put in relevance the role of its core regulators. This is the fourth contribution of this thesis.
In a second part of this thesis we explore how these regulatory relationships manifest themselves in a human health related case. Here we no longer focus on a genome scale network reconstruction but instead in a specific pathway which is partially known and has to be completed. Previous knowledge has shown that 55 genes are involved in the response to perturbations in the Wnt/beta-catenine pathway, in a process which has been described as related to the Alzheimer’s disease. In this thesis we propose to characterize these target genes by the presence of some regulation binding sites in the upstream region of each gene in the human genome. In contrast to the classical classifi-cation problems here we do not know explicitly the set of genes which are not target of this pathway. We developed a classification scheme that extends the Classification and Regression Trees (CART) using multiple classifiers and a voting scheme that allows
us to group the known targets and those genes which are not distinguishable from them. These new genes were proposed for experimental validation, which confirmed the prediction. This work was published in BMC Genomics (2010).
As an addendum to this thesis we address the mathematical problem of designing microarray probes, one of the tools used to produce the information needed for the models described. Most of the differential expression data is measured using the mi-croarray technique. These tools are composed of an array of probes designed to de-tect specific nucleic acid molecules by spontaneous hybridization. Most of the current tools used for this design use heuristic rules proposed by Kane (2000). The exact de-sign of these probes requires a theoretical model of the hybridization thermodynamics of oligonucleotides bound to a glass surface. We show that classical thermodynamical models for oligonucleotides in solution are not applicable in this case. We use a mod-ified nearest neighbor energy model and evaluate its parameters from experimental data. We conclude that to fully predict the hybridization dynamics a modified energy model for secondary DNA structure is required. We propose a research plan to de-termine such function. This new model will allow us to design better measurement tools that will give us expression profiles with less noise, which in turn will result in more precise interaction networks. Better measurement tools enable better predictions of regulatory networks.
Chapter 1
Introduction
In the last two decades molecular biologist have developed several tools to measure the expression levels of all the genes of an organism simultaneously. When these experi-ments are performed under different environmental conditions the expression levels of the genes change. In some cases the change of expression of a gene is not independent from the expression of other genes, we say that they are coexpressed. This effect can be quantified.
The question that arises naturally is why the expressions of two given genes are corre-lated. To solve this question we have to consider the biological process of gene tran-scription. The current understanding of the transcription mechanism introduces the concept of transcriptional regulation, the fact that the expression of some genes can trigger or block the expression of others. The observed gene expression correlation can then be the consequence of one gene regulating another, or both being regulated by a third one.
The set of all these regulatory interactions is called a gene regulation network. The modeling and simulation of genetic regulation networks constitutes an important area of research in systems biology [16].
This thesis deals with genetic regulation networks. It is based on the availability of many different sources of biological data. The last two decades have seen an explosive growth in the size of the databases containing sequences of genes, genomes, proteins and results of gene expression experiments. In layperson terms this can be described as a compendium of parts of a mechanism. If we describe metaphorically a cell as a mechanical clock, the genetic information is the blueprint that describes each one of the gears. This thesis aims to describe how these gears are interconnected and how they interact for a given outcome. The long term goal is to describe accurately these interactions in a way that allow us to predict the effect of a change in the mechanism and, in principle, determine which modifications have to be made to obtain a desired result.
In this thesis we propose, implement and evaluate a strategy that suggests a plausible and parsimonious regulatory network for a given organism, combining heterogeneous data derived from its genomic DNA sequence and its gene expression under several environmental conditions. In contrast to other gene regulation network reconstruc-tion approaches, this method does not require knocking-out genes or any other cell transformation, thus being useful for organisms where these molecular tools are not applicable.
Formally this thesis deals with gene regulatory networks, an abstraction that describes the interactions between regulator genes and regulated ones.
In Chapter 2 we overview some of the methods that have been proposed to unveil the real regulatory network of a given organism. Microbiological experiments to de-termine explicitly which genes are regulators and which ones are regulated by them have resulted in a modest but important base of knowledge. These experiments are not easy and expensive, so it is not expected that the whole picture can be determined by these means only. Instead, many bioinformatic approaches have been considered. The experimental data is then used as a gold standard to evaluate the quality of the mathematical and computational methods.
In Chapter 3 we propose an integrative approach to combine heterogeneous data and formalize it as a combinatorial optimization problem. We state the problem in formal terms as a minimization problem. We look for the subgraphs of the putative network that are coherent with the experimental evidence represented in the influence network and that minimize a global score function. We analyze the computational complexity of this approach and prove that this problem is not easy. Specifically we show that this problem belongs to the NP-hard complexity category.
The proposed model of network parsimony results in problems whose computational solution is hard to obtain. Specifically we prove that these problems belong to the complexity class NP-hard. To be able to solve them in practical time, we developed an heuristic approach and used state-of-the-art tools to explore the solution space in an efficient way.
In order to have an approximate solution in a practical execution time we propose also an heuristic approach. The proposed simplification reduces the size of the problem by considering combinations of minimal weight paths instead of the full set of arcs. This analysis was accepted for oral presentation and publication in the proceedings of the 15th International Conference on Verification, Model Checking, and Abstract Interpretation VMCAI 2014.
In Chapter 4 we evaluate the proposed method by applying it to the case of Escherichia coli, a well studied bacteria, and comparing the predicted regulations against the ones experimentally validated. The regulatory network resulting from this proposed method
is an improvement over the off-the-shelf methods, has good topological properties and puts in relevance the global or local role of the putative transcription factors. A publi-cation on this subject is in preparation to be submitted to PLoS ONE.
In Chapter 5 we apply this method to Acidithiobacillus ferrooxidans, a non-model mi-croorganism relevant in the biotechnological industry, being one of the main compo-nents of the bacterial consortia that facilitates the bioleaching process in copper mining. This bacteria presents particular challenges for the experimental determination of its regulatory network. Using the tools we developed we were able to propose a puta-tive regulation network and analyze it in order to put in relevance the role of its core regulators.
In a second part of this thesis, in Chapter 6 we explore how these regulatory relation-ships manifest themselves in a human health related case. Specifically we look for target genes to the Wnt/beta-catenine pathway, a process which has been described as related to the Alzheimer’s disease. Previous knowledge has shown that 55 genes are involved in the response to perturbations in the Wnt/beta-catenine pathway. In this thesis we propose to characterize these target genes by the presence of some regulation binding sites in the upstream region of each gene in the human genome. In contrast to the classical classification problems here we do not know explicitly the set of genes which are not target of this pathway. We developed a classification scheme that ex-tends the Classification and Regression Trees (CART) using multiple classifiers and a voting scheme that allows us to group the known targets and those genes which are not distinguishable from them. These new genes were propose for experimental vali-dation, which confirmed the prediction. This work was published in BMC Genomics (2010).
Finally, as an addendum, in Chapter 7 we address the mathematical problem of design-ing oligonucleotides to be used as probes in microarray experiments. These tools are commonly used to produce the information needed for the previous models. Most of the current tools used for this design use heuristic rules proposed by Kane (2000). The exact design of these probes requires a theoretical model of the hybridization dynamics of oligonucleotides bound to a glass surface. We show that classical thermo-dynamical models for oligonucleotides in solution are not applicable in this case. We use a modified nearest neighbor energy model and evaluate its parameters from exper-imental data. We conclude that to fully predict the hybridization dynamics a modified energy model for secondary DNA structure is required. We propose a research plan to determine such function.
1.1
What is gene expression?
We know that all the cells in our body share the same genetic material, but not all have the same shape or role. Some cells are neurons, other are muscular tissue, while other are red-cells in the blood. How can the same “program” result in such different outcomes? In this section we describe in general terms the biological background for the rest of the thesis and suggest an answer to this question.
All cellular organisms share some characteristics. Cells have a membrane or wall sep-arating their interior from the environment. This membrane is made from proteins and lipids (fat). Protein are macro-molecules with thousands of atoms. These atoms are not placed randomly but follow a pattern. A protein is made by concatenation of smaller molecules, called amino-acids, like a Lego puzzle. There are 20 different amino-acids found in nature. Proteins are then chains of between thirty and a few thou-sands amino-acids. Each amino-acid has different affinity to water molecules (some are hydrophobic, other are hydrophilic) so, when the protein is dissolved in water, it folds and assumes a characteristic shape that determine its role.
Proteins play different roles in the cell. Some can act as catalyzers of chemical reac-tions, these are called enzymes. Others have shapes that help in the transport of small molecules or become pieces of larger structures. Some can bind to the DNA molecule, these will be the focus of this thesis.
One or more molecules of DNA, called chromosomes, encode the information neces-sary to build these proteins. The process of transformation from DNA to proteins is called “Molecular Biology Dogma”. It states that some parts of the DNA, called genes, are transcribed —copied— to RNA molecules which, at their turn, are translated to pro-teins.
In more detail the transcription process occurs when a set of specific proteins (the RNA polymerase) bind to the chromosome, separates temporally the double-strand and copies the sequence from one of the strands to a new RNA molecule called messen-ger. The chromosome is a big macromolecule made with four types of blocks, called nucleotides. The transcription copies this information in a one-to-one procedure. For each nucleotide in the DNA molecule there is one nucleotide in the messenger RNA molecule.
The translation process is performed by another set of proteins (the ribosome) that builds a new protein assembling a chain of amino-acids following the description coded in the messenger RNA molecule. Each codon, that is a group of three RNA nucleotides, determine one amino-acid. Since there are 20 amino-acids and 64 com-binations of RNA nucleotides, many different codons correspond to the same amino-acid. Usually the last nucleotide of the codon has no effect on the resulting amino-amino-acid. There are three codons that do not encode an amino-acid but signal the end of the
pro-tein, they are called stop-codons.
Here we distinguish two big groups of living organism. Cells in the super-kingdom Prokarya, which includes bacteria, have usually a single chromosome and the mes-senger RNA can carry several genes that are translated together. Cells in the super-kingdom Eukarya, that includes all multi-cellular organisms, have usually many dif-ferent chromosomes inside an internal compartment called nucleus and the messenger RNA carries a single gene. Moreover, the messenger RNA is modified when it tra-verses the nucleus membrane: it is spliced and some internal parts are discarded. Not all proteins are produced all times. Some are produced in specific moments in the growth of the organism, others act in response to changes in the environment. For example in presence of lactose the bacterium E.coli produces lactase, a protein that decomposes the lactose molecule into two smaller sugar molecules, that are useful for the cell metabolism. When lactose concentration is low, then no lactase is produced, so cell energy and material are spared.
Which specific proteins are built in a given time depends on several conditions and interactions, which are globally called regulation. The set of genes that can code for proteins is called the genotype while the concentration of all molecules in a cell (in par-ticular the messenger RNA ones) is called the phenotype. So the genotype is the poten-tial outcome of a cell, versus the effective outcome that corresponds to the phenotype. Regulation is then the mechanism that enables a fixed genotype to become different phenotypes.
1.2
Measuring gene expression
In many cases the only part of the phenotype relevant to a problem are the concen-trations of the messenger RNA molecules. In this section we describe the technical methods used to evaluate these concentrations and their change.
1.2.1
Methods based on hybridization
Many methods for detecting and evaluating the concentration of nucleic acids are based on a key physicochemical property. Nucleic acid molecules form spontaneously structures with other nucleic acids. In particular DNA molecules are more stable in the double helix configuration than when the helix is open and each strand is not paired. If a single strand RNA or DNA molecule is exposed to other single strand DNA molecules, they will react and form a double strand molecule, called a duplex. This reaction is called hybridization. Apart of duplex formation it is observed that single strand DNA or RNA molecules can fold over themselves, like and adhesive tape that binds with
itself, forming what is called secondary structures.
In principle each nucleotide can be paired with any other nucleotide, but not all pair-ings have the same stability. The most stable hybridizations, thus the ones that are usu-ally found in nature, are those that follow the Watson-Creek pairing, where adenines are matched with thymines, and cytosines with guanines. Using the standard repre-sentation of the nucleotides with the symbols {A,C,T,G}, the Watson-Creek pairing has every A in a strand paired to a T in the other strand, and each C paired to a G. We say that {A,T} and {C,G} are complementary pairs.
Microarrays
One of the most used techniques for evaluating RNA concentration are the microar-rays. These are glass slides where a series of spots have been printed forming an or-dered array. Each spot contains several millions of copies of a specific DNA molecule, called probes. These can be (a subsegment of) a gene or other DNA element that hy-bridizes to a sample (called target) which has been labeled with a fluorophore or other photo luminescent element. After the hybridization reaction has completed the slide is exposed to a laser beam that excites the fluorophore. Then the slide is scanned with a photomultiplier tube to detect the presence of hybridized molecules. In some ranges it is expected that the signal intensity of each spot be proportional to the concentration of the corresponding RNA molecule.
If the probes contain DNA molecules that are specific to each gene, then the relation between RNA concentration depends on the physicochemical affinity of the two nu-cleic acid molecules, and on the affinity of them to other structures. If moreover the probes are not specific to a single gene, then cross-hybridization can result in mixed signals.
Two approaches have been used to overcome this issue. Microarrays fabricated by Affimetrix have two spots for each target. One is designed to be a perfect match, the other has a mismatching nucleotide in order to match in equal conditions the target and eventual cross-hybridizing genes. By comparing the signal intensity of both probes the cross-hybridization and affinity effects can be controlled.
Other strategy frequently used is to hybridize simultaneously two samples labeled with fluorophores of different colors, typically red and green. All affinity issues will affect simultaneously to both samples. The slide is scanned twice, one time using a different laser color. Each one of the two resulting images will correspond to a sample. Comparing the signal intensity of each probe in each image the change in RNA con-centration is determined. This value is called differential expression and is normally considered to be less noisy than absolute expression.
num-ber of genes. Nevertheless the signal intensity is affected by several factors, so the result is mostly qualitative. A more precise evaluation of gene expression can be ob-tained using qPCR, even in very low concentrations.
They have been used in health diagnostics [49], metagenomic sampling, monitoring of microbiological communities in the biotechnological industry [18], identification of protein-DNA binding sites (known as CHiP-chip) and detection of single nucleotide polymorphisms. They are also used to perform comparative genomic hybridization, for example to analyze the genetic diversity of a taxonomic branch [38] and in cancer research to determine copy number variation, that is which regions in the chromo-somes are deleted or amplified in tumor cells versus healthy ones [70]. Microarrays have been used to physically isolate the DNA segments that need to be resequenced in whole genome sequencing projects.
1.2.2
Methods based on sequencing
Recent developments in rapid and massive sequencing technologies have allowed an alternative approach to nucleic acids quantification. Systems as Illumina or 454 can read hundred of thousands or even millions of sequences in a short time and at reduced costs. If the sequences correspond to messenger RNA then the relative abundance of each gene can be estimated from the number of copies of each molecule.
One advantage of this technology versus hybridization based methods is that no prior knowledge of the gene sequences is required. The result of the measurement will also provide the sequence of the expressed genes. The expression level of each messenger RNA is quantified by the number of sequenced fragments that correspond to the given gene. This value is limited by the sequencing depth and is dependent on the expression levels of the rest of the genes.
The analysis of these experiments has motivated the development of several statisti-cal algorithms with different approaches to normalization and differential expression detection.
1.3
Regulation discovery methods
In this section we describe the main methods currently used to find possible regula-tory interactions by bioinformatic methods. We describe methods that use experimen-tal results from microarray data and methods that use sequence information. Their advantages and weak points are discussed.
1.3.1
Gene influence networks
An important part of the activity of every cell is realized, carried on or facilitated by proteins. These macromolecules are synthesized by the cell following sequences coded in the genes. The genes are regions in the chromosome (a DNA macromolecule) that are read and transcribed into messenger RNA (mRNA) each time a protein has to be produced. This mRNA is then processed by a specific molecular machinery, the ribosome, that combines amino-acids to build a protein following the recipe coded in the mRNA molecule.
In a first approach the activity of each protein can be measured indirectly by the con-centration of the mRNA molecule that codes for it. This concon-centration is called gene
expressionand can be estimated by several molecular biology tools. In particular
mi-croarrays are one tool that allows the simultaneous measurement of the expression of all genes in the cell. By scanning the luminescence signal of DNA probes which have been hybridized with reporter cDNA molecules, one can get an indirect measurement
of the mRNA concentration for each gene1. Under some hypothesis and ranges, the
luminescence level is linearly correlated to the mRNA concentration. Other new tech-niques like RNA-seq also allow for a simultaneous measurement of the expression of all genes, with a promise of better precision. The set of the expression levels for all genes in a given condition is sometimes called the phenotype, in the sense that it char-acterizes the activities of the genes and, indirectly, the proteins in the cell.
The mathematical analysis of these experiments considers that each gene is character-ized by the vector of differential expressions through a series of environmental condi-tions, time series or mutations. This vector is called expression profile and has
com-ponents Xi,j for the gene i under condition j. Many studies have used these profiles
to form clusters of genes with similar expression and then putatively characterize the role of genes with unknown function. This is based on the observation that genes with similar expression profiles tend to be functional related, a strategy called “guilty by association”.
In a sense this observation is purely empirical. Clustering just describes genes that have similar responses to a set of conditions, but it does not explain why they do. In many cases one can be interested in the prediction of how gene expression will change under a new condition, like when a drug is used or the cell is exposed to a different environment. In other cases one can look for identifying which genes to knock out to achieve a desired outcome.
1In expression microarray experiments the cell membrane is broken and the cytoplasmatic RNA
molecules are retrotranscribed to fluorescence marked cDNA molecules, so that the concentration of the first ones corresponds to the one of the last ones. The values are often normalized against a ref-erence mRNA concentration, which is hybridized at the same time but marked with a different color fluorosphore. This is called differential expression.
In such cases we need a model describing which genes interact among them and which ones influence the expression of others. This is called the influence network of the cell. It points to describe how do the genes change their expression, in contrast to the clustering, that points to describe which genes change.
The distinction translates in two points. First, the expression of a gene can be influ-enced by many genes simultaneously, and these relationships can be non-linear. Sec-ond, we would like to determine the direct influences from the indirect ones.
Computational methods for influence prediction
The first approach to determine influence relationships between gene expression pro-files is the Pearson correlation coefficient, which evaluates a linear relationship be-tween variables Corr(Xa, Xb) = ∑j(Xa,j−X¯a)(Xb,j−X¯b) q ∑j(Xa,j−X¯a) q ∑j(Xb,j−X¯b) .
This index, although a natural one, is not the preferred one because it cannot detect some non-linear relationships. Several other indices have been proposed, such as cor-rentropy [27], MIC [76] and mutual information, which is described in this section.
Detecting non-linear influences
One of the indices that can describe non-linear relationships between expression pro-files is mutual information, which is the differential information entropy between the
two variables. If Xa and Xb are the expression profiles of genes a and b, their mutual
information is defined as
MIa,b =H(Xa) +H(Xb) −H(Xa, Xb)
where H(X) is the information entropy, or Shannon entropy, of the random variable
X. When X assumes discrete values and its probability distribution is Pk =Pr(X=k),
its information entropy is
H(X) =E(−log P
k) = −
∑
k
Pklog Pk.
Unlike linear correlation, mutual information is non-zero if and only if the two vari-ables are statistically dependent. The mutual information is a measure of the additional information known about one expression profile when another is known; the previous
expression is equivalent to
MIa,b =H(Xa) −H(Xa|Xb).
Evaluation of Mutual Information from sample data. Empirical distribution
To evaluate mutual information we need to know the probability distribution of the expression profile of each gene, and the conjoint probability distribution of each pair of genes. A natural approach is to build the empirical distribution, using either equal size bins or equal count bins.
Let us consider that the expression level of a given gene i is a random variable X.
Then the expression profile Xi,j of the gene i for j = 1, . . . , n is a series of realizations
of X. If the range of the this random variable is partitioned into m disjoint intervals
Bk, k = 1, . . . , m, then each sample in the expression profile falls into a single bin. Let
nk = |{Xi,j 2 Bk, j = 1, . . . , n}|be the number of samples falling on each bin. Clearly
∑knk =n.
The maximum likelihood estimation of Pk =Pr(Xj 2 Bk)is the empirical distribution
ˆPML
k =nk/n and the maximum likelihood estimator for entropy is
ˆ HML(X) = − m
∑
k=1 ˆPML k log ˆPkML.Unfortunately this is a biased estimator. To overcome this, in [60] the authors introduce
a bias correction term. Let m0 = |{B
k : Bk 6= ∅}| be the number of non-empty bins.
Then the Miller and Madow unbiased entropy estimator is ˆ HMM(X) = − m
∑
k=1 ˆPML k log ˆPkML+ m0−1 2n .Another approach to solve the bias is to approach Pk by a mixture of an uniform
dis-tribution and the empirical one. This is called the shinkage method [82]. The estimated distribution depends on a λ parameter:
ˆP(λ) k =λ 1 m + (1−λ) nk n .
The parameter λ is chosen as to minimize the mean square difference between the distribution and the data
MSE(P(λ)) = E m
∑
k=1 (ˆPk(λ)−Pk) !2 .that the real distribution is appropriately approximated.
Evaluation of Mutual Information from sample data. Normal distribution
If we assume that the gene expression profiles follow a multinormal distribution then
we have an explicit expression for the entropy. Let Xa be a random variable following
a normal distribution N(µ, σa2). Let φ(x)be its probability distribution function. Then
ln φ(x) = −1
2ln 2πσa2−
(x−µ)2
2σ2
a
and the information entropy is then
H(X) = E(−ln φ(x)) = 1 2ln 2πσa2+ Var(x) 2σ2 a = 1 2ln 2πeσa2.
A similar derivation shows that for two variables Xa and Xb following a multinormal
distribution, the conjoint entropy is
H(Xa, Xb) =
1
2ln
⇣
(2πe)2(σa2σb2−σab2)⌘. Therefore the mutual information can be expressed as
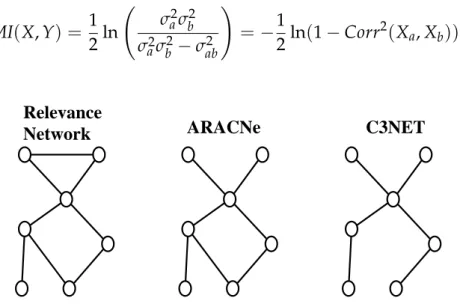
MI(X, Y) = 1 2ln σa2σb2 σa2σb2−σab2 ! = −1 2ln(1−Corr2(Xa, Xb)). Relevance
Network ARACNe C3NET
Figure 1.1: Example of influence networks predicted by Relevance Networks,
ARACNe and C3NET. The first method keeps all edges over a threshod. ARACNe
breaks every triangle where the indirect relationship is stringer than the direct one. Finally C3NET only keeps, for each vertex, the edge with higher mutual information.
Separating direct from indirect influences.
The first usage of mutual information to describe gene associations was made in [13] under the name of Relevance Networks. Two genes were deemed associated when their
mutual information was greater than a threshold I0defined by a permutation test. The
authors “hypothesize that the higher mutual information is between two genes, the more likely it is they have a biological relationship.” Posterior works showed that this method yields a high number of false positives, because mutual information can be significantly high for indirect interactions like the case of a transcriptional cascade. Several method have been proposed to prune the graph produced by Relevance Net-works and overcome this weakness. One approach is based on the data-processing
in-equalitywhich states that if genes a and c interact only through a third one b, then
MIa,c min{MIa,b, MIb,c}.
This is the base of the strategy used by ARACNe [53]. For each triangle in the graph produced by Relevance Networks, this method determines the edge with lower mutual information and, if this value respect to the others is below a given tolerance, the edge is discarded.
A stronger condition is imposed by C3NET, which keeps for each node only the edge with the greatest mutual information. The number of edges in the resulting graph is then upper bounded by the number of vertices. Examples of graphs produced by these three methods can be seen in Fig. 1.1.
A different approach is proposed by the strategy Maximum Relevance Minimum
Redun-dancy(MRNET), an iterative algorithm that identifies, for each gene Xa, a set S of
po-tentially associated genes. Initially S = ∅. In each iteration MRNET determines the
gene Xbthat maximizes
MI(Xa, Xb) −
1
|S|X
∑
c2S
MI(Xb, Xc)
The gene Xb that maximizes this expression with a value over a threshold is added
to the set S. This expression corresponds perfectly to the idea behind MRNET. The first term of this expression focus on finding the associated genes that are of maximal
relevance for Xa, while the second term focus on minimizing the redundancy with
respect to the associated genes already in S.
1.3.2
Gene regulation networks
In the previous section we discussed some of the tools that can be used to describe the interactions among genes looking only to the phenotypical characteristics, i.e. consid-ering only the effects of the transcription. In this section we discuss the genotype ap-proach, describing the physical interactions predicted by the genomic DNA sequence. Some proteins can bind to the chromosome and enhance or inhibit the transcription of
the genes. These proteins are called transcription factors (TF). Thus, the expression of a gene coding for a transcription factor will have an effect on the expression of other genes or itself. The behavior of the cell, in terms of the concentrations of mRNA molecules, is then the result of the dynamic interaction between transcription factor encoding genes.
A transcriptional regulatory network (sometimes said gene regulatory network) is the description of the regulation relationships between the genes of a given organism. Some genes are regulators; when they are expressed, they enhance or inhibit the ex-pression of other genes, the regulated ones. Some regulators can regulate themselves. Reconstructing a transcriptional regulatory network is thus determining which genes are regulators and which ones are regulated by them.
Molecular biologists have been able to experimentally isolate DNA bound proteins, determine the genes that encode them and the sequence of their binding site (TFBS). These experiments are limited in scale and can not be applied to all organisms [78], so the estimated number of transcription factors and binding sites is greater than the currently validated ones. The challenges posed by the in vivo or in vitro experimental methods encourage the usage of in silico bioinformatic approaches.
It has been observed that TF tend to have some specific 3D structures (like the so called helix-turn-helix or zinc-fingers) which are conserved between taxonomically related organisms. There are many tools that can be used to determine which genes can code for a TF, by orthology or homology.
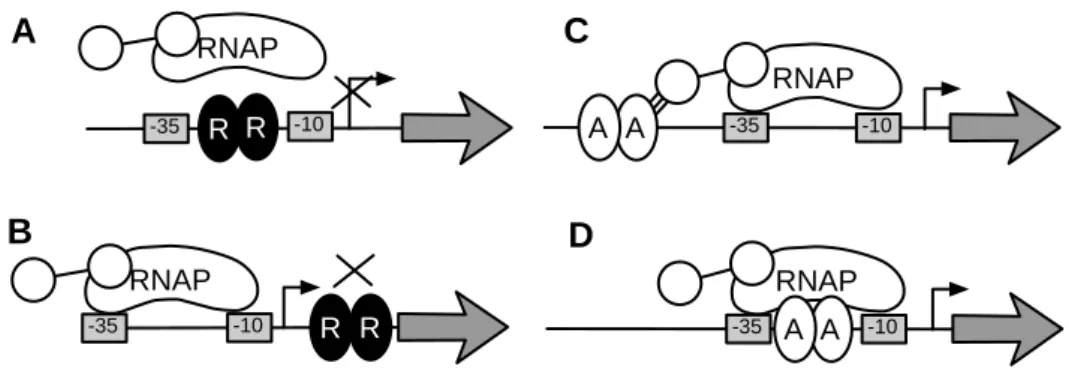
RNAP R R -10 -35 RNAP R R -10 -35 RNAP A A -35 -10 RNAP -35 A -10 A B C D A
Figure 1.2: Biological model of transcriptional regulation in bacteria. RNA poly-merase (RNAP) binds normally to “–35” and “–10” boxes. Transcription factor R is a repressor in (A) and (B), blocking the RNAP binding or the transcription elongation, respectively. Transcription factor A is an activator in (C) and (D), facilitating the RNAP binding. Adapted from [78].
The current biological model of transcriptional regulation in bacteria considers that genes are transcribed by the action of a protein complex called RNA polymerase (RNAP), which binds to two regions located at 35 and 10 nucleotides from the transcription start site.
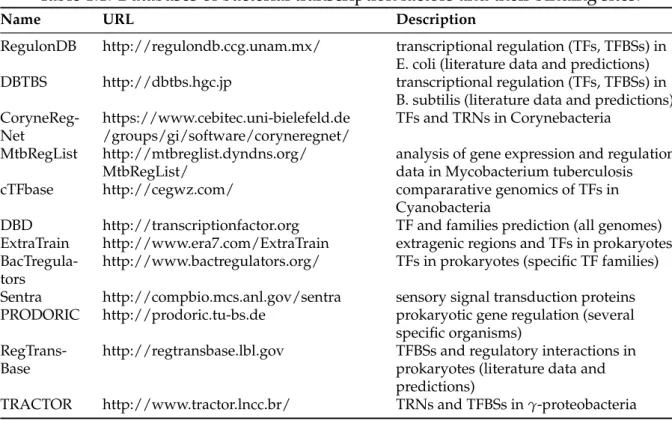
se-Table 1.1: Databases of bacterial transcription factors and their binding sites.
Name URL Description
RegulonDB http://regulondb.ccg.unam.mx/ transcriptional regulation (TFs, TFBSs) in
E. coli (literature data and predictions)
DBTBS http://dbtbs.hgc.jp transcriptional regulation (TFs, TFBSs) in
B. subtilis (literature data and predictions)
CoryneReg-Net https://www.cebitec.uni-bielefeld.de/groups/gi/software/coryneregnet/ TFs and TRNs in Corynebacteria
MtbRegList http://mtbreglist.dyndns.org/
MtbRegList/ analysis of gene expression and regulationdata in Mycobacterium tuberculosis
cTFbase http://cegwz.com/ compararative genomics of TFs in
Cyanobacteria
DBD http://transcriptionfactor.org TF and families prediction (all genomes)
ExtraTrain http://www.era7.com/ExtraTrain extragenic regions and TFs in prokaryotes
BacTregula-tors http://www.bactregulators.org/ TFs in prokaryotes (specific TF families)
Sentra http://compbio.mcs.anl.gov/sentra sensory signal transduction proteins
PRODORIC http://prodoric.tu-bs.de prokaryotic gene regulation (several
specific organisms)
RegTrans-Base http://regtransbase.lbl.gov TFBSs and regulatory interactions inprokaryotes (literature data and
predictions)
TRACTOR http://www.tractor.lncc.br/ TRNs and TFBSs in γ-proteobacteria
quence to a mRNA molecule and moves through the chromosome until it finds a phys-ical limitation like a hairpin structure or another protein bound to it. The transcription process may copy one or more genes, that form what is called an operon, that is a set
of contiguous genes2that are transcribed in a single mRNA molecule.
If a transcription factor binds near the “–35” and “–10” boxes it may inhibit or repress the expression of the downstream genes. In other cases it may enhance the affinity of the upstream region to RNAP and increase the expression of the downstream gene. See Fig. 1.2.
According to this biological model, a regulator gene is one that codes for a TF, and it regulates the genes in the operon immediately downstream of the TFBS.
Computational method for regulation prediction
Since gene sequences tend to be conserved between taxonomically related organisms, and since transcription factors are characterized by their structural properties, it is nat-ural to determine which genes can encode for a transcription factor using homology to other known transcription factors. There are several public databases that describe the sequences of all bacterial transcription factors and patterns that characterize their binding sites, as seen in Table 1.1.
The scenario is not so straightforward in the case of locating the binding site. These
2Some authors define operon as a polycistronic transcript, that is, a mRNA molecule with two or more
are regions whose length is in most cases 16 to 20 nucleotides, although they can be as small as 12 or as long as 30 nucleotides. A single transcription factor can have many binding sites in different regions of the chromosome. These binding sites can have a significant variation in their sequence, which may be related to different affinities to the transcription factor, in turn related to different roles in the regulation [97].
Several biochemical experimental techniques, as ChIP-chip, allow to determine the site in the genome where a specific transcription factor binds. By comparing and aligning all contexts in the genome where a transcription factor binds for a given condition, we can determine the common characteristics of all binding sites for this factor. Thus, a common model called motif can be determined for the transcription factor binding site. Algorithms for this task use Gibbs sampling [14, 84, 88], expectation maximization (MEME) [6], etc.
One usual way to characterize the sequences of all the binding sites for the same
tran-scription factor is in the shape of a frequency matrix whose element Ni,j corresponds
to the number of times the nucleotide i2 {A, C, T, G}was observed in position j of the
binding site sequence. From this characterization, an usual approach for detecting pu-tative binding sites in the DNA sequence is to consider these empirical frequencies as a probability distribution for the words that can be a binding site. Moreover, it is usu-ally assumed that the probabilities of each BS position are independent. Under these hypothesis several tools use the principle of likelihood ratio to build a position weight
matrix (PWM) that is used to evaluate a matching score for any word in the DNA
sequence. Higher scores correspond to words that better match the binding sites char-acterization for the given transcription factor. A statistical model is used to quantify the probability of attaining any given score in a random sequence, thus the score of a given word is translated to a p-value. Some of the computational tools that implement this approach are MEME/MAST, MEME/FIMO and RSAtools. The main drawback of this approach is their low specificity [56]. Many of the detected binding sites are not functional. Often, the number of putative binding sites is ten times greater than the number expected by the biological theory.
All these tools can be combined to build a putative transcriptional regulatory network. Transcription factor can be putatively determined by homology to gene sequences in a database using Blast [3] or by orthology to other organisms using OrthoMCL. This functional assignment is also characterized by a p-value, although this value is not included in the standard output but instead has to be derived from the E-value. The binding sites of these transcription factor can be detected using FIMO on the sequences of the upstream region of each operon. Only the transcription factors and binding sites predictions having a p-value under a threshold are considered as putative regulations. These relationships can then be represented in a bipartite oriented graph. Nodes are either genes or transcription factors, when a gene is predicted to encode a transcription
factor then there is an arc from the gene to the transcription factor, when a binding site is detected upstream a gene then there is an edge from the transcription factor to the putatively regulated gene. Each arc has as attribute the p-value of the corresponding pattern matching algorithm.
The main advantage of this strategy for GRN reconstruction versus influence networks is that the putative GNR describes a physical link between the TF and the regulated genes, where causality is explicit. In contrast influence networks do not provide any indication of causality. On the other side the main disadvantage of GRN reconstruction is the high number of false positives, due mainly to the low specificity of the BS location procedure. Of course, these methods can only be applied when the genomic sequence is known.
1.3.3
Our proposal: an integrative method
Each of the two approaches previously described has strong and weak points. The in-fluence graph is based on experimental evidence but does not provide a causal expla-nation for the gene associations that it describes. The putative gene regulation network can provide explanations, but there are too many of them, not necessarily supported by the experimental evidence.
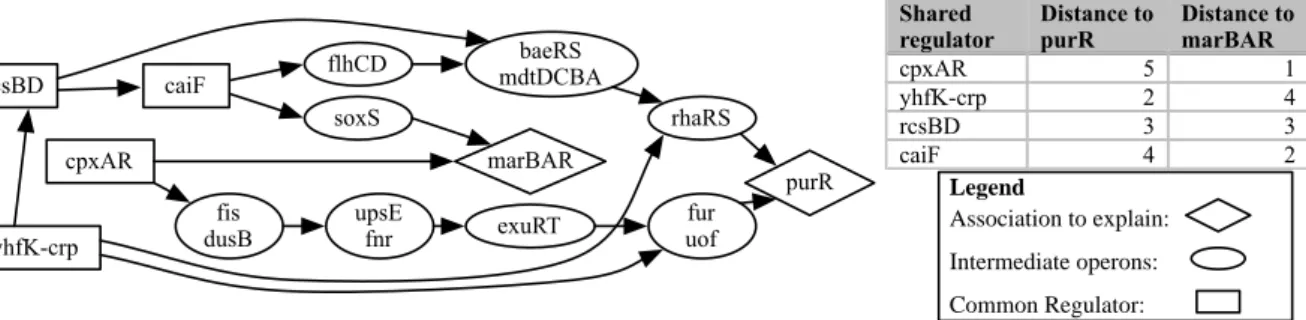
In this work we propose to combine both predictions to build a third one of a reason-able size and supported by the evidence. Given an influence network built with any of the methods previously described, we will say that each pair of genes that are con-nected by an edge in this graph form a pair of associated genes, that is genes whose behavior through several conditions seem to be related.
Our proposal is then to find, among all the subgraphs of the putative transcriptional regulatory network that “explain” the influence network, those subgraphs that min-imize some criteria. If there are several subgraphs matching this condition, that will allow us to reason on them, enumerating each of them, their union or their intersection. In [29], the authors explore the idea of grouping genes likely to be co-regulated and finding their common transcription factor but focus their approach mainly on direct regulations, without considering indirect or shared regulation. More recently, in [65], all these scenarios are implicitly considered. Here, the idea is to find physical interac-tions (gene-protein, protein-protein, and protein-gene) to explain relainterac-tions determined from expression data in a modular network.