HAL Id: hal-02294336
https://hal.univ-brest.fr/hal-02294336
Submitted on 25 Mar 2021
HAL is a multi-disciplinary open access
archive for the deposit and dissemination of
sci-entific research documents, whether they are
pub-lished or not. The documents may come from
teaching and research institutions in France or
abroad, or from public or private research centers.
L’archive ouverte pluridisciplinaire HAL, est
destinée au dépôt et à la diffusion de documents
scientifiques de niveau recherche, publiés ou non,
émanant des établissements d’enseignement et de
recherche français ou étrangers, des laboratoires
publics ou privés.
Directional Loudness of Low-Frequency Noises Actually
Presented Over Loudspeakers And Virtually Presented
Over Headphones
Gauthier Berthomieu, Vincent Koehl, Mathieu Paquier
To cite this version:
Gauthier Berthomieu, Vincent Koehl, Mathieu Paquier. Directional Loudness of Low-Frequency
Noises Actually Presented Over Loudspeakers And Virtually Presented Over Headphones.
Jour-nal of the Audio Engineering Society, Audio Engineering Society, 2019, 67 (9), pp.655-665.
�10.17743/jaes.2019.0018�. �hal-02294336�
PAPERS
Directional Loudness of Low-Frequency Noises
Actually Presented Over Loudspeakers And
Virtually Presented Over Headphones
*
Gauthier Berthomieu, AND Vincent Koehl, AND Mathieu PaquierUniv Brest, Lab-STICC, CNRS, UMR 6285, F-29200 Brest, France
Previous studies have revealed that the loudness of low-frequency pure tones increased with the interaural time difference (ITD). This effect accounts for the directional loudness phenomenon at low frequencies, where ITD is the main localization cue. So far, this effect has only been studied for sounds generated and presented directly over headphones, which are not natural listening conditions. The present study aims at investigating this effect on low-frequency noises stemming from real sources. Twenty subjects assessed the loudness of stimuli that were actually displayed by loudspeakers arranged at various locations within a listening room or that were recorded with a dummy head and virtually reproduced through headphones. Results show that the directional loudness sensitivity (DLS) is in agreement with the pre-viously revealed ITD effect. Moreover, the DLS was higher when stimuli were reproduced over headphones than over loudspeakers, specifically when frontal sources were located at a short distance from the listeners. One hypothesis on this effect relies on visual cues that were available to the listeners only when sounds were reproduced over loudspeakers, providing in-formation about the source distance. Listeners were also aware that sounds were reproduced on loudspeaker or headphones, possibly involving different loudness processings, leading to DLS differences.
0 INTRODUCTION
0.1 Effect of direction and ITD on loudness
The direction of a sound source in relation to the listener affects significantly the loudness of the sounds it produces, especially in the horizontal plane [1, 2, 3, 4]. There is grow-ing awareness that this phenomenon, called directional loudness, has to be taken into account for audio reproduc-tion systems, especially for multichannel ones [5, 6]. This phenomenon is largely accounted for by at-ear pressures, that are highly dependent on the position of the source with respect to the listener. More precisely, the filtering applied by the head, torso and ears of the listener on a sound that reaches his/her ears depends on the direction from which the sound comes [5]. This filtering leads to a variation of the at-ear sound pressure level, which is the main factor in-volved in the loudness sensation. Consequently, directional loudness was mainly expected to occur for high-frequency stimuli, since the filtering effect of the body is rather small for low frequencies [7]. Nevertheless, directional loudness has been observed for low-frequency narrow-band noises
*Corresponding author: Tel: +331-98-01-65-86; e-mail:
[2]. Furthermore, binaural loudness models that take at-ear pressures as input tend to underestimate directional loud-ness effect in comparison with experimental data [8, 2]. These observations suggested that at-ear sound pressure modifications could not fully explain the directional loud-ness phenomenon, especially for low-frequency stimuli.
This assumption was confirmed by previous studies that highlighted an effect of the interaural time difference (ITD) on the loudness of pure tones. A small but significant loud-ness increase (+1.5 dB) was reported for low-frequency (200 and 400 Hz), low-level (40 phon) pure tones whose ITD reached 772 µs [9]. This ITD value corresponded to a 90◦incidence angle according to Kuhn’s low-frequency model [10]. The loudness increase proved to be caused by the ITD itself rather than by the related localization. This was observed by estimating the loudness of sounds with a fixed ITD whose induced localization was counterbalanced thanks to an Interaural Level Difference (ILD, which is the second binaural localization cue) leading to the opposite ear [11]. Another previous experiment focused on the evo-lution of this effect as a function of the level of the stimulus [12]. ITD was reported to significantly enhance (between 1.5 dB and 2 dB) the loudness of pure tones whose loud-ness level was up to 40 phon at 100 Hz and up to 50 phon
at 200 Hz. These results indicate that ITD is involved in the binaural loudness process. In order to control the ITD in these experiments, sounds were presented in an audio-metric booth and reproduced over headphones with a fixed ITD applied between the two channels, which constitutes a rather unecological sound presentation.
0.2 Effect of ecological validity on loudness
According to Epstein and Florentine [13, 14], the eco-logical validity of an experiment is likely to affect the bin-aural loudness summation and should be taken into account in loudness research. This was concluded from results re-garding the binaural-to-monaural loudness ratio which is the loudness growth observed when a sound is presented at the two ears compared to at one ear only. Such a com-parison can be conveniently achieved by feeding either one channel or two channels of headphones. Assuming that a monaural listening situation was not ecologically valid to the listeners, Epstein and Florentine assessed the binaural-to-monaural ratio for speech stimuli displayed whether on loudspeakers, whether on headphones [13], with or with-out visual cues [14]. They reported that the binaural-to-monaural loudness ratio decreased as the ecological valid-ity of the presentation increased (that is for loudspeaker-reproduced stimuli displayed with visual cues). Although binaural-to-monaural ratio is not directly related to direc-tional loudness, they are both involved in binaural loud-ness summation and one could wonder if ecological valid-ity could have an effect on directional loudness. Further-more, Sivonen reported that reverberant sounds yielded to smaller directional loudness effects than anechoic ones [3]. Thus, the room effect is also likely to decrease the direc-tional effects observed in an anechoic chamber.
These findings about binaural and directional loudness both suggest that effects observed under rather unecologi-cal conditions could be reduced in more realistic situations. Since the previous results about the effect of ITD on loud-ness were obtained with pure tones directly generated and displayed over headphones, one may wonder whether the loudness increase reported for headphone-generated stim-uli lateralized with the sole ITD still holds under more real-istic conditions, namely for real sources located in a room. Besides, stimuli directly synthesized over headphones are often perceived “within the head” rather than coming from a distant source [15], which could constitute an additional source of disparity between these laboratory presentation conditions and natural ones.
0.3 Aim of the present study
The present study has been designed in order to inves-tigate the directional loudness effects for low-frequency noises stemming from loudspeakers located around the subject in a listening room. Contrarily to the previous re-sults about the ITD effect, such stimuli were emitted by real sources in a room that was not anechoic. The stim-uli were presented to the listeners by either actually repro-ducing them over loudspeakers or by virtually reprorepro-ducing them over headphones, in order to study the influence of the
presentation conditions. One should note that reproducing the stimuli either over loudspeakers or headphones is not likely to modify the directional effects as long as visual cues are available to the subjects. According to Sivonen et al., the directional loudness sensitivity of narrow-band noises was the same whether they were directly reproduced through visible loudspeakers located all around the subject in an anechoic room [2] or reproduced at the same positions with headphones by using individual HRTFs [16]. The lat-ter experiment took place in the same anechoic chamber and the loudspeakers were still mounted in the tested di-rections even if sounds were reproduced over headphones to improve the plausibility of the binaural synthesis. In this specific case, it might not have been possible to distin-guish between two identical sounds that were played back over loudspeakers or headphones [17]. However, in most laboratory experiments, binaural stimuli (whether recorded or synthesized) are not presented with visual representa-tions of the sound sources. This also applies to the present study as no loudspeaker was mounted in the directions un-der study when sounds were reproduced over headphones. Thus, the presentation conditions under investigation dif-fered not only because of the reproduction system itself (loudspeakers or headphones) but also because of the in-formation they provided about the sound sources, such as visual information.
The effects of direction on loudness were assessed in terms of Directional Loudness Sensitivity (DLS) by com-paring directional stimuli to frontal references. As the room effect is likely to alter the directional loudness [3] and as the position of a sound source is likely to evoke a spe-cific room response, several spatial configurations of the sound sources in the listening room were tested so that the observed effects would not be caused by a specific loud-speaker layout within the room. The DLS was also assessed for headphone-reproduced stimuli lateralized with the sole ITD for comparison with previous studies.
1 Material and methods
The effect of direction on loudness (or DLS) was investi-gated by matching low-frequency noises emitted by lateral sources with frontal references. Two different presentation conditions were under study: one where sounds were actu-ally played back over loudspeakers and one where these sounds were first binaurally recorded and then virtually reproduced through headphones. For the low-frequency noise under test, the room effect may vary with the source position and thus affect the directional loudness [3]. The DLS was then investigated for four different spatial con-figurations of the sound sources enabling to elicit and take into account different room responses.
1.1 Stimulus
The stimulus that was investigated in this experiment was a narrow-band noise, which bandwidth was set to one Equivalent Rectangular Bandwidth (ERB) so that all the spectral components of this noise were contained in one
PAPERS DIRECTIONAL LOUDNESS OF LOW-FREQUENCY NOISES
critical band. The center frequency of the noise was 265 Hz since previous experiments reported a predominant effect of ITD on loudness between 200 and 400 Hz [9, 12]. The ERB was computed according to the following equation by Glasberg and Moore [18]:
ERBN = 24.7 × (4.37F + 1) (1)
where F = 0.265 kHz is the center frequency of the ERB. This equation led to a 53-Hz wide ERB. The narrow-band noise was generated according to the procedure described by Edmonds and Culling [19]. The reference level was fixed at 50 phon [12] (corresponding to 58.4 dB SPL at 265 Hz according to the ISO 226 standard [20]) at the cen-ter of the head of the subject in his/her absence. The du-ration of each stimulus was 1.6 s, smoothed by onset and offset ramps of 100 ms.
1.2 Procedure
Twenty subjects aged from 20 to 25 years took part in the experiment and were payed for their participation. Their hearing thresholds were measured for the noise investi-gated in this experiment using a standard procedure [21] and had to be ≤ 10 dB HL to go on with the experiment. None of them had experience in laboratory listening tests.
Points of Subjective Equality (PSE, corresponding to the level at which a sound is perceived as loud as a ref-erence sound) were obtained using a interval, two-alternative, forced choice paradigm (2I2AFC), following a 1-up 1-down rule [22]. In each trial, a test sound and a reference sound were presented in random order, sepa-rated by a 500 ms pause. The test sound was presented by a lateral source (azimuth of −90◦or +90◦) and the refer-ence soundwas presented by a frontal source (0◦). The task was to indicate whether the first or the second sound was louder, with no other possible option and independently of any other perceived difference. The software was devel-oped and executed on MAXMSP and subjects responded using two buttons on a gamepad. These instructions were indicated orally and a few trials were presented before the beginning of the test in order to familiarize the subjects with the interface and procedure.
The test sounds were initially presented at a level ran-domly set 10 dB above or below the reference sound level. After the subject’s response, their level was lowered by a given amount if the subject judged it was louder than the reference sound, whereas it was increased by a cer-tain amount if the subject judged the reference sound was louder. The step size was initially set to ±4 dB and changed to ±1 dB after two reversals in the equaliza-tion curve (i.e. when the loudness judgment of the sub-ject changed from one trial to another for the same test sound). A total of eight reversals were collected for each test sound. Then, PSEs were derived from the means of the test sound levels at the six last reversals, relative to the reference soundlevel. The experiment was split in two sions, with a 5 min break between them. Each of these ses-sions consisted of the same task, but under different presen-tation conditions: one where sounds were actually played
back over loudspeakers and one where sounds were vir-tually reproduced over headphones. Each subject partici-pated in the two sessions in a random order.
1.3 Actual presentation
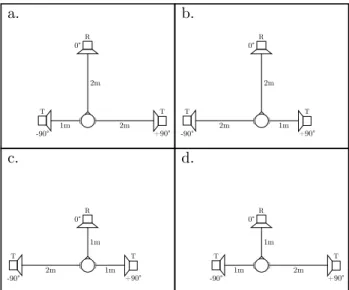
The experiment took place in a sound-attenuated listen-ing room, which had been designed so that its RT60 was 0.3 s at 250 Hz [23], in compliance with the IEC 60268-13 standard [24] concerning room characteristics for listen-ing tests on loudspeakers. Four loudspeakers were placed at various locations within the room (see Fig. 1) to repro-duce both reference and test sounds. As shown in Fig 2, this setup enabled to arrange frontal and lateral loudspeak-ers in four different spatial configurations within the room to differently elicit its response. In one given configura-tion, the frontal (0◦) loudspeaker playing reference sounds, denoted R, was located at either 1 or 2 m from the listen-ing point whereas both distances could be allocated to the lateral loudspeakers (−90◦or +90◦) playing test sounds, denoted T.
Fig. 1. Loudspeakers arranged around the listening point (dot) in the test room.
The subject sat in a chair that was placed in the room so that the center of his/her head corresponded to the listening point depicted by the dot in Fig. 1. The subject’s head was precisely positioned using a headrest and a chin rest and it remained fixed during the procedure. Each spatial config-uration was achieved by pointing the subject towards one of the four loudspeakers. The experiment was subsequently divided into four sub-sessions, with respect to the four spa-tial configurations under test. The sub-session order was randomly chosen for each subject. Each sub-session lasted between 5 and 10 min and subjects were allowed to stand up from the chair between each sub-session. The headrest and the chin rest were maintained in a fixed position dur-ing the whole session so that the subject’s head could be precisely positioned in the same position at the beginning of each sub-session.
Fig. 2. Loudspeakers arrangement for each of the four spatial configurations. Sources denoted R display the reference sounds, sources denoted T display the test sounds.
Sounds were generated using a RME Fireface 800 sound card and reproduced through Amadeus PMX 4 loudspeak-ers, powered by Audac DPA154 amplifiers. The four speakers were calibrated so that they produced a loud-ness level of 50 phon at the center of the head of the subject in his/her absence. In other words, they delivered 58.4 dB SPL [20] at the listening point whatever their lo-cation within the room.
1.4 Virtual presentation
The stimuli that were presented to the listeners through the actual sources were recorded in order to be played back through headphones in these presentation conditions. In order to provide the listener with the same acoustic stimuli with headphones as with loudspeakers, binaural recordings were carried out. At the frequency range un-der test, inter-individual variations of head size and shape cause small differences of at-ear pressures and arrival times [25] that are even smaller than the just noticeable differ-ences [26]. Thus, the recordings were carried out with a dummy head (Neumann KU100) that enabled an accurate recording of the sounds at the entrance of the (blocked) ear canal. The dummy head was precisely arranged at the position of a subject’s head during the actual presentation (see Fig. 3) and was calibrated by using a Br¨uel & Kjær Type 4231 sound calibrator at 1 kHz. Thus, twelve stimuli were recorded this way corresponding to each of the three azimuths (−90◦, 0◦ and 90◦) in each of the four spatial configurations (Fig. 2).
The stimuli were presented over Sennheiser HD650 headphones (circumaural, open). The output level of the system was adjusted by placing the headphones on the cal-ibrated dummy head. The session took place in the same listening room as in the loudspeaker session. Subjects sat in the same chair, but no loudspeaker was mounted in any of the tested directions so that subjects could not match the sounds they heard with an identifiable sound source.
Sub-Fig. 3. Position of the dummy head, maintained by the headrest and chin rest, during the recording of the stimuli.
jects were asked to place the test headphones comfortably over their ears and to not modify this position once the test had started as realistic changes in the headphone position can be audible [27]. Subjects had to carry out eight loud-ness equalizations, corresponding to the two equalizations (one for each test sound) in each of the four spatial config-urations of the session 1 (see Fig 2).
In order to compare the effect of the sole ITD on the loudness of pure tones to that of the narrow-band noise used as stimulus in this experiment, one additional equal-ization was realized in this session. Its reference sound was the narrow-band noise directly synthesized and played back through the headphones (without being recorded by the dummy head) in a diotic presentation, at the same ref-erence level than the previous stimuli (50 phon). The test soundthat was to be equalized on this reference sound was the same narrow-band noise directly synthesized with a fixed 772 µs time difference applied between the two chan-nels. This value was also used in the previous experiments on the effect of ITD on loudness [9, 11, 12].
These nine equalizations were done in the same session that lasted approximately 30 min. Stimuli appeared in a random order for each subject.
2 Results
Since the PSE is the level difference for which a test soundis perceived as loud as a reference sound, a negative PSE means that a lower sound pressure level was required for the test sound to match the reference sound in loudness. Thus, when providing both sounds with the same pressure level, the test sound would have been perceived louder than
PAPERS DIRECTIONAL LOUDNESS OF LOW-FREQUENCY NOISES
the reference sound, indicating a higher loudness sensitiv-ity to directional sounds. The results are subsequently pre-sented as DLS for the rest of the paper:
DLS = −PSE (2)
The outcome of the ninth equalization (involving diotic and dichotic headphone-synthesized stimuli) presented in the same session as the virtual presentation does not prop-erly result from the comparison of real sources located in different directions but from sounds differing in their ITDs only. This loudness match will also be denoted as DLS for sake of clarity.
In order to investigate the effect of the presentation con-ditions on directional loudness, a repeated-measures anal-ysis of variance (ANOVA) was conducted on the sixteen DLS values obtained in actual and virtual presentations. The spatial configuration (4 levels) and the test sound az-imuth (2 levels) were also included as factors of the analy-sis:
• Presentation conditions (2 levels): actual, virtual. • Spatial configuration (4 levels): configurations a, b, c, d. • Azimuth (2 levels): −90◦, +90◦.
Results of this ANOVA are given in Table 1. As this study primarily focuses on the effects of the presentation condi-tions on the DLS, the significant effects involving this fac-tor will be discussed first. Other significant effects, namely the “spatial configuration” effect and its interaction with the sound source azimuth are caused by the room effect. The main consequences of this room effect is that the DLS values themselves are not consistent with the loudness gain provided by the lateralization of a sound source in one given spatial configuration within the room, leading to an inconsistent pattern across the configurations identifiable on Fig. 4 and Fig. 5. However, the room effect is likely to be cancelled when averaging DLS values across the spatial configurations, and it did not have any influence on the pre-sentation conditions effects since it was globally the same whether the sounds were reproduced over headphones or loudspeakers, and was therefore present in a similar way in the actual and virtual presentation conditions.
2.1 Presentation conditions effects
One of the main results regarding this analysis is that the presentation conditions proved to have significant ef-fects on the DLS. These efef-fects were dependent on the spatial configuration and on the test sound azimuth, as in-dicated by the significant “presentation conditions × spa-tial configuration × azimuth” interaction. Bonferroni post-hoc tests revealed a significant difference between the two presentation conditions in the spatial configuration c when the test sound was located at −90◦(p < .001) or at +90◦ (p = .007). In this configuration and for these two az-imuths, DLS was larger in the virtual presentation than in the actual presentation, as shown in Fig. 4.
Presentation conditions effects also appeared to depend on the spatial configurations when combining the test
soundazimuths as the “presentation conditions × spatial configuration” interaction proved to be significant. Thus, the effect of the presentation conditions on DLS was not the same for all spatial configurations of the sound sources. Bonferroni post hoc tests revealed a significant difference between the two presentation conditions in the spatial con-figurations c (p < .001) and d (p = .016) only. In these two configurations, DLS was larger in the virtual presenta-tion than in the actual presentapresenta-tion, as shown in Fig. 5. As depicted in Fig. 2, the configurations c and d were similar in the way that the reference sound source was at a distance of 1 m from the subject, whereas it was at a distance of 2 m in configurations a and b. Then, the fact that DLS did not significantly depend on the presentation conditions in the configurations a and b whereas they did significantly de-pend on the presentation conditions in the configurations c and d is likely to be caused by the distance of the frontal sound source.
To summarize about these two interactions :
• DLS was similar whether the sound sources were actual or virtual when the frontal sound source was located at 2 m from the subjects.
• Virtual sound sources yielded to larger DLS than actual ones when the frontal sound source was located at 1 m from the subjects, for each of the two azimuths in the configuration c and when combining the two azimuths in the configuration d.
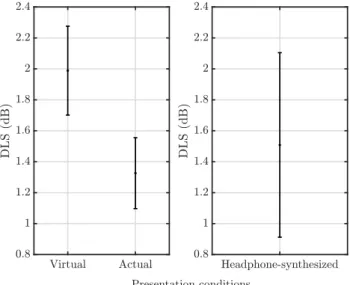
Finally, the presentation conditions proved to have a sig-nificant effect when combining all spatial configurations and azimuths, as shown by the significance of the “pre-sentation conditions” simple effect. As indicated in the left part of Fig. 6, DLS was significantly larger with the vir-tual presentation of the sounds than with the acvir-tual one. The right part of the figure depicts the DLS obtained for the noise synthesized and directly reproduced over head-phones with a fixed 772 µs ITD between the two channels. A t-test revealed that this DLS is significantly larger than zero (t(19) = 5.296, p < .001) and is about 1.5 dB, which is in agreement with the previous findings on the effect of ITD on loudness for pure tones [9, 11, 12]. In addition, independent-samples t-tests revealed that neither the DLS obtained in virtual (t(29.949) = 1.5011, p = .144) nor ac-tual (t(178) = −.531, p = .596) presentation conditions is significantly different from the DLS of the stimulus with a fixed ITD. The DLS was also significantly larger than zero in both virtual (t(159) = 13.677, p < .001) and ac-tual (t(159) = 11.433, p < .001) presentation conditions.
At the frequencies under investigation, the fact that the DLS is larger than zero is likely to be accounted for by the ITD. Then, the average time difference between the two channels of the dummy head was measured for each test sound(two azimuths and four spatial configurations) in or-der to be compared to the fixed 772 µs ITD. These eight
1corrected due to a violated assumption of homogeneity of
Source SS DF MS F Sig.p Presentation conditions 35.099 1 35.099 19.946 <<< ...000000111 Spatial configuration 182.546 3 60.849 59.740 <<< ...000000111
Azimuth .023 1 .023 .017 .899
Presentation conditions × spatial configuration 29.282 3 9.761 11.671 <<< ...000000111 Presentation conditions × azimuth .183 1 .183 .234 .634 Spatial configuration × azimuth 265.726 3 88.575 76.301 <<< ...000000111 Presentation conditions × spatial configuration × azimuth 10.358 3 3.453 4.170 ppp=== ...000111
Table 1. ANOVA results.
measurements led to a slightly higher average ITD than 772 µs (µ = 859 µs, σ = 19 µs), but should not lead to a significantly different DLS [28].
2.2 Spatial configuration effects
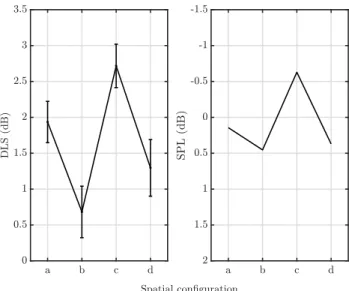
The ANOVA also revealed that the spatial configura-tion had significant effects on the DLS values. In other words, the loudness ratio between lateral and frontal sound sources was not the same depending on the spatial configu-ration of the sound sources in the listening room. Since this room was not anechoic, these effects are likely to be caused by sound pressure variations at the ears of the listeners and of the dummy head even though the four loudspeak-ers were calibrated to deliver the same level at the center of the subjects heads and of the dummy head. Therefore, at-ear SPL variations affecting frontal and lateral sources will also affect the DLS values resulting from the comparison of these two sources, as indicated by the “spatial config-uration” simple effect and by the “spatial configuration × azimuth” interaction. As an example, a spatial configura-tion for which the reference sound pressure level is lower than that of the reference sound in another spatial config-uration would lead to higher overall DLS values. In order to verify this hypothesis, the reference sound pressure lev-els were measured on each ear of the dummy head in each spatial configuration and averaged over the two ears, be-fore being compared to the overall DLS value in each spa-tial configuration. The results are depicted on Fig. 7, and show a good match between the two patterns. These SPL variations (Fig. 7 right) appear to partially account for the DLS dependency on spatial configuration (Fig. 7 left), al-though one should keep in mind that the SPL of the lateral test sound is also involved in DLS. It should be empha-sized that the Y-axis of the right figure is reversed since reference soundpressure level and DLS values are anticor-related. The 0 dB in this figure is the level delivered by the reference sources(50 phon) at the center of the head.
The DLS value in each spatial configuration may then per senot be representative of the directional loudness ef-fect in a given configuration because of these SPL varia-tions. On one hand, if a loudspeaker delivered a lower SPL than its neighbour at the ears of the listeners and of the dummy head, this results in a higher DLS value in the spa-tial configuration in which it is the reference source. On the other hand, the DLS value in the spatial configuration where its neighbour is the reference (see Fig. 1 and Fig. 2) will be proportionally lower. Thus, the room effect is likely
to be averaged over the four spatial configurations. This is supported by the good match between the averaged DLS obtained with the room acoustic and the DLS obtained with ITD only (Fig. 6) since at the frequencies under investi-gation, directional loudness is expected to be mostly ac-counted for by ITD.
In addition, these at-ear SPL differences were present in the two presentation conditions because of the binau-ral recording method employed for creating virtual sound sources. Inter-individual SPL variations may have resulted from the coupling between the headphone and each indi-vidual listener’s ears, but the average at-ear SPLs were as-sumed to follow a similar pattern as the one measured by the dummy head and depicted on the right of Fig. 7. In con-clusion, these SPL differences are not likely to account for the observed effects of the presentation conditions on the DLS.
3 Discussion
The results of the experiment show that:
• The loudness of a low-frequency narrow-band noise was higher when it was located at the side of a listener than when it was located at the front, for the two presentation conditions under investigation.
• This increase was not different, for both presentation conditions, from the increase observed with ITD only. • The increase was inferior in the actual presentation
(sounds stemming from actual loudspeakers) than in the virtual presentation (binaural recording of the loudspeaker-reproduced stimuli, with no loudspeakers mounted in the tested directions) when the frontal sound source was at a distance of 1 m from the subject. • The increase was the same in both presentation
condi-tions when the frontal sound source was at a distance of 2 m from the subject.
• For the positions were the frontal sound source was at a distance of 1 m, this increase occurred for each of the two lateral source azimuths in configuration c whereas it occurred only when combining the two azimuths in configuration d.
3.1 Effect of the presentation conditions
The overall DLS obtained in the actual presentation con-ditions was lower than the DLS obtained in the virtual pre-sentation conditions. This result is in agreement with those
PAPERS DIRECTIONAL LOUDNESS OF LOW-FREQUENCY NOISES
Virtual presentation Actual presentation
Spatial configuration
Fig. 4. DLS as a function of the azimuth of the test sound in each spatial configuration for the two presentation conditions, with 95% confidence intervals.
Virtual presentation Actual presentation
Fig. 5. DLS as a function of the spatial configuration for the two presentation conditions, with 95% confidence intervals.
obtained by Epstein and Florentine [13, 14], who measured a lower binaural-to-monaural ratio when increasing the ecological validity of their experiments by displaying stim-uli through loudspeakers rather than through headphones and by adding visual cues to their stimuli. As a result, bin-aural or directional loudness investigations achieved under controlled laboratory presentation conditions are likely to highlight isolated phenomenons that affect binaural loud-ness summation but whose observed magnitude could be higher than when observed in real life. Comparatively, ex-periments designed using real sound sources along with vi-sual cues are likely to highlight closer to natural magnitude effects.
According to the results of the present study, the dis-tance of the frontal sound source (displaying the reference sound) had a different effect on DLS in the two presenta-tion condipresenta-tions. Since both auditory [29] and visual [30] distance cues were reported to affect loudness, these tance cues could account for the variation of DLS with dis-tance.
Fig. 6. DLS as a function of the presentation conditions (left) and for headphone-synthesized stimuli (right), with 95% confidence intervals.
3.2 Auditory cues
Since the SPL was fixed at a same listening point for the four loudspeakers, it did not vary whether the sound sources were at 1 or 2 m from the subjects and could not ac-count for DLS variations. On the other hand, other acoustic characteristics of the sound could be affected by the dis-tance of the sources (i.e., direct-to-reverberant ratio, spec-tral energy distribution. . . ) [7]. Those characteristics were similar in the two presentation conditions thanks to the bin-aural recording used in the virtual presentation. Some dif-ferences might however have resulted from the difdif-ferences between the subjects’ individual HRTFs (that filtered the sounds in the actual presentation) and the dummy head HRTFs (that filtered the sounds in the virtual presentation). Yet, HRTFs depend on source distance only in proximal space (< 1 m and even closer at the frequencies under in-vestigation) [31, 32]. Then, even if a different filtering
oc-Fig. 7. DLS as a function of the spatial configuration (left) com-pared to the average SPL between the two ears of the dummy head for the reference sound (right) in each spatial configuration.
curred in the actual and virtual presentation conditions, the differences should remain the same whether the source is at 1 or 2 m from the subjects.
Furthermore, it could be considered that the DLS depen-dency on source distance was not determined by the au-ditory distance cues themselves but by the resulting per-ceived distance. Then, a potential effect of visual cues to distance should also be discussed since visual estimates of distance are better than auditory estimates [33].
3.3 Visual cues
The visual cues to distance were not the same in the two presentation conditions. In the virtual presentation, neither frontal nor lateral sound sources were visible and subjects had little if any clue to physical sources that may have re-produced the sounds they heard. In the actual presentation, visual cues for the frontal sound sources were available to the subjects during the whole procedure, which was not the case for the lateral sound sources because of the headrest and chin rest that maintained their heads in a fixed position. Thus, subjects did not have the same access to visual infor-mation according to the presentation conditions and to the azimuth of the sources.
When the frontal sources were visible and close to the subject (that is in the actual presentation conditions in the spatial arrangements c and d, see Fig. 2), DLS was signif-icantly lower than when they were not visible (that is in the virtual presentation conditions). This decrease means that the loudness of the reference and test sounds tended to get closer. Since DLS was positive (i.e., test sounds were perceived louder than reference sounds), the DLS lower-ing could be due either to an increase in loudness of the reference sound or to a decrease in loudness of the test sound. In each spatial configuration of the sources, DLS was assessed on both 1 and 2 m distant lateral test sounds. Thereby, if the distance of the lateral sound source affected DLS in any way, its effect would be canceled in each spatial
configuration because of the assumed left/right symmetry of directional loudness [9]. Thus, the observed DLS dif-ferences between the two presentation conditions are more likely to be accounted for by the loudness of the frontal reference sounds. Following this hypothesis, the loudness of sounds that come from visible and close sources would be higher than the loudness of sounds that come from in-visible or farther sources at a same physical level deliv-ered to the listener. Such an effect was reported for visible sources in an anechoic room: the loudness related to a loud-speaker located at 3.75 m was less than when at 2.25 m, even though the sound pressure level was fixed at the po-sition of the listener [30]. This explanation could also ac-count for the fact that no DLS difference was observed be-tween the loudspeaker and headphone presentation condi-tions investigated by Sivonen et al. [2, 16] since visual cues were provided in the two conditions.
3.4 Other factors
In the present experiment, listeners were aware that the sounds they heard were displayed whether by loudspeakers or by headphones in the corresponding test sessions. This awareness could have had an effect on the loudness pro-cessing of the sounds [14], independently from physical changes in the heard stimuli, and the exact same sounds could somehow have led to different DLS judgments ac-cording to the presentation conditions. Distance perception could also have interacted with other high level factors, for example the externalization of the sound sources. Even though relations between externalization of a sound source (i.e., perceiving a sound as coming from the exterior of the head) and perceived distance are not fully established yet [34], it could be hypothesized that sound externalization played a role in the observed loudness summation. Sounds are likely to be internalized (i.e. perceived as coming from ”inside” the head) when they are reproduced over head-phones, especially when displayed at the front (0◦) than at the side (±90◦) of a listener [35, 36]. On the other hand, sounds reproduced over actual sound sources are reported to be externalized whatever their location with respect to the listener [37]. Then, the degree of externalization could not have been the same for reference (located at 0◦) and test sound(located at ±90◦) sources in the virtual presen-tation conditions, while it should have been the same for all sound sources in the actual presentation conditions. This could have had an effect on the perceived sound sources distance, and as a consequence on the resulting DLS.
4 Conclusion
The results of this experiment extended the previously highlighted effect of ITD on loudness of stimuli displayed under unrealistic listening conditions to that of stimuli re-produced with natural binaural cues in a listening context with stronger ecological validity.
The directional loudness effect was found to be depen-dent on the presentation conditions in which the sounds were perceived. More precisely, the loudness of sounds was
PAPERS DIRECTIONAL LOUDNESS OF LOW-FREQUENCY NOISES
increased by a higher amount when they were side-located and heard in virtual presentation conditions with no visi-ble sound source than when they were presented by actual sound sources located at the side of the listener. This only occurred when the frontal sound source, used as a refer-ence, was located at the closest studied distance (1 m) from the subject. One hypothesis accounting for these observa-tions is that for a same sound pressure level, sounds pro-duced by frontal sources could have been perceived louder when the sources were located at 1 m from the subject than when they were located at 2 m from the latter, provided the sound sources were visible. This condition was only ful-filled in the actual presentation conditions. These DLS dif-ferences could also be accounted for by other parameters that varied between the two presentation conditions, such as the HRTFs used, or more globally by high level pro-cesses that rely on the presentation conditions themselves rather than on their effects on the stimuli.
5 Acknowledgments
The authors wish to thank the staff from the “Image & Son” department of the University of Brest and all the par-ticipants of this experiment.
This work was supported by the ANR-13-CORD-0008 EDISON 3D project, funded by the French National Agency of Research (http://www. agence-nationale-recherche.fr/).
6 REFERENCES
[1] D. W. Robinson, L. S. Whittle, “The loudness of directional sound fields,” Acta Acust. united Ac., vol. 10, no. 2, pp. 74–80 (1960).
[2] V. P. Sivonen, W. Ellermeier, “Directional loudness in an anechoic sound field, head-related transfer functions, and binaural summation,” J. Acoust. Soc. Am., vol. 119, no. 5, pp. 2965–2980 (2006), doi:https://doi.org/10.1121/ 1.2184268.
[3] V. P. Sivonen, “Directional loudness and binau-ral summation for wideband and reverberant sounds,” J. Acoust. Soc. Am., vol. 121, no. 5, pp. 2852–2861 (2007), doi:https://doi.org/10.1121/1.2717497.
[4] V. P. Sivonen, W. Ellermeier, “Binaural loudness for artificial-head measurements in directional sound fields,” J. Audio Eng. Soc., vol. 56, no. 6, pp. 452–461 (2008).
[5] N. Zacharov, O. Tuomi, G. Lorho, “Auditory pe-riphery, HRTF’s and directional loudness perception,” pre-sented at the 110th Convention of the Audio Engineering Society Convention(2001 May), convention paper 5315.
[6] I. Dash, L. Miranda, D. Cabrera, “Multichannel Loudness Listening Test,” presented at the 124th Conven-tion of the Audio Engineering Society ConvenConven-tion (2008 May), convention paper 7451.
[7] B. C. J. Moore, “Space perception,” in An Introduc-tion to the Psychology of Hearing, pp. 245–250 (BRILL, Leiden, Netherlands) (2012).
[8] B. C. J. Moore, B. R. Glasberg, A. Varathanathan, J. Schlittenlacher, “A loudness model for time-varying
sounds incorporating binaural inhibition,” Trends Hear., vol. 20 (2016), doi:https://doi.org/10.1177/ 2331216516682698.
[9] V. Koehl, M. Paquier, “Loudness of low-frequency pure tones lateralized by interaural time differences,” J. Acoust. Soc. Am., vol. 137, no. 2, pp. 1040–1043 (2015), doi:https://doi.org/10.1121/1.4906262.
[10] G. F. Kuhn, “Model for the interaural time differ-ences in the azimuthal plane,” J. Acoust. Soc. Am., vol. 62, no. 1, pp. 157–167 (1977), doi:https://doi.org/10.1121/1. 381498.
[11] V. Koehl, M. Paquier, E. Hendrickx, “Effects of in-teraural differences on the loudness of low-frequency pure tones,” Acta Acust. united Ac., vol. 101, no. 6, pp. 1168– 1173 (2015), doi:https://doi.org/10.3813/AAA.918909.
[12] G. Berthomieu, V. Koehl, M. Paquier, “Influence of interaural time differences on loudness for low-frequency pure tones at varying signal and noise levels,” Proc. Mtgs. Acoust., vol. 30, p. 050004 (2017), doi:https://doi.org/10. 1121/2.0000553.
[13] M. Epstein, M. Florentine, “Binaural loudness summation for speech and tones presented via ear-phones and loudspeakers,” Ear Hear, vol. 30, no. 2, pp. 234–237 (2009 Apr.), doi:https://doi.org/10.1097/AUD. 0b013e3181976993.
[14] M. Epstein, M. Florentine, “Binaural loudness summation for speech presented via earphones and loud-speaker with and without visual cues,” J. Acoust. Soc. Am., vol. 131, no. 5, pp. 3981–3988 (2012 May), doi: https://doi.org/10.1121/1.3701984.
[15] J. Blauert, “Distance hearing and inside-the-head locatedness,” in Spatial Hearing: The Psychophysics of Human Sound Localization, p. 116 (MIT Press, Cam-bridge, MA) (1997).
[16] V. P. Sivonen, P. Minnaar, W. Ellermeier, “Effect of direction on loudness in individual binaural synthesis,” presented at the 118th Convention of the Audio Engineer-ing Society(2005 May), convention paper 6512.
[17] E. H. A. Langendijk, A. W. Bronkhorst, “Fidelity of three-dimensional-sound reproduction using a virtual audi-tory display,” J. Acoust. Soc. Am., vol. 107, no. 1, pp. 528– 537 (2000), doi:https://doi.org/10.1121/1.428321.
[18] B. R. Glasberg, B. C. J. Moore, “Derivation of au-ditory filter shapes from notched-noise data,” Hear. Res., vol. 47, no. 12, pp. 103–138 (1990), doi:https://doi.org/10. 1016/0378-5955(90)90170-T.
[19] B. A. Edmonds, J. F. Culling, “Interaural correla-tion and the binaural summacorrela-tion of loudness,” J. Acoust. Soc. Am., vol. 125, no. 6, pp. 3865–3870 (2009), doi: https://doi.org/10.1121/1.3120412.
[20] ISO 226, “Acoustics – Normal equal-loudness-level contours,” (2003).
[21] ANSI S3.21, “Methods for manual pure-tone threshold audiometry,” (2004).
[22] H. Levitt, “Transformed updown methods in psy-choacoustics,” J. Acoust. Soc. Am., vol. 49, no. 2B, pp. 467–477 (1971), doi:https://doi.org/10.1121/1.1912375.
[23] ISO 3382-2, “Measurement of room acoustic pa-rameters - Reverberation time in ordinary rooms,” (2008).
vol. 65, pp. 589–599 (2017b), doi:https://doi.org/10.17743/ jaes.2017.0018.
[37] W. M. Hartmann, A. Wittenberg, “On the exter-nalization of sound images,” J. Acoust. Soc. Am., vol. 99,
no. 6, pp. 3678–3688 (1996), doi:https://doi.org/10.1121/ 1.414965.
THE AUTHORS
Gauthier Berthomieu Vincent Koehl Mathieu Paquier
Gauthier Berthomieu was born in Mont-de-Marsan, France, in 1994. He received the M.Sc. degree in sound engineering from the “Image & Sound” department of the University of Brest in 2016. Since 2016, he is a Ph.D. stu-dent at the University of Brest where he works on 3D sound perception and more particularly on directional loudness. He is a member of the Audio Engineering Society.
r
Vincent Koehl was born in Cr´ehange, France, in 1978. He graduated from the National Institute for Applied Sci-ences (INSA) of Lyon (France) in Mechanical Engineer-ing in 2001 (M.Sc. degree) and received a Masters Degree in Acoustics in 2002. In 2005, he received a Ph.D. degree for his work about the effects of structural uncertainty on sound quality accomplished at the Laboratory for Vibration and Acoustics (LVA). Vincent Koehl is now Associate
Pro-fessor at the University of Brest, France. His main research interests are the perceived quality of sound reproduction systems, 3D sound perception, spatial audio recording and rendering technique. Dr. Koehl is a member of the French Acoustical Society, elected to the Board of the Sound Per-ception Group.
r
Mathieu Paquier was born in Bordeaux, France, in 1974. He received the M.Sc. degree in sound engineering from the University of Brest in 1997, then a Ph.D. degree in acoustics from the University of Lyon in 2002. He is Pro-fessor and head of the “Image & Sound” department of the University of Brest since 2016. Pr. Paquier’s research inter-ests mainly include the evaluation of spatial sound and the perception of headphone restitution.