Thirty-fifth Regular Meeting of the Executive Committee
2016-2017 Program Budget – Rev 1
San Jose, Costa Rica
July 15-16, 2015
Draft
Program
Budget
2016-2017
Inter-American
Institute for
Cooperation on
Agriculture
June 2015
CONTENTS
Introduction ... 1
I.
Main Criteria for the 2016-2017 Program Budget ... 2
II.
Strategic Objectives and their Implementation in the 2016-2017 biennium ... 4
III.
Budget for the 2016-2017 biennium ... 8
IV.
Financial Strengthening ... 13
V.
List of Tables Attached ... 16
FOREWORD
oday more than ever before, agriculture is immersed in a world of enormous challenges and opportunities, which requires us to work to build a highly productive agricultural sector in the hemisphere and turn it into the essential source for the comprehensive nourishment of a society in constant growth. A competitive agricultural sector is also capable of generating income for countries and individuals, allowing them to take advantage of the opportunities afforded by international trade and traditional agricultural commodity, raw material markets as well as newer ones, such as clean energies. We must adapt to these as quickly as possible, and ensure the adequate use of water resources and soil as an imperative for sustainable development. Through organized work, we must also strive for a more prosperous, inclusive, productive and equitable agricultural sector.
We are convinced that agriculture in the Americas has enormous potential to provide the countries of the region with a productive base that will promote their development and ensure the food security of their inhabitants. We also believe that IICA’s member countries are committed to finding joint solutions to our common problems, continuing to meet the challenges facing the agricultural sector and preparing for the coming years.
The Executive Committee, authorized by the Inter-American Board of Agriculture (IABA), approved the 2014-2018 Medium Term Plan (MTP). This plan acknowledges that, in order to achieve the great objectives of agriculture, on which Institute, as an international organization, has focused its efforts and capacities, the coordinated action of countless national, regional and hemispheric stakeholders is required.
At IICA, we have a philosophy of continuous improvement and a commitment to deliver results that contribute to meet the challenges faced by our member countries and our partners; for this reason, we have developed a cooperation model that ensures that the Institute’s contributions have greater impact and social value.
The 2014-2018 MTP sets out to achieve four strategic objectives; in order to accomplish these, the Institute will focus its work on eleven contributions, through the implementation of the following instruments: a) flagship projects; b) rapid response actions; c) pre-investment initiatives (Technical Cooperation Fund - FonCT); and d) externally funded projects that are
The Institute has reinforced its operations through the solid integration of its technical services and its administration. The strengthening of the institutional culture is based on an austere and responsible management in the use of resources, with a clear focus on achieving results, improving processes, implementing a monitoring and evaluation system and promoting transparency and accountability.
Our goal for 2018, the year in which my administration ends, is to deliver to the hemisphere an organization strengthened in its technical and corporate capacity. The approval of the 2016-2017 Program Budget will enable the Institute to implement and consolidate the new technical cooperation model described in the MTP, design inclusive collaborative strategies in the 34 Member States, continue to provide support to the regional integration and cooperation mechanisms, develop cooperation agendas with new strategic partners and operate more efficiently and effectively through the four technical cooperation instruments established in the MTP.
However, it is our duty to insist on the urgent need to financially strengthen the Institute, so that it can better respond to the mandates received. This strengthening cannot be postponed, given the freezing of quota contributions during the last 20 years and the irreversible decline of resources from the miscellaneous income fund, combined with the rising costs of personnel, goods and services. This situation has produced a real decrease in our resources and has affected our possibility of maintaining the level of technical capacity that we have had until this year. I can assure you that every dollar invested in the Institute is a dollar that favors the agricultural sector of your countries and that, as a cooperation organization, IICA contributes to the creation of public goods that can be capitalized by all our clients and partners. Our work is aimed at achieving the great transformations required by the agricultural sector as the axis of development. Every resource that you entrust to us will be used in an efficient, effective and pertinent manner to deliver results because, I repeat, that is our commitment until the last day of my administration.
Víctor Manuel Villalobos Director General
2
I.
MAIN CRITERIA OF THE 2016-2017 PROGRAM BUDGEThe present document contains the draft Program Budget of the Inter-American Institute for Cooperation on Agriculture (IICA) for the period 2016-2017, based on the mandate issued in Resolution IICA/CE/Res. 593 (XXXIV-O/14) of the Thirty-Fourth Regular Meeting of the Executive Committee on May 22, 2014. This program is based on the following main criteria:
1. Definition of the quotas of the Member States using the scale approved by the OAS, pursuant to Resolution AG/RES. 2860 (XLIV-O/14), applicable to IICA during the 2016-2017 biennium.
2. The new structure for technical cooperation set forth in the 2014-2018 Medium Term Plan, geared to attaining results and managed through four instruments: flagship projects, rapid response actions, initiatives of the Competitive Fund for Technical Cooperation (FonCT) and externally funded projects.
3. Based on the strategic objectives, it will promote the changes necessary to increase efficiency and efficacy, and the potential of technical cooperation actions, in order to contribute to each of the countries in the hemisphere.
4. With this Program Budget, the Member States are assured of the institutional commitment and capacity to help address their agricultural needs and to achieve sustainability, competitiveness, rural well-being and food security.
5. A budgetary approach that establishes a direct link between the projects and the proposed results, strengthening the processes of planning, programming, monitoring, evaluation and accountability.
6. Global budget geared to specific projects that contribute more efficiently to agriculture in the Member States, aligned with institutional strategic planning.
7. An increase in the income budget based on Member State quotas for the 2016-2017 biennium, to maintain an operating level similar to that of 2015.
8. Assumes the increase of costs due to inflation, exchange rates and the irreversible decline of Miscellaneous Income.
9. Combined effect of the 10.5% increase in the income budget based on Member State quotas and a 29.5% reduction in miscellaneous income. This translates into a 3.3% net increase in the Regular Fund (quota and miscellaneous income), which corresponds to the variation in prices expressed in USD. This would enable the Institute to:
Preserve current operating levels and prevent the loss of technical cooperation capacity and infrastructure in the countries.
Maintain and strengthen the knowledge and management structures operated by the Institute as elements of cooperation in the countries.
Capitalize on the results achieved and the improvements made in its areas of influence, to generate the greatest benefits with lower operating costs (economies of scale).
10. There has been a steady decline in the Institute’s miscellaneous income, which cannot be reversed, due mainly to changes in the policies adopted by countries and donors in recent years with respect to the funds used to finance its projects:
Elimination of refunds on taxes paid during management of externally funded projects.
Restrictions on retaining the interest generated by the external funds administered by the Institute; stipulation that any yields obtained must be reimbursed to the projects themselves or to government treasuries.
The Miscellaneous Income Fund has made it possible to complement the Institute’s quota budget, which has been frozen in recent years. The following Figure shows the performance of this fund, which is expected to be completely depleted by 2017 if additional funds are not secured. Figure 1 shows the performance of the Miscellaneous Income Fund.
11. The scenario of zero growth in the quota budget would be equivalent to a cut of nearly 10% cut to the Regularin the Regular Fund budget, which in real terms would represent a deficit of more than 13%. This would be accentuated by the accumulated inflationary effect and other factors with a negative impact, such as the decline in miscellaneous income.
12. The direct effect of this cut on technical cooperation services would be reflected in the quantity, quality, coverage and depth of institutional operations, with a budget deficit of USD 2,881,000 in 2016. For 2017, additional measures would be needed to reduce operating costs and cooperation activities by USD 523,000, which would mean significant reductions in the services and results of technical cooperation and loss of management structures in the countries.
13. In corporate terms, this negative adjustment to the quota budget would also imply a reduction in the Institute’s substantive and operational activities, due to the need to eliminate some positions and personnel to cover the budget cuts, given the zero increase in quotas.
4
II.
STRATEGIC OBJECTIVES AND THEIR IMPLEMENTATION IN THE 2016-2017 BIENNIUMhe implementation of the 2014-2018 MTP will focus on the Institute’s four strategic objectives, eleven contributions and four instruments for action, which are described below:
Strategic Objectives
Overall allocation ofresources (%) 2016 - 2017 1. Improve the productivity and competitiveness of the agricultural sector 34.73 2. Strengthen agriculture’s contribution to the development of rural areas and the
well-being of the rural population
12.62 3. Improve agriculture’s capacity to mitigate and adapt to climate change and make
better use of natural resources
29.69 4. Improve agriculture’s contribution to food security 22.96
Note: the percentages are estimates that take into account all institutional costs for each of the strategic objectives and could vary in the course of implementation.
The eleven contributions on which the Institute the focuses its technical cooperation services: 1. Strengthen th e capabilities o f t h e Member States at t h e national, regional, m u l t i national a n d
hemispheric levels to establish public policies and institutional frameworks in order to make agriculture more productive and competitive, improve the management of rural territories, adapt to and mitigate the impact of climate change, and promote food and nutritional security.
2. Implement, through public and private institutions, technological, institutional and business innovation processes aimed at boosting the productivity and competitiveness of agriculture and the production of basic foodstuffs of high nutritional quality.
3. Increase the capabilities of the public and private sectors to ensure agricultural health and food safety and thereby improve productivity, competitiveness and food security.
4. Strengthen the business and associative capacities of the different stakeholders in the agricultural production chains.
5. Increase the capacity for area-based social management among stakeholders in rural areas, especially those involved in family agriculture, in order to improve food security and rural well-being.
6. Enhance the capabilities of different stakeholders of the agricultural chains and rural areas in the integrated management of water and sustainable use of soil for agriculture.
7. Increase the capacity of public and private institutions to promote and implement measures for adapting agriculture to climate change and mitigating its effects, as well as promoting integrated risk management in agriculture.
8. Improve the efficacy and efficiency of the food and nutritional security programs in the Member States. 9. Ensure that producers and consumers benefit from greater use of native species, promising crops
and genetic resources w ith fo od p ot en tia l .
10. Improve institutional capacity to reduce losses of food and raw materials throughout the agricultural chains. 11. Strengthen the Member States’ capacity for consensus and participation in international forums and
other mechanisms for the exchange of knowledge and mobilization of relevant resources for inter-American agriculture.
Technical Cooperation Instruments
1. Flagship Projects2. Rapid Response Actions
3. Pre-investment initiatives through the Technical Cooperation Fund (FonCT) 4. Projects financed with external resources
The overall purpose and relationship between the four objectives of the 2010 – 2020 Strategic Plan, the eleven contributions and the four technical cooperation instruments described in the 2014 – 2018 MTP, as well as the allocation of resources contemplated in the 2016 – 2017 Budget, is shown below: 12
Rapid Response Actions FonTC 1 2 3 4 5 6 7 8 9 10 11 Project Flagship Project Resources (thousands of USD)
1. Improve the productivity and competitiveness of the agricultural sector - Agricultural Chains - Family Agriculture - Agricultural Chains 66% 2. Strengthen agriculture's contributions to the development of rural areas and the well-being of the rural population
-Inclusion in Agriculture and Rural Territories
USD 12.742 USD 650 USD 1.000 - Inclusion in Agriculture and Rural Territories
1%
3. Improve agriculture's capacity to mitigate and adapt to climate change and make better use of natural resources - Resilience and Comprehensive Risk Management - Resilience and Comprehensive Risk Management 16% 4. Improve agriculture's contribution to food security - Agricultural Chains - Inclusion in Agriculture and Rural Territories - Resilience and Comprehensive Risk Management - Family Agriculture
USD 12.975 USD 650 USD 740 - Family Agriculture 17% 2016 USD 12.063 2016 USD 5.250 2016 USD 1.741 2016 USD 1.585 2016 USD 10.280 2017 USD 12.255 2017 USD 5.144 2017 USD 1.780 2017 USD 1.486 2017 USD 11.023
Basic Budget to support the Instruments of Technical Cooperation
Recovery of Proportional Indirect Costs
REPIC
Basic Cooperation Structures Member States
Other Technical Support Services
and Activities Management Units Corporate Activities
Recovery of Proportional Indirect Costs - REPIC
(estimate)
The 2016 - 2017 Program Budget and its relationship with the 2014-2018 Medium Term Plan Contributions
INSTRUMENTS FOR TECHNICAL COOPERATION /1
Flagship Projects External Resources (estimate) /2 Resources (thousands of USD) S tra te g ic O b je c ti v e s 2016 2016 USD 140.000 2017 2017 USD 150.000
Note: The recovery of indirect costs is subject to the signing of agreements for projects and their execution.
The Institute’s new technical cooperation model has been conceived as an integrating, flexible, practical, austere and efficient system that enables IICA to advance more rapidly toward the achievement of the strategic objectives and contributions, bringing about transformations in the member countries with greater value and social returns. It is based on the following criteria and elements:
A clear definition of the Institute’s key functions (institutional strengthening, capacity building, methodologies, processes and instruments, use and management of knowledge in projects, consensus building and linking of stakeholders, and comprehensive cooperation) that will facilitate experience.
1 The Agricultural Health and Food Safety (AHFS) projects are implemented through the four technical cooperation instruments
established in the MTP, and financed with both resources from the Regular Fund and external resources.
2 The amount of external resources generated depends on the legal instruments that IICA signs for the implementation of projects
related to the strategic áreas on which the MTP focuses, established based on the strategic objectives, the flagship projects, and the contributions. The amounts budgeted were determined based on estimates prepared by the Institute’s Offices and technical
6
An overarching approach to the provision of technical cooperation, articulating efforts at thehemispheric, multinational and national levels, with IICA’s differentiated country and regional strategies, respecting national priorities.
Results-driven programmatic execution using projects as the instrument for coordinating technical cooperation.
The issue of agricultural health and food safety (AHFS) is particularly important for the Institute and Its Member States, since it is a key factor for the implementation of projects at the national, regional, hemispheric, and even, global levels.
Efforts to address specific needs and emerging issues in the countries, through institutional rapid response actions.
The use of IICA’s network of offices in the countries and its own technical and administrative staff as well as that of its partners and allies.
The active and permanent participation of the corporate management and its strategic and operating services as an integral part of the technical cooperation services.
Priority allocation of institutional resources to the flagship projects, the FonCT initiatives and the rapid response actions (RRA), based on the contributions expected and achieved.
An efficient model for the monitoring and evaluation of results designed to promote the continuous improvement of the organization and its contributions in a direct and permanent manner.
Some results
In an unprecedented action, the implementation of the 2014-2018 MTP began mid-year in 2014, with a new “results-based management” approach to promote greater changes in the agricultural sector and contribute to sustainability, competitiveness, rural well-being and food security in the Latin American and Caribbean countries. In addition, direct links were established between projects, actions and results, thereby facilitating planning, execution, monitoring and evaluation as elements of continuous improvement. Some examples of the results achieved during 2014 include:
Improved capacity in 23 countries for the management of agrifood chains, business development, aggregation of value, associative management and marketing.
Promotion and dissemination of technological innovations in 15 countries for production of renewable energies; also, for forest products, sugar, maize, beans, yucca, avocado, potato and tomato with resources of the United States, the European Union, Switzerland and Finland.
Innovations in the production of quinoa, rice, cocoa, sweet potato, jatropha oil, greenhouse crops, livestock, bio-inputs and biogas, etc.
Improvements in the design and implementation of participatory social management and family agriculture models, helping to mobilize resources for area-based rural development. The conceptual design and implementation of these models demonstrated the viability of cooperation in at least 16 countries.
Strengthening of agricultural health services in the member countries, providing timely information on food safety; support for the participation of 22 Member States in international Codex and phytosanitary protection meetings; creation of the virtual school for plant health inspectors and various prevention activities implemented in border areas.
With Mexico’s support, 108 scholarships were made available to young professionals in agriculture, from different countries of the hemisphere.
With funding from Mexico, a capacity building program in agriculture was established for 15 Caribbean countries, through which training was provided to 295 people.
Both capacity-building activities were implemented at no cost to the Institute and with a high impact for the beneficiary countries, complementing the Institute’s cooperation actions.
Results of work already under way
In addition, other efforts are currently under implementation and could continue to achieve results with the approval of the 2016-2017 program budget. By way of example, we mention the following:
Implementation of the “Performance-Vision-Strategy” (PVS) tools and other initiatives aimed at strengthening official AHFS services, namely: a) PVS for National Plant Protection Organizations in 17 countries; b) PVS for National Food Safety Systems in 14 countries; c) PVS for National Veterinary Services in 10 countries and; d) PVS for Sanitary and Phytosanitary Measures in 28 countries.
In relation to sanitary and phytosanitary measures (SPS) and participation in international forums, specific strategic actions have been identified with the aim of strengthening capabilities in the LAC countries, based on the topics discussed in those forums. Example: strategic partnership with the International Plant Protection Convention (IPPC) to develop an online course in Pest Risk Analysis and the organization of regional meetings to discuss draft proposals for plant protection regulations.
Processes to strengthen agribusiness and associative capabilities in Costa Rica, Ecuador, El Salvador, Guatemala, Honduras, Nicaragua, Panama, Peru and Paraguay. During the last 2 years, the agribusiness and associative capabilities of more than 300 public and private stakeholders were strengthened in those countries.
Discussions and hemispheric seminars (in two languages) on policy reforms for agriculture in the USA, Brazil, Canada, Chile and the European Union, in preparation of the post-2015 development agenda, with the support of governments, universities and research centers of the respective countries and an average participation per seminar of 725 public and private stakeholders.
A virtual (online) platform, accessible to all 34 member countries (project SiGET - FonCT), was developed with different modules for knowledge management and capacity-building for the development of rural areas and inclusive family agriculture.
Technical information and knowledge linked to scientific and technological knowledge was developed specifically for family agriculture in the countries of the hemisphere.
Capacity-building processes have been consolidated using formal and informal methods that capitalize on learning based on training-action and direct work in the field.
Through direct cooperation, IICA publications and web site, to which the 34 member countries have access, information was disseminated on technologies and good agricultural practices that are “climate smart” and promote adaptation to climate change, mitigation of the impacts of agriculture and a greater resilience of the agricultural sector.
Efforts to combat pests and diseases of socio-economic and zoo/phytosanitary importance, such as actions to combat the fruit fly and the outbreak of coffee leaf rust in Mesoamerica, Peru and Jamaica.
8
III.
BUDGET FOR THE 2016-2017 BIENNIUMhe Institute finances its technical cooperation activities and operations, as mandated by its Governing Bodies, with resources from the Regular Fund, which is made up of Member State quotas and miscellaneous income, essentially obtained from financial yields, tax recovery and the sale of assets and certain services.
In addition, the Institute expands its cooperation actions by implementing externally funded programs and projects under agreements signed with partners and counterparts.
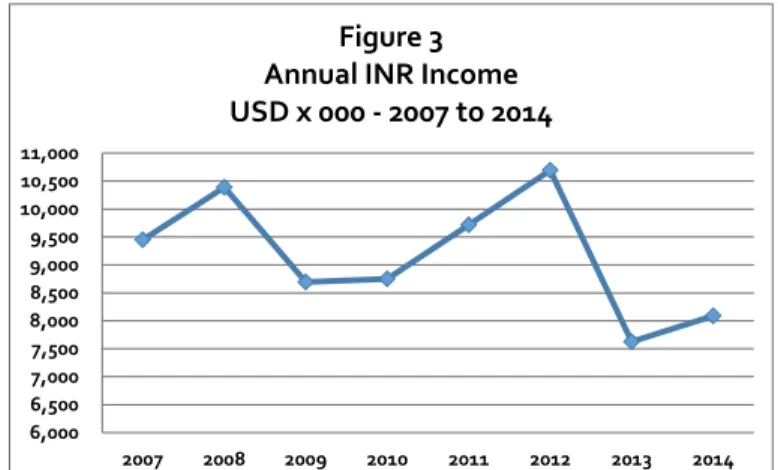
For the Institute, the management of external resources implies additional technical and administrative personnel, which has an impact on its operating costs. These additional costs are recovered through the Institutional Net Rate (INR) that counterparts have agreed to pay IICA (Recovery of Proportional Indirect Costs – REPIC).
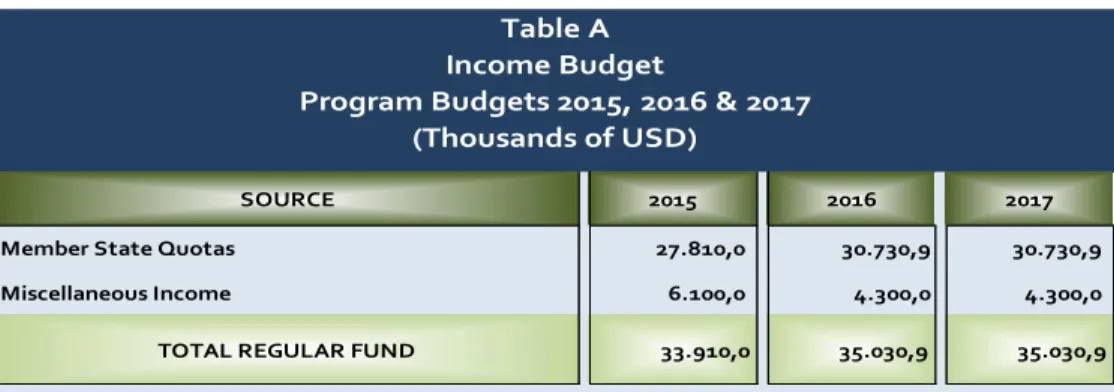
Income Budget of the Regular Fund
The income budget of resources from the Regular Fund is USD 35,030,900 for each year of the 2016-2017 biennium, made up of USD 30,730,900 from Member State quotas, considering a 10.5% increase for recovery, some over-quotas and USD 4,300,000 from miscellaneous income. Table A provides a breakdown of the income budget of resources from the Regular Fund.
The Kingdom of Spain contributes an annual quota of USD 60,000 as an Associate Member, under an agreement adopted at the First Plenary Session of the Eleventh Regular Meeting of the Inter-American Board of Agriculture, held on November 26, 2001 in Bávaro, Dominican Republic.
SOURCE 2015 2016 2017
Member State Quotas 27.810,0 30.730,9 30.730,9
Miscellaneous Income 6.100,0 4.300,0 4.300,0
TOTAL REGULAR FUND 33.910,0 35.030,9 35.030,9
Table A Income Budget
Program Budgets 2015, 2016 & 2017 (Thousands of USD)
Table No. 1, attached to this document, shows the percentage scale of the Member States’ quota
contributions according to the distribution approved by the OAS, considering the additional 10.5%, and the over-quota contributions of Argentina, El Salvador, Guatemala, Guyana, Mexico, Panama, Paraguay and Uruguay.
Table No. 2 summarizes the evolution of the Regular Fund budget since 1994 and the proposal for the
2016-2017 biennium, with the amounts indicated previously.
Expenditure Budget of the Regular Fund
a. Allocation of resources to Technical Cooperation Instruments
The Institute provides its technical cooperation, performs its corporate functions and delivers its products, services and results through three instruments of action financed with Regular Fund resources: Flagship Projects, Rapid Response Actions and pre-investment initiatives of the Technical Cooperation Fund-FonCT, and a fourth instrument, technical cooperation projects financed with external resources.
The so-called Flagship Projects constitute the backbone of IICA’s technical cooperation and are aimed at achieving the 11 institutional contributions proposed in MTP for the 2014-2018 period.
Rapid Response Actions are designed to address specific requests and opportunities for cooperation in a country, or a group of countries, in the face of political, social or economic changes, or in the event of environmental emergencies or other factors affecting the agricultural sector that require immediate attention and are related to the issues set forth in the MTP.
Pre-investment initiatives of the Technical Cooperation Fund (FonCT) focus on topics that are relevant to the projects and are used to secure additional funding and mobilize fresh resources to complement the Regular Fund and enhance the value of knowledge, through technical cooperation.
Similarly, the expenditure budget covers the costs of the basic office structures in the member countries, together with other services and technical support actions, such as cooperative programs, integration projects and technical support services, including the contributions to CATIE and CARDI, as well as the management units and corporate activities.
The Table below shows the Expenditure Budget of the Regular Fund by Programming Center:
PERSONNEL COSTS OPERATING COSTS TOTAL PERSONNEL COSTS OPERATING COSTS TOTAL 10.291.670 2.450.000 12.741.670 10.525.372 2.450.000 12.975.372 0 650.000 650.000 0 650.000 650.000 0 1.000.000 1.000.000 0 740.000 740.000 8.570.215 3.492.768 12.062.983 8.762.535 3.492.768 12.255.303 2.569.799 2.679.954 5.249.753 2.628.078 2.515.978 5.144.056 1.610.122 131.373 1.741.495 1.648.796 131.373 1.780.169 325.000 1.260.000 1.585.000 325.000 1.161.000 1.486.000 23.366.805 11.664.095 35.030.900 23.889.781 11.141.119 35.030.900 Management Units /d Corporate Activities /e TOTAL 2017 Flagship Projets /a
Rapid Response Actions FonCT
Basic structures in Member States /b
Other technical support services and actions /c
PROGRAMMING CENTERS
2016
TABLE B
Expenditure Budget of Resources from the Regular Fund by Programming Center - 2016-2017 (USD)
Notes:
a. Considers the personnel costs directly related to the flagship projects assigned to the Offices in the Member States and Headquarters.
b. The basic structures of the Offices in the Member States, including costs of the representative, administrative costs and technical personnel as well as operating costs.
c. Other technical support services and actions include resources allocated to cooperative programs, integration projects and technical support services. This item includes contributions to CATIE for USD 1,000,000 and to CARDI for USD 200,000.
d. The Management Units are comprised of the Offices of the Director General, the Deputy Director General and the Secretariat of Corporate Services, which includes four divisions.
e. Corporate activities include resources for the governing bodies and meetings; institutional insurance; pensions of former Directors General; contribution to the administration of the OAS Retirement and Pension Fund; contribution to the OAS Administrative Tribunal; External Audit; and the Emergency Assistance Fund for Institute Personnel.
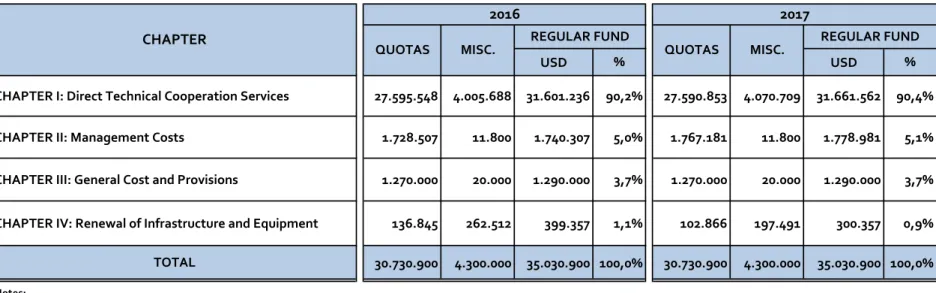
Table No. 3 presents the Program Budget by Chapter of Expenditure. b. Allocation by Major Object of Expenditure
Programming by Major Object of Expenditure (MOE) allows for a better estimate of expenditures and facilitates the follow-up and monitoring of implementation.
The Institute has nine objects of major expenditure, namely: 1. International Professional Personnel, 2. Local Professional and General Services Personnel, 3. Training and technical events, 4. Official travel, 5. Documents, materials and inputs, 6. Plant, equipment and furniture, 7. General services, 8. Performance contracts and transfers and; 9. Other costs.
10
Table C shows the distribution of the Regular Fund for the 2016-2017 biennium by Major Object ofExpenditure (MOE) and shows the distribution approved in the 2015 Program Budget, for comparative
purposes.
Table No. 4 shows the personnel positions financed with resources form the Regular Fund between 1992
and 2017. The Institute plans to maintain the same number of international professional positions as in 2015, (79), increase local professionals from 149 to 150 positions, and eliminate 3 general services positions, which will fall from 201 in 2015 to 198 in the 2016-2017 biennium.
The amount allocated to cover the costs of International Professional Personnel (79 positions), will rise from USD 11,142,300 in 2015 to 11,477,900 in 2016 and USD 11,784,900 in 2017, due to the effect of a 3.5% annual increase in the Salary Scale and adjustments in the percentages set aside for reserves, including a 3% increase in this item in 2016 and a 2.7% increase in 2017.
Local Professional Personnel (150 positions) will be financed with USD 7,783,900 in 2016 and USD 7,895,700 in 2017.
General services personnel has a cost of USD 4,105,000 in 2016, which will increase to USD 4,209,200 in 2017.
For local personnel, an average salary increase of 3.9% is estimated in 2016 and an additional 1.7% in 2017, based on the estimated inflation rate and variations in the exchange rates of the US dollar with respect to local currencies. This, together with changes in the number of positions and some classifications, implies an increase in local personnel costs of 3.3% in 2016 and 1.8% in 2017, a conservative estimate aimed at preventing IICA’s loss of competitiveness in the labor markets.
Operating costs total USD 11,664,100 in 2016, an increase of 3.6% with respect to the 2015 program budget, giving priority to the items related directly to technical cooperation, such as training and technical events. The figure for 2017 is USD 11,141,100, a 4.5% decrease in operating costs, given that the Regular Fund budget remains unchanged with respect to 2016, and the increases in personnel costs have to be absorbed.
c. External Resources and Recovery of Proportional Indirect Costs - RePIC (INR)
Projects financed with external resources are aimed at expanding and complementing IICA’s technical cooperation services and creating added value, by promoting projects with greater geographic coverage (regional and hemispheric) and a major impact on society. The tasks that IICA performs in these projects, whether of national, multinational, regional or hemispheric scope, are:
Comprehensive project management: IICA assumes the technical and administrative responsibility for the project and, therefore, the attainment of results and alignment with the 2014- 2018 MTP.
Administrative management: assumes responsibility for providing administrative, financial and accounting services to the project to ensure that the necessary resources and information are
USD x 000 % USD x 000 % USD x 000 % USD x 000 % USD x 000 %
1 International Professional Personnel 11.142,3 32,9% 11.477,9 32,8% 11.784,9 33,6% 335,6 3,0% 307,0 2,7% 2 Local Professional and General Services Personnel 11.504,5 33,9% 11.888,9 33,9% 12.104,8 34,6% 384,4 3,3% 215,9 1,8%
22.646,8 66,8% 23.366,8 66,7% 23.889,8 68,2% 720,0 3,2% 523,0 2,2%
3 Training and Technical Events 1.911,3 5,6% 2.380,2 6,8% 2.180,2 6,2% 468,9 24,5% -200,0 -8,4% 4 Official Travel 1.221,2 3,6% 1.156,8 3,3% 1.156,8 3,3% -64,4 -5,3% 0,0 0,0% 5 Documents and Materials and Supplies 851,9 2,5% 709,3 2,0% 709,3 2,0% -142,6 -16,7% 0,0 0,0% 6 Plant, Equipment and Furniture 317,8 0,9% 399,4 1,1% 300,4 0,9% 81,6 25,7% -99,0 -24,8% 7 General Services 2.914,2 8,6% 2.737,1 7,8% 2.737,1 7,8% -177,1 -6,1% 0,0 0,0% 8 Performance Contracts and Transfers 3.197,0 9,4% 3.404,1 9,7% 3.180,1 9,1% 207,1 6,5% -224,0 -6,6% 9 Other Costs 849,8 2,5% 877,3 2,5% 877,3 2,5% 27,5 3,2% 0,0 0,0%
11.263,2 33,2% 11.664,1 33,3% 11.141,1 31,8% 400,9 3,6% -523,0 -4,5% 33.910,0 100,0% 35.030,9 100,0% 35.030,9 100,0% 1.120,9 3,3% 0,0 0,0% SUBTOTAL PERSONNEL COSTS
SUBTOTAL OPERATING COSTS GRAND TOTAL Major Object of Expenditure
2015 2016 2017 VARIATION2016-2015 VARIATION2017-2016
Table C
Relative Weight and Evolution of the Major Objects of Expenditure of the Regular Fund 2015 and 2016 -2017 Program Budgets
provided for accountability and decision-making. It also ensures that expenditures are in line with the project objectives, results, outputs and activities.
Provision of specific technical cooperation: in accordance with the established terms of reference, where the Institute is responsible for providing total or partial cooperation for the agreed project. External resources will reach an estimated USD 140.0 million in 2016, and USD 150.0 million in 2017 while the resources obtained through the recovery of Proportional Indirect Costs would be approximately USD 10.3 million for 2016 and USD 11.1 million for 2017, achieving an estimated average RePIC of 7.9% in the biennium.
Note: Recovery of Proportional Indirect Costs – RePIC. This new term, which replaces the concept of the Institutional Net Rate –INR, is merely intended to provide a clearer understanding of its real meaning, without this implying any change in institutional policy.
Based on the proportion of the strategic objectives addressed by externally funded projects in 2015 and applying a similar proportion for 2016 and 2017, it is estimated that the projects financed with external resources during the next biennium would have an approximate contribution to each objective as shown below:
Strategic Objective
2016
% amount
million USD
2017
% amount
million USD
1. Improve the productivity and competitiveness of theagricultural sector 66% USD 92.4 66% USD 99.0
2. Strengthen agriculture’s contribution to the development of
rural areas and the well-being of the rural population 1% USD 1.4 1% USD 1.5 3. Improve agriculture’s capacity to mitigate and adapt to
climate change and make better use of natural resources 16% USD 22.4 16% USD 24.0 4. Improve agriculture’s contribution to food security 17% USD 23.8 17% USD 25.5
Note: The linear presentation is for the purpose of demonstration only and based on the strategic objectives, contributions, and four instruments of the MTP (flagship projects, rapid response actions, FonTC and Externally funded projects). I should be borne in mind that, the amount of resources assigned to each project notwithstanding, the technical cooperation provide under any given project may contribute to one or more of the strategic objectives.
Projection of external resources and indirect costs
Table D shows the projections for securing external resources for projects during the biennium and the
Recovery of Proportional Indirect Costs – RePIC, for each implementing office. This recovery means retrieving the indirect costs generated during implementation of externally funded projects, which reduces the erosion of the Regular Fund.
The amount of indirect costs recovered is subject to the signing and effective execution of agreements for the implementation of externally funded programs and projects.
It is important to note that the recovery of Proportional Indirect Costs enables IICA to preserve the financial base for the management of externally funded projects and maintain its management levels.
12
% % DIRECT COSTS RePIC TOTAL EXTERNAL RePIC DIRECT COSTS RePIC TOTAL EXTERNAL RePIC Costa Rica 2.500.000 183.350 2.683.350 7,3% 870.000 69.600 939.600 8,0% Guatemala 4.490.459 329.254 4.819.713 7,3% 2.380.959 193.544 2.574.503 8,1% Honduras 6.594.902 534.187 7.129.089 8,1% 6.500.000 526.500 7.026.500 8,1% Barbados 4.103.634 290.907 4.394.541 7,1% 3.738.318 261.682 4.000.000 7,0% Haiti 6.969.222 807.034 7.776.256 11,6% 5.232.594 615.116 5.847.710 11,8% Dominican Republic 364.708 28.242 392.950 7,7% 245.093 19.607 264.700 8,0% Colombia 663.653 46.826 710.479 7,1% 0 0 0 0,0% Ecuador 1.204.328 96.346 1.300.674 8,0% 1.134.328 90.746 1.225.074 8,0% Peru 5.088.422 506.137 5.594.559 9,9% 200.585 17.865 218.450 8,9% Venezuela 78.548 6.284 84.832 8,0% 0 0 0 0,0% Argentina 10.948.413 837.005 11.785.418 7,6% 9.175.360 734.029 9.909.389 8,0% Brazil 14.770.406 867.274 15.637.680 5,9% 14.558.000 844.240 15.402.240 5,8% Paraguay 775.463 62.037 837.500 8,0% 775.463 62.037 837.500 8,0% Uruguay 430.685 36.802 467.487 8,5% 517.758 48.586 566.344 9,4% Mexico 42.161.180 3.372.894 45.534.074 8,0% 42.163.180 3.370.894 45.534.074 8,0% Headquarters 6.552.981 513.412 7.066.393 7,8% 5.716.434 506.768 6.223.203 8,9% SUB-TOTAL 107.697.003 8.517.992 116.214.995 7,9% 93.208.073 7.361.214 100.569.287 7,9%Regional & other countries 22.023.153 1.761.852 23.785.005 8,0% 45.769.179 3.661.534 49.430.713 8,0%
TOTAL 129.720.156 10.279.844 140.000.000 7,9% 138.977.251 11.022.748 150.000.000 7,9%
Table D
Projection of External Resources and Recovery of Proportional Indirect Costs (RePIC - INR) 2016 - 2017 (USD and %)
OFICE
2016 2017
USD USD
Evolution of the Recovery of Proportional Indirect Costs (RePIC – INR)
Through the application of the policy established by this administration from 2010, the average RePIC (INR) rose from 5.30% in 2008 to 7.47% in 2014 (Figure 2). A rate of 7.5% is estimated for 2015, and a rate of 7.9% for 2016 and 2017.
* Estimated rate for 2015 to 2017
0,0% 1,0% 2,0% 3,0% 4,0% 5,0% 6,0% 7,0% 8,0% 2008 2009 2010 2011 2012 2013 2014 2015* 2016* 2017* 5,30% 5,95% 6,47% 6,24% 6,80% 7,01% 7,47% 7,50% 7,90% 7,90% Figure 2
Recovery of Proportional Indirect Costs (RePIC - INR) - %
Financial Statements from 2008 to 2014, estimate 2015 to 2017
An increase of nearly two percentage points in the rate of recovery of indirect costs has been achieved due to the special efforts of certain countries with legal or political restrictions that have clearly demonstrated their readiness to support the Institute in this important task of covering indirect costs.
Annex I lists the agreements formalized in 2014 for the implementation of externally funded projects. The
IV.
FINANCIAL STRENGTHENINGV.
In recent years, many changes have occurred in the agricultural sector that have created a challenging operating environment for IICA. The ever-growing demand for technical cooperation has also become more complex, requiring the Institute to respond more quickly and with increased capacity and the same or better standards of quality than in the recent past. In addition, IICA is required to include new topics in its work agenda, such as innovation, water, comprehensive risk management and the sustainable use of soil in agriculture, emerging issues that are a high priority for the countries, as established in the 2014-2018 Medium Term Plan and at meetings of the Executive Committee (EC) and the Inter-American Board of Agriculture (IABA).The need to strengthen IICA’s finances arises from the freezing of country quotas and the decline in miscellaneous income in recent years, together with the effects of inflation in the countries and changes in their fiscal and financial policies.
Figure 3 shows the evolution of Regular Fund (quotas and miscellaneous) during the period 1995 to 2015, in
accordance with the Program Budgets approved by the IABA. The dotted lines show the estimated trends that would occur with the proposed increase and without these financial strengthening measures. This Figure shows the strong decline in the real value of the resources, which has forced the Institute to permanently adopt measures to cut operating and personnel costs.
The need to increase the quota budget by 10.5 % exclusively refers to conserving the Institute’s “flotation line”, accomplishing the objectives established in the MTP, avoiding the loss of the cooperation structures already established in its member countries and continue delivering results of value to the agricultural sector; in other words, if this budget increase is not approved, it would mean a “cut” of more than 13%.
The Institute has implemented a strict plan to reengineer its processes and improve its operations, with measures of rationality and austerity to mitigate the effects of price increases, take full advantage of its capabilities and achieve economies of scale. The aim is to ensure the Institute’s financial viability and promote the multiplier effects of expenditure and technical cooperation in the target populations in the countries.
Although these strict measures to rationalize and ensure equity in the control of expenditure have been very successful and have enabled the Institute to mitigate the accumulated effects of the loss of real value of its income over the last 20 years (US$50 million, due to the combined effect of loss of real income and inflation), they cannot be maintained indefinitely without risking the loss of more talent and possible operational atrophy.
All these factors must be taken into account to ensure the successful implementation of the 2014-2018 Medium Term Plan. This will require an injection of resources across the board that cannot be based on the
14
aforementioned strategy and on the generation of miscellaneous income, which has been declining andcannot be recovered due to changes in the countries’ fiscal and financial policies.
However, the Miscellaneous Income fund can be strengthened with special contributions from the countries, which would help complement the quota budget. It is important to emphasize that IICA’s technical cooperation and institutional operations require financial guarantees to ensure organizational stability, maintain its operational strategy and the robust quality and continuity of the projects implemented at the national, regional or hemispheric level. They must also be results-oriented and must continue to generate greater value and positive returns on the investments of its Member States.
Budget cut
For the Regular Fund, the scenario of zero growth in the quotas would represent a reduction of more than 13% in real terms, the impact of which would be reflected, among other aspects, in the following:
A reduction in IICA’s activities and contributions to Member States and an incalculable loss of work carried out by the Institute and its longstanding technical investments, which would have a substantial impact on results in the member countries.
Loss of the competitive advantage of mobilizing experts, throughout the hemisphere and consequently, a reduction in the intellectual support provided to technical cooperation projects.
Loss of flexibility in the organization to respond to the needs of Member States, with the consequent negative impacts on different areas of the agricultural sector.
Further adjustments to operating and personnel costs would not be viable, and would jeopardize the institutional capacity for response. A reduction of 8 International Personnel positions, 9 Local Professional Personnel and 10 general services positions is estimated.
Systematically operate under pressure due to the measures to reallocate expenditure and reduce personnel, affecting organizational climate, making it increasingly difficult to cover rising personnel costs, the revaluation of local currencies and price increases in services, equipment, furniture, vehicles, consultants, travel, insurance, etc.
Some of the actions and results that would be affected by a reduction in the institutional budget are:
Fewer countries and public and private agents would benefit from the development of agribusiness and associative capabilities among small and medium-scale producers. Comprehensive actions would be limited in at least three countries, affecting support to four or five agricultural chains. There would be a 20% to 30% reduction in the number of beneficiaries of capacity-building and consensus-building processes for stakeholders and in projects designed to improve the competitiveness, inclusion, equity and sustainability of those chains in LAC.
IICA’s role as an Observer Member of the Committee on Sanitary and Phytosanitary Measures (2002) and the Agriculture Committee (2010), would be compromised, along with its capacity to support countries in monitoring and fulfilment of their commitments before the WTO and related international regulations, as well as other trade integration mechanisms.
The scope and quality of information and knowledge management networks and services in the countries would be reduced (example: Infoagro/Infotec with 22,000 users).
Cuts would jeopardize the progress achieved until now in nine countries which are implementing processes resulting in: a) public policies and institutional frameworks for the inclusive and equitable development of agriculture and rural areas and the energizing of local economies, b) empowerment of local social stakeholders to ensure social and economic inclusion, and c) capacity-building, public goods and knowledge management to promote public policies, institutional actions and processes of inclusion with equity; and the incorporation of excluded populations e.g. Afrodescendant and indigenous communities, women and rural youth, etc., in all the topics mentioned.
Institutional support to the countries would be affected in their efforts to strengthen their capabilities and institutional frameworks to promote the integrated management of water resources and soil and climatically sustainable agricultural practices.
The Institute’s capacity to design and implement early warning systems for pests and diseases exacerbated by climate change and climate variability, such as coffee rust, would be reduced, together with efforts to promote good practices in the management of sanitary and phytosanitary risks in the member countries.
The application of PVS tools would be gradually reduced, at least in two countries per year. This would jeopardize the progress achieved so far and opportunities would be lost to identify strategic areas and topics in which countries need to strengthen their capacity. The impact would be greatest in the Andean and Southern regions. The affected countries would face constraints in their capacity to comply with international AHFS standards.
Other effects
The FonCT would cease to operate as seed capital to secure funds from international financial organizations; it would no longer serve as a mechanism to link the ministries of Agriculture, Environment and Health, on issues of climate change and agricultural health and food safety. The following are some of the specific impacts that would occur in the event of not implementing projects financed by this fund:
Farmers in at least six countries of the Central region would not implement good practices in the use of veterinary medications, reducing investment by private companies in the development of good practices in the use of these medicines.
Nearly 4,700 small-scale farmers in the Central region would not receive training to access markets or consolidate their position in markets, thereby affecting their income-generating prospects, which could create pressures to migrate to cities or to other countries.
Limited opportunities for approximately 90 producers in the Central and Andean regions for improving the management of their water resources, the quality of their products and increasing their incomes.
No training for nearly 130 extension workers from public institutions in the Southern and Andean regions, who would provide technical assistance in managing business-trade processes in family agriculture, which would affect around 1,000 producers.
The countries of the Southern region and Bolivia would not have access to methodologies and tools to promote good practices in fruit-vegetable production, which would affect their agricultural exports and increase the health risks from consumption of unsafe fruits.
Around 80 trainers and nearly 240 young people from at least eight regions in four countries would not receive training in social management and organization, entrepreneurship and networking. This could mean a possible increase in migration from the countryside to the city and the loss of factors of production through lack of youth training schemes.
A new budget for a new MTP
he proposed 2016-2017 Program Budget is primarily designed to be implemented in close coordination with the strategic management model and thematic orientation, with flexibility in the implementation of the 2014-2018 Medium Term Plan.
Similarly, it will responsibly address the financial constraints, the permanent increase in personnel and operating costs, and the gradual loss of competitiveness in labor markets, ensuring IICA’s operational viability for the coming years.
In the context of a strengthened Regular Fund budget, this proposal will effectively address the technical cooperation priorities established in the Medium Term Plan, based on criteria such as quality, effectiveness, rationality, equity, transparency and accountability, as part of a policy of continuous improvement and delivery of results to benefit the Member States.
16
V.
LIST OF TABLES ATTACHED
Table No. 1 Quota scale of the Member States, Contributions of Over-Quotas and
Miscellaneous income 2016-2017 (USD)
Table No. 2 Evolution of the Regular Fund in Nominal Values. 1994-2015 and 2016-2017 (in
thousands of USD)
Table No. 3 Allocation of the Regular Fund by Chapter 2016 – 2017 (USD)
Table No. 4 Personnel Positions Financed with Resources from the Regular Fund. Program Budgets 1992 to 2016-2017
Table No. 1 2015 2015 IICA OEA1 TOTAL QUOTAS ASSESSED QUOTA OVER -
QUOTA TOTAL QUOTAS
ASSESSED QUOTA OVER- QUOTA TOTAL QUOTAS
USD USD3 USD3 USD3 USD3 USD3 USD3 US$ % US$ %
Antigua and Barbuda 6.100 0,022 0,022 6.700 0 6.700 0,022 6.700 0 6.700 600 9,8% 0 0,0%
Argentina 883.300 2,400 2,400 729.700 220.900 950.600 2,400 729.700 220.900 950.600 67.300 7,6% 0 0,0% Bahamas 17.100 0,049 0,049 14.900 0 14.900 0,049 14.900 0 14.900 -2.200 -12,9% 0 0,0% Barbados 12.400 0,034 0,034 10.300 0 10.300 0,034 10.300 0 10.300 -2.100 -16,9% 0 0,0% Belize 6.100 0,022 0,022 6.700 0 6.700 0,022 6.700 0 6.700 600 9,8% 0 0,0% Bolivia 13.500 0,056 0,056 17.000 0 17.000 0,056 17.000 0 17.000 3.500 25,9% 0 0,0% Brazil 2.734.600 12,427 12,427 3.778.200 0 3.778.200 12,427 3.778.200 0 3.778.200 1.043.600 38,2% 0 0,0% Canada 3.293.300 10,583 10,583 3.217.600 0 3.217.600 10,583 3.217.600 0 3.217.600 -75.700 -2,3% 0 0,0% Chile 327.100 1,347 1,347 409.500 0 409.500 1,347 409.500 0 409.500 82.400 25,2% 0 0,0% Colombia 288.600 1,311 1,311 398.600 0 398.600 1,311 398.600 0 398.600 110.000 38,1% 0 0,0% Costa Rica 60.800 0,230 0,230 69.900 0 69.900 0,230 69.900 0 69.900 9.100 15,0% 0 0,0% Dominica 6.100 0,022 0,022 6.700 0 6.700 0,022 6.700 0 6.700 600 9,8% 0 0,0% Dominican Republic 70.700 0,317 0,317 96.400 0 96.400 0,317 96.400 0 96.400 25.700 36,4% 0 0,0% Ecuador 71.000 0,322 0,322 97.900 0 97.900 0,322 97.900 0 97.900 26.900 37,9% 0 0,0% El Salvador 34.400 0,086 0,086 26.100 3.000 29.100 0,086 26.100 3.000 29.100 -5.300 -15,4% 0 0,0% Grenada 6.100 0,022 0,022 6.700 0 6.700 0,022 6.700 0 6.700 600 9,8% 0 0,0% Guatemala 51.400 0,145 0,145 44.100 5.200 49.300 0,145 44.100 5.200 49.300 -2.100 -4,1% 0 0,0% Guyana 6.700 0,022 0,022 6.700 600 7.300 0,022 6.700 600 7.300 600 9,0% 0 0,0% Haiti 9.400 0,026 0,026 7.900 0 7.900 0,026 7.900 0 7.900 -1.500 -16,0% 0 0,0% Honduras 14.000 0,042 0,042 12.800 0 12.800 0,042 12.800 0 12.800 -1.200 -8,6% 0 0,0% Jamaica 25.600 0,070 0,070 21.300 0 21.300 0,070 21.300 0 21.300 -4.300 -16,8% 0 0,0% Mexico 2.495.300 6,788 6,788 2.063.800 217.300 2.281.100 6,788 2.063.800 217.300 2.281.100 -214.200 -8,6% 0 0,0% Nicaragua 9.400 0,026 0,026 7.900 0 7.900 0,026 7.900 0 7.900 -1.500 -16,0% 0 0,0% Panama 47.600 0,176 0,176 53.500 4.100 57.600 0,176 53.500 4.100 57.600 10.000 21,0% 0 0,0% Paraguay 28.100 0,075 0,075 22.800 2.500 25.300 0,075 22.800 2.500 25.300 -2.800 -10,0% 0 0,0% Peru 189.300 0,860 0,860 261.500 0 261.500 0,860 261.500 0 261.500 72.200 38,1% 0 0,0%
Saint Kitts and Nevis 6.100 0,022 0,022 6.700 0 6.700 0,022 6.700 0 6.700 600 9,8% 0 0,0%
Saint Lucia 6.100 0,022 0,022 6.700 0 6.700 0,022 6.700 0 6.700 600 9,8% 0 0,0%
Saint Vincent and the Grenadines 6.100 0,022 0,022 6.700 0 6.700 0,022 6.700 0 6.700 600 9,8% 0 0,0%
Suriname 9.400 0,026 0,026 7.900 0 7.900 0,026 7.900 0 7.900 -1.500 -16,0% 0 0,0%
Trinidad and Tobago 49.500 0,135 0,135 41.000 0 41.000 0,135 41.000 0 41.000 -8.500 -17,2% 0 0,0%
United States of America 16.359.400 59,470 59,470 18.080.900 0 18.080.900 59,470 18.080.900 0 18.080.900 1.721.500 10,5% 0 0,0%
Uruguay 64.100 0,247 0,247 75.100 5.200 80.300 0,247 75.100 5.200 80.300 16.200 25,3% 0 0,0% Venezuela 601.300 2,144 2,144 651.900 0 651.900 2,144 651.900 0 651.900 50.600 8,4% 0 0,0% SUB TOTAL 27.810.000 99,568 99,568 30.272.100 458.800 30.730.900 99,568 30.272.100 458.800 30.730.900 2.920.900 10,5% 0 0,0% Cuba 158.200 0,431 0,431 131.000 0 131.000 0,431 131.000 0 131.000 -27.200 -17,2% 0 0,0% TOTAL QUOTAS 27.968.200 99,999 99,999 30.403.100 458.800 30.861.900 99,999 30.403.100 458.800 30.861.900 2.893.700 10,3% 0 0,0% MISCELLANEOUS INCOME 2 6.100.000 4.300.000 4.300.000 -1.800.000 -29,5% 0 0,0%
TOTAL REGULAR FUND4
33.910.000 35.030.900 35.030.900 1.120.900 3,3% 0 0,0%
2016-2017 Programa Budget 10.5% INCREASE IN QUOTAS FOR THE BIENNIUM, NEW OAS SCALE, SAME AMOUNT OF OVER-QUOTAS, AND DECREASE IN MISCELLANEOUS INCOME DUE TO DEPLETION OF
MISCELLANEOUS INCOME FUND
Note: The Kingdom of Spain contributes and annual quota of USD 60,000 as an Associate State, as per an agreement reached in the First Plenary Session of the Eleventh Regular Meeting of the Inter-American Board of Agriculture, held on November 26, 2001, in Bávaro, Dominican Republic.
2016 IICA
2017
IICA VARIATIONS
Quota Scales of the Member States, Contributions of Over-quotas, and Miscellaneous Income for 2016-2017 (USD)
MEMBER STATES
1994 26.707,5 2.297,3 29.004,8 1995 27.508,7 2.127,5 29.636,2 1996 27.508,7 2.527,2 30.035,9 1997 27.508,7 3.258,1 30.766,8 1998 27.508,7 2.491,3 30.000,0 1999 27.508,7 2.491,3 30.000,0 2000 27.508,7 2.491,3 30.000,0 2001 27.508,7 2.491,3 30.000,0 2002 27.508,7 2.491,3 30.000,0 2003 27.167,6 2.832,4 30.000,0 2004 27.167,6 2.832,4 30.000,0 2005 27.167,6 2.832,4 30.000,0 2006 27.167,6 2.832,4 30.000,0 2007 27.167,6 2.832,4 30.000,0 2008 27.227,8 4.100,0 31.327,8 2009 27.227,8 4.100,0 31.327,8 2010 27.298,2 6.100,0 33.398,2 2011 27.298,2 6.100,0 33.398,2 2012 27.689,6 6.100,0 33.789,6 2013 27.810,0 6.100,0 33.910,0 2014 27.810,0 6.100,0 33.910,0 2015 27.810,0 6.100,0 33.910,0 2016 30.730,9 4.300,0 35.030,9 2017 30.730,9 4.300,0 35.030,9
Note: The Cuban quota was excluded from the quota resources as of 2003.
Table No. 2
2016 - 2017
Program Budget
PERIOD QUOTAS MISCELLANEOUS REGULAR FUND
Evolution of the Regular Fund in Nominal Values
1994 to 2017 (USD x 000)
Table No. 3
USD USD
CHAPTER I: Direct Technical Cooperation Services 27.595.548 4.005.688 31.601.236 90,2% 27.590.853 4.070.709 31.661.562 90,4%
CHAPTER II: Management Costs 1.728.507 11.800 1.740.307 5,0% 1.767.181 11.800 1.778.981 5,1%
CHAPTER III: General Cost and Provisions 1.270.000 20.000 1.290.000 3,7% 1.270.000 20.000 1.290.000 3,7%
CHAPTER IV: Renewal of Infrastructure and Equipment 136.845 262.512 399.357 1,1% 102.866 197.491 300.357 0,9%
30.730.900 4.300.000 35.030.900 100,0% 30.730.900 4.300.000 35.030.900 100,0%
(USD)
CHAPTER
2016 2017
QUOTAS MISC. REGULAR FUND
% QUOTAS %
CHAPTER IV: RENEWAL OF INFRASTRUCTURE AND EQUIPMENT
The budget items included in this Chapter are the conservation and maintenance of IICA-owned buildings and properties, and the renewal of vehicles, equipment, and software licenses, both at Headquarters and in the 34 Offices in the Member States.
2016 - 2017
Allocation of the Regular Fund by Chapter - 2015, 2016 and 2017
TOTAL
Notes:
Program Budget
MISC. REGULAR FUND
The Institute’s budget is divided into four Chapters:
CHAPTER I: DIRECT TECHNICAL COOPERATION SERVICES
This chapter includes the costs of the Institute’s technical cooperation actions at the national, multinational, regional, and hemispheric levels required to achieve the objectives established in the Medium-term Plan. It includes IICA’s contribution to the Tropical Agriculture Research and Higher Education Center (CATIE) and the Caribbean Agricultural Research and Development Institute (CARDI), and the financing of the flagship projects, rapid response actions, and initiatives of the Competitive Fund for Technical Cooperation, the Offices in the Member States, and the Technical Support Units.
CHAPTER II: MANAGEMENT COSTS
Management Costs include the resources of the units responsible for managing the Institute and providing support services. Those units, which are located at Headquarters, are the Office of the Director General, Deputy Director General and the Secretariat of Corporate Services.
CHAPTER III: GENERAL COSTS AND PROVISIONS
General costs and provisions are general commitments not directly related to the preceding chapters, or to a specific unit. They include funding for the governing bodies; institutional insurance; contribution to the administration of the OAS Administrative Tribunal and the OAS Retirement and Pension Fund; External Audit; pensions of former Directors General; and the Emergency Assistance Fund for Institute Personnel.
Table No. 4
1992 to 2017 Program Budgets
YEAR IPP LPP GSP TOTAL
1992 134 82 346 562 1993 134 79 344 557 1994 132 80 349 561 1995 132 81 312 525 1996 121 87 289 497 1997 117 95 285 497 1998 110 98 249 457 1999 103 101 247 451 2000 99 97 251 447 2001 99 97 251 447 2002 96 101 238 435 2003 93 120 221 434 2004 94 126 230 450 2005 94 126 230 450 2006 94 131 237 462 2007 94 131 227 452 2008 94 135 227 456 2009 94 135 227 456 2010 95 152 213 460 2011 93 157 213 463 2012 88 151 208 447 2013 88 151 208 447 2014 82 151 194 427 2015 79 149 201 429 2016 79 150 198 427 2017 79 150 198 427
IPP: International Professional Personnel LPP: Local Professional Personnel GSP: General Services Personnel
2016 - 2017
Personnel Positions Financed with the Regular Fund
Note: Does not include positions financed with external resources and INR resources
VI.
ANNEXESAnnex I Agreements Signed by IICA in 2014
Annex II Institutional Net Rate (INR). Recovery of Proportional Indirect Costs (RePIC)
Annex III IICA Criteria and mechanisms for the approval of externally funded projects
ANNEX I
ANNEX 1
AGREEMENTS SIGNED BY IICA IN 2014
This Annex details the different types of agreements signed by the Institute in 2014 for the implementation of externally funded programs and
projects.
The information provided includes the duty station from which each agreement signed will be executed (IICA Office in a Member State or
Headquarters), the date on which each agreement was signed and the termination date, the title of the agreement, the IICA Flagship Project to
which it relates, the IICA Contribution that it will help to achieve, the total value of the agreement in USD throughout the life of the program or
project, the percentage of the Institutional Net Rate (INR) charged to cover indirect costs and the counterparts involved.
The following is a summary of the agreements by place of execution, showing the total amount involved and the average INR charged.
LOCATION TOTAL USD % INR
Costa Rica 2,170,194 8.0% Guatemala 1,103,317 9.7% Nicaragua 20,000 8.0% Panama 25,000 9.2% Barbados 22,067 8.7% Dominican Republic 585,178 8.0% Saint Vincent and the Grenadines 91,840 8.1% Saint Lucia 284,173 5.5% Ecuador 810,868 8.6% Peru 160,854 10.6% Venezuela 580,324 8.0% Argentina 11,101,830 6.3% Brazil 22,486,218 5.1% Chile 17,086 8.6% Paraguay 86,555 8.1% Uruguay 394,515 7.9% Canada 14,408 10.0% Mexico 88,265,851 8.0% Headquarters 1,605,681 10.5% TOTAL 129,825,959 7.37
SUMMARY OF AGREEMENTSN SIGNED IN 2014 BY LOCATION1
1/ Does not include quotas to ICOA or Operating Agreement with CIAT in Colombia".