LETTERS
Strain accommodation by slow slip and dyking in a
youthful continental rift, East Africa
Eric Calais
1, Nicolas d’Oreye
2, Julie Albaric
3, Anne Deschamps
4, Damien Delvaux
5, Jacques De´verche`re
3,
Cynthia Ebinger
6, Richard W. Ferdinand
7, Franc¸ois Kervyn
5, Athanas S. Macheyeki
8,9, Anneleen Oyen
2,10,
Julie Perrot
3, Elifuraha Saria
11, Benoıˆt Smets
5, D. Sarah Stamps
1& Christelle Wauthier
5,12Continental rifts begin and develop through repeated episodes of faulting and magmatism, but strain partitioning between faulting and magmatism during discrete rifting episodes remains poorly documented. In highly evolved rifts, tensile stresses from far-field plate motions accumulate over decades before being released during relatively short time intervals by faulting and magmatic intrusions1–3. These rifting crises are rarely observed in thick
litho-sphere during the initial stages of rifting. Here we show that most of the strain during the July–August 2007 seismic crisis in the weakly extended Natron rift, Tanzania, was released aseismically. Deformation was achieved by slow slip on a normal fault that pro-moted subsequent dyke intrusion by stress unclamping. This event provides compelling evidence for strain accommodation by magma intrusion, in addition to slip along normal faults, during the initial stages of continental rifting and before significant crustal thinning. In July–August 2007, a seismo-magmatic crisis in the Natron basin (Fig. 1) was accompanied by the first dyking event ever captured geodetically in a continental rift4
. The ,5-Myr-old Natron basin lies near the southern termination of the eastern branch of the East African Rift, the divergent boundary between the Somalian and Nubian plates. Alkaline and basaltic volcanism was coeval with initial surface faulting5, yet strain accommodation by magma intrusion is
virtually unconstrained. With current far-field extension rates on the order of 3 to 4 mm yr21(ref. 6), the eastern rift has experienced only a few kilometres of crustal thinning7, whereas lithospheric thickness is
,90 km relative to .125-km-thick lithosphere outside the rift8,9. The
Natron crisis therefore provides a rare opportunity to quantify how faulting and magma intrusion contribute to strain accommodation within a youthful continental rift.
The Natron seismo-magmatic crisis began on 12 July 2007 with two earthquakes of respective body-wave magnitudes Mb5 4.4 and
Mb5 4.5 recorded at the southern end of Lake Natron (Fig. 1).
Subsequent seismic activity included an Mb5 5.3 event and an
Mb5 4.6 event and culminated on 17 July with a shallow (4.7-km
depth) event with moment magnitude Mw5 5.9. Seismic activity
continued in July (32 Mb. 3.8 events) and August (21 Mb. 3.9
events) and then decayed rapidly in September (four Mb. 4.2 events).
Owing to the fortuitous deployment of a temporary broadband seis-mic network just to the south of the Natron basin, we were able to locate the 17 July earthquake and 607 events for the interval 12–31 July located ,5–10 km south of the Gelai shield volcano (Fig. 1). Seismicity started on 12 July below the southern toe of Gelai at depths between 4 and 12 km, and then migrated up to 10 km to the northeast
1Purdue University, Department of Earth and Atmospheric Sciences, West Lafayette, Indiana 47906, USA.2National Museum of Natural History, Department of Geophysics/ Astrophysics, L-2160 Luxembourg.3Institut Universitaire Europe´en de la Mer, Universite´ de Bretagne Occidentale, Plouzane´ 29280, France.4Ge´osciences Azur, UNS/CNRS, Valbonne 06560, France.5Royal Museum for Central Africa, Tervuren 3080, Belgium.6University of Rochester, Department of Earth and Environmental Sciences, New York, New York 14627, USA.7University of Dar es Salaam, Department of Geology, PO Box 35091, Dar es Salaam, Tanzania.8Renard Centre of Marine Geology, Department of Geology and Soil Science, Universteit Gent, Gent 9000, Belgium.9Mineral Resources (Madini) Institute, PO Box 903, Dodoma, Tanzania.10Delft University of Technology, Delft 2600, The Netherlands. 11Ardhi University, Department of Geomatics, PO Box 35176, Dar es Salaam, Tanzania.12University of Lie`ge, Lie`ge 4000, Belgium.
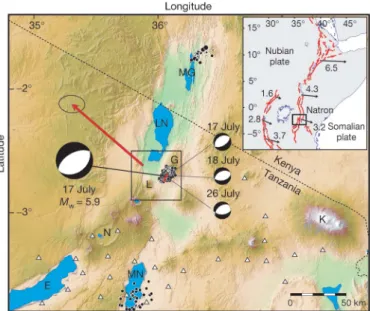
Figure 1|Regional setting. Black circles show epicentres of earthquakes with body-wave magnitudes Mb. 3.8 for the 16 July–21 August 2007
interval. Black and white circles indicate focal mechanisms for the largest magnitude events in that time interval. Black circles near lakes Magadi (MG) and Manyara (MN) show the 1998 and 1994–1995 seismic swarms17,19. The
short red line shows the location of the dyke intruded along the southern flank of Gelai volcano (G). White triangles show the seismic stations of the SEISMO-TANZ’07 temporary deployment. The background colour shows topography based on data from NASA’s Shuttle Radar Topography Mission. The red arrow indicates GPS displacement at a geodetic benchmark at the southern end of Lake Natron (LN), installed and observed for the first time in August 2006 and re-observed during 4–7 August 2007. Processing of the dual-frequency phase data shows a displacement of 5.6 6 0.9 cm vertically and 5.7 6 0.4 cm horizontally in the N49 W direction. Focal mechanisms for the 17 July event and earthquake locations are from this study (see Methods). Focal mechanisms for smaller magnitude events are from the Harvard Centroid-Moment Tensor catalogue. Black rectangle (in main panel) outlines the area of Fig. 3. E, Lake Eyasi; L, Ol Doinyo Lengai; K, Mount Kilimanjaro; N, Ngorongoro crater. The inset shows the study area (black rectangle) along the East African Rift. Arrows show predicted extension rates (in millimetres per year) and directions across the main rift structures6.
between 14 and 17 July. Hypocentres delineate a steep plane dipping to the northwest, and striking N33 E close to the geometry of the focal mechanism of the main event (Fig. 2). Following that event, seismicity remained stationary under the southern slope of Gelai, with a broader distribution of hypocentres at depths between 1 and 14 km, but still clustered in the N33 E direction.
Field observations in early August and October showed metres- to kilometres-long, newly formed en e´chelon tension fractures along the southern flank of Gelai, delineating two main north-northeast–south-southwest strands separated by 2–3 km. Vertical displacements are consistently east-down for the western strand and west-down for the eastern strand, resulting in a narrow central graben. Displace-ments are larger along the eastern strand in its middle segment, with an average of,12 cm of opening and ,35 cm of vertical offset. This strand also shows evidence for repeated activation in recent times. No eruption or venting was recorded at Gelai, but the crisis was accom-panied by renewed activity at the nearby Ol Doinyo Lengai carbona-titic volcano10(Fig. 1), with explosive eruptions bearing similarities to
the 1966 events11.
Surface deformation associated with the Natron crisis was also quantified using data from the Global Positioning System (GPS; Fig. 1) and radar interferometry (InSAR; Fig. 3). An interferogram spanning 3 April to 17 July shows that deformation started before the main Mw5 5.9 event, with ellipse-shaped fringes that coincide with
earthquake epicentres for that time interval (Fig. 3). Their pattern, as well as the distribution of earthquake hypocentres and the focal mechanism of the larger events, is consistent with slip on a buried, northwest-dipping normal fault. The 17 July–21 August interfero-gram (Fig. 3c) shows deformation-related fringes centred on the southern flank of Gelai in a pattern indicative of the subsidence of a fault-bounded central graben bounded on either side by areas of
uplift and horizontal displacement away from the graben. This is consistent with the deformation expected from a blade-shaped dyke with induced surface faulting at its upper tip3,12. At least four fringes
(,12 cm in range) are also visible on the eastern flank of Gelai, indicative of the subsidence possibly induced by magma chamber deflation.
We model surface deformation as the result of dislocations on faults13 and volume changes at point sources (so-called ‘Mogi
sources’14) buried in an elastic half-space (see Methods) to estimate
the amount of slip and opening on the faults involved and the volume changes due to the dyke intrusion and magma chamber deflation. We first model the 3 April–17 July interferogram, using a normal fault with strike and dip taken from the geometry of the plane derived from the 12–17 July hypocentres (Fig. 3b). The best-fit solution shows up to 0.5 m of normal slip concentrated at a depth of between 5 and 10 km, with a distribution that matches earthquake hypocen-tres, and a total moment release of 2.7 3 1018N m. Because the cumulative seismic moment release for that time interval is 6.5 3 1016N m,,98% of the total moment must have been dissi-pated aseismically. Slip most likely occurred from 12 to 17 July, as seismicity was migrating from south to north along the fault (Fig. 2), in the first slow slip event recorded on a normal fault in a continental rift.
We then model the 17 July–21 August interferogram with a com-bination of fault slip and dyke opening. We use discontinuities in the interferograms and field observations to map the surface trace of the graben-bounding faults, where we allow slip down to depths of 2–4 km (from south to north, as the graben widens), and include the ‘pre-17 July’ normal fault defined above. We simulate the dyke as a vertical tensile dislocation with its surface projection following the centre of the axial graben and allow opening between the surface
35.9° 35.8° 36° 36.1° 36.2° L LN NGRS 5.9 cm 17 July Mw = 5.9 17 July Mw = 5.9 A Gelai A′ 0 5 10 15 20 25 Distance (km) Natron Dyke Shallow normal faults A A′ Pre-17 July normal fault Pre-17 July normal fault Dyke 35.9° 36° 36.1° 36.2° −2.9° −2.8° −2.7° −2.6° L LN A A′ Gelai Longitude Longitude Latitude 16 12 8 4 0 Depth (km) 0 5 10 15 20 25 Distance (km) Natron 12 13 14 15 16 17 35.8° A A′ July 12–17 2007 July 17–31 2007 0 0.2 0.4 Slip (m) 17–18 19–20 21–22 23–24 25–26 27–28 29–31 B B′
Figure 2|Earthquake locations from the local seismic network. Earthquakes are colour-coded as a function of date; the key shows the corresponding days of July 2007. Top panels: map view; bottom panels: cross-sectional view. The thin dashed lines at 14-km depth indicate a velocity increase from 5.9 to 6.5 km s21for seismic P waves in the crustal model used
for earthquake location (see Methods). The left-hand panels show the 12–17 July interval. Event depths increase from southeast to northwest and delineate a fault plane deepening to the northwest at 60u and striking N33 E
(from a least-squares fit through hypocentres). Epicentres (top) are superimposed on the surface projection of the slip distribution estimated on this fault, showing that they coincide with the area of maximum slip. The right-hand panels show the interval from 17 July (the time of the Mw5 5.9
event, marked as a white-circled black dot) to 31 July. Dashed lines between points A and A9 indicate the cross-sections used in the bottom panels. NGRS indicates the location of the Engaresero GPS site, where a horizontal displacement of 5.7 cm was measured in the direction indicated by the arrow.
LETTERS NATURE|Vol 456|11 December 2008
and a depth of 12 km. We include volume-change point sources below Gelai to simulate the local subsidence in Fig. 3c and below the Natron basin to explain the asymmetry of the fringe lobe north-west of the dyke.
The best-fit inversion (Figs 3d, 4) includes #2 m of dyke opening between depths of,2 and 6 km, centred below the southern half of the fault-bounded graben, and #0.6 m of slip on the shallow normal faults on either side of the dyke, consistent with field observations. We find a patch of shallow slip (4–5-km depth) on the pre-17 July fault, with a corresponding moment release of 8.5 3 1017N m, or Mw5 5.95, consistent with the 17 July earthquake. The computation
of stress changes caused by the pre-17 July slip acting on vertical faults trending N25 E shows that the area of largest estimated dyke opening coincides with the most negative change in normal stress (Fig. 3c). This suggests that dyke opening was triggered by static stress changes associated with pre-17 July slip (see, for example, ref. 15). We find a total volume of 0.09 km3 of magma intrusion in the dyke and a
negative volume change of 0.06 km3 at the Mogi point sources (0.01-km3deflation of a 3-km-deep point source below Gelai volcano and 0.05-km3deflation of a 10-km-deep point source west of Gelai). Some or all of the magma intrusion may therefore have its source in the magma chambers below and west of Gelai (see Methods).
The total moment released by fault slip and dyke opening esti-mated from geodetic data for the 17 July–21 August interval is 4.0 3 1018N m. Because cumulative seismic moment release for that interval is 1.4 3 1018N m, about 65% of the total moment must have been released by aseismic processes. Our inversion gives a moment of 2.6 3 1018N m for the (aseismic) dyke opening, or 65% of the total ‘geodetic’ moment release, consistent with the missing moment inferred from seismic processes alone. This moment release budget illustrates the importance of aseismic processes to the July 2007 Natron rifting events, a feature consistent with magma-assisted oceanic rifting episodes2,3. The 2007 Natron rifting episode,
there-fore, provides a snapshot of strain partitioning between faulting and
Figure 3|Interferograms and corresponding model results.Each fringe in the interferograms (that is, phase change in cycles, reckoned positive for increasing range) represents a ground displacement of 2.8 cm in the satellite–ground direction.a, 7 April–17 July interferogram (the 17 July image was made 7 h before the Mw5 5.9 earthquake) showing four elliptical
fringes indicating,12 cm of positive range change (ground moving away from the satellite) and one poorly defined negative range change fringe (to the east).b, Corresponding model.c, 17 July–21 August interferogram showing deformation-related fringes covering an area of about 50 3 70 km2 centred on the southern flank of Gelai. The two-lobe fringe pattern indicates up to 45 cm of negative range change (ground moving towards the satellite) in the eastern half of the scene and 17 cm of positive range change in the western half. Fringes in the lobes converge along a 15-km-long, 2–3-km-wide elongated area of positive range change (#55 cm in its southern part and
.45 cm in its northern part). Fringes in this central area are not contiguous with the side lobes, but have discontinuities matching the fractures mapped in the field.d, Corresponding model. Estimated slip on the pre-17 July normal fault, shown in Fig. 4d, is omitted here for sake of clarity. In the interferograms, black orthogonal arrows show the satellite displacement and look directions. In the models, red lines show the intersections of model faults and dyke with the surface; grey dots delineate observed fringes; dashed lines show model fringes; background colours show range change; the thin grid shows the surface projection of the fault model; and colours in the grid show the distribution of slip and opening estimated in the inversion. Black and red arrows show observed and predicted displacement, respectively, at GPS site Engaresero. Red circles show the location of the Mogi sources under Gelai and the Natron basin. See Supplementary Figure 1 for model residuals.
magma intrusion processes needed to link discrete rifting episodes with the time-averaged deformation.
The largely aseismic Natron rifting event would have remained undetected in the absence of local seismic networks, surface volcanic eruptions or geodetically measured surface deformation. Indirect evidence, however, indicates that this event is typical of the rifting process in the eastern rift system, and that magma intrusions fun-damentally modify the crust and upper-mantle structure during the initial stages of rifting. Magma intrusion is common in space and time, with volcanism preceding or concurrent with the onset of fault-ing in the eastern rift. In addition, although crustal thinnfault-ing is less than 10%, mantle xenoliths show that the cratonic mantle litho-sphere beneath the eastern rift has been metasomatized by magmatic fluids16. The earthquake sequence reported here bears similarities to
other earthquake swarms in the eastern rift that occurred before there was adequate geodetic coverage17–19. Narrow, high-velocity zones in
the upper crust are interpreted as cooled melt intrusion from earlier dyking events17.
Magma-assisted rifting models provide a unified framework for these observations. Owing to the positive buoyancy of melt, dyke intrusions may reduce the force required to cause extensional yield-ing of initially thick continental lithosphere by a factor of up to six20.
Dyke intrusions occur at lower tectonic stresses than faulting, pro-vided that magma pressure is high12. The density contrast caused by
the dyke intrusions, and the reduction in plate strength by magmatic heating over repeated rifting events, localizes strain to zones of
previous dyke intrusions20. The combination of a slow slip event,
an aseismic dyke intrusion and normal faulting in a young cratonic continental rift is direct evidence of the role of strain accommodation through magma intrusions during the initial stages of continental rifting.
METHODS SUMMARY
We used arrival times from a local seismic network to locate earthquakes in the Natron rift. Ground deformation was calculated using radar interferograms based on data from Envisat (an Earth-observation satellite of the European Space Agency (ESA)) and GPS measurements. Field geological mapping of the ground fracture system associated with the seismo-magmatic crisis complemen-ted these geophysical measurements. Observational constraints from fieldwork and seismology were used to design the model geometry. Fault slip and dyke opening were then calculated from a kinematic inversion of the ground deforma-tion data.
Full Methods and any associated references are available in the online version of the paper at www.nature.com/nature.
Received 22 July; accepted 25 September 2008.
1. Heki, K., Foulger, G., Julian, B. & Jahn, C. H. Plate dynamics near divergent boundaries: Geophysical implications of postrifting crustal deformation in NE Iceland. J. Geophys. Res. 98, 14279–14297 (1993).
2. Cattin, R. et al. Numerical modelling of Quaternary deformation and post-rifting displacement in the Asal–Ghoubbet rift (Djibouti, Africa). Earth Planet. Sci. Lett. 239, 352–367 (2005).
3. Wright, T. J. et al. Magma-maintained rift segmentation at continental rupture in the 2005 Afar dyking episode. Nature 442, 291–294 (2006).
0 0.4 0.8 1.2 1.6
Slip/opening (m)
−0.1 0 0.1
Normal stress change (MPa) 12 10 8 6 4 2 0 0 2 4 6 8 10 12
Distance along dyke (km)
B B′ Dyke 2 4 6 8 2 1 e k y d B B′ 2 0 4 6 8 Distance ( km) Distan ce ( km) 12 14 16 18 20 10 Dyking promoted Dyking inhibited 0 0.3 0.6 Slip (m) 2 0 4 6 8 Distan ce (km)1214 16 18 20 10 B B′ a b c d Depth (km) Depth (km) Depth (km) Depth (km) 0 3 6 9 12 15 0 3 6 9 12 15 0 4 8 12 0 1.6 1.20.8 0.4 Pre -17 July fault Dyke
Figure 4|Slip/opening model. a, Estimated slip distribution for the 12–17 July slow slip event on the northwest-dipping normal fault. The locations of B and B9 are shown in Fig. 2.b, Estimated opening distribution along the dyke and slip distribution on the shallow normal faults bounding the central graben.c, Normal stress changes (background colours) caused by pre-17 July slip, resolved along the (future) dyke. Negative normal stress changes (red) promote dyke opening (indicated in metres by the contours; seeb). The black dashed line is the intersection of the pre-17 July normal fault with the
dyke.d, Estimated slip distribution on the pre-17 July normal fault for the 17 July–21 August interval. The colour scale for the slip distribution is the same as inb. The shallow slip patch probably corresponds to the 17 July Mw5 5.9
earthquake, whose hypocentre is marked by a black circle. We show the geometry of the dyke, for reference. The dashed black line shows the intersection of the dyke with the pre-17 July fault plane. Red lines show the intersection of the modelled fault and dyke planes with the surface, shown in map view in Fig. 2.
LETTERS NATURE|Vol 456|11 December 2008
4. Baer, G., Hamiel, Y., Shamir, G. & Nof, R. Evolution of a magma-driven earthquake swarm and triggering of the nearby Oldoinyo Lengai eruption, as resolved by InSAR, ground observations, and elastic modelling, East African Rift, 2007. Earth Planet. Sci. Lett. 272, doi:10.1016/j.epsl.2008.04.052 (2008).
5. Ebinger, C. J., Poudjom Djomani, Y., Mbede, E., Foster, A. N. & Dawson, J. B. Rifting Archean lithosphere: Eyasi–Manyara–Natron rifts, East Africa. J. Geol. Soc. Lond. 154, 947–960 (1997).
6. Stamps, D. S. et al. A kinematic model for the East African Rift. Geophys. Res. Letters 35, doi:10.1029/ 2007GL032781 (2008).
7. Birt, C. et al. The influence of pre-existing structures on the evolution of the southern Kenya rift valley – Evidence from seismic and gravity studies. Tectonophysics 278, 211–242 (1997).
8. Green, W. V., Achauer, U. & Meyer, R. P. A three-dimensional seismic image of the crust and upper mantle beneath the Kenya rift. Nature 354, 199–203 (1991).
9. Nyblade, A. A., Owens, T. J., Gurrola, H., Ritsema, J. & Langston, C. A. Seismic evidence for a deep upper mantle thermal anomaly beneath East Africa. Geology 7, 599–602 (2000).
10. Vaughan, R. G., Kervyn, M., Realmuto, V., Abrams, M. & Hook, S. J. Satellite measurements of recent volcanic activity at Oldoinyo Lengai, Tanzania. J. Volcanol. Geotherm. Res. 173, 196–206 (2008).
11. Dawson, J. B., Bowden, P. & Clark, G. C. Activity of the carbonatite volcano, Oldoinyo Lengai, 1966. Geol. Rundsch. 57, 865–879 (1968).
12. Rubin, A. Dike-induced faulting and graben subsidence in volcanic rift zones. J. Geophys. Res. 92, 1839–1858 (1992).
13. Okada, Y. Internal deformation due to shear and tensile faults in a half-space. Bull. Seismol. Soc. Am. 82, 1018–1040 (1992).
14. Mogi, K. Relations between the eruptions of various volcanoes and the deformations of the ground surfaces around them. Bull. Earthq. Res. Inst. Tokyo 36, 99–134 (1958).
15. Amelung, F., Yun, S.-H., Walter, T. R., Segall, P. & Kim, S. W. Stress control of deep rift intrusion at Mauna Loa volcano, Hawaii. Science 316, 1026–1030 (2007). 16. Vauchez, A., Dineur, F. & Rudnick, R. Microstructure, texture and seismic
anisotropy of the lithospheric mantle above a mantle plume: Insights from the Labait volcano xenoliths (Tanzania). Earth Planet. Sci. Lett. 232, 295–314 (2005).
17. Ibs-von Seht, M., Blumenstein, S., Wagner, R., Hollnack, D. & Wohlenberg, J. Seismicity, seismotectonics and crustal structure of the southern Kenya Rift - new data from the Lake Magadi area. Geophys. J. Int. 146, 439–453 (2001). 18. Tongue, J., Maguire, P. K. H. & Burton, P. An earthquake study in the Lake Baringo
basin of the central Kenya Rift. Tectonophysics 236, 151–164 (1994). 19. Nyblade, A. A., Birt, C., Langston, C. A., Owens, T. J. & Last, R. J. Seismic
experiment reveals rifting of craton in Tanzania. Eos 77, 517–521 (1996). 20. Buck, W. R. in Rheology and Deformation of the Lithosphere at Continental Margins
(eds Karner, G. D., Taylor, B., Driscoll, N. & Kohlstedt, D.) 1–30 (Columbia Univ. Press, 2004).
Supplementary Information is linked to the online version of the paper at www.nature.com/nature.
Acknowledgements Envisat/ASAR data were systematically programmed and acquired through the ESA Cat-1 project no. C1P.3224. Interferograms were computed using DORIS software (Delft University of Technology). Precise orbits were provided by the Delft Institute of Earth Observation and Space Systems and ESA. We thank the Tanzania Survey and Mapping Department for their support of the October field expedition and the Tanzania Commission for Science and Technology. We thank V. Cayol and Y. Fukushima for their contribution in analysing the ground deformations, F. Paganelli, J. Biggs and J. Keller for discussions and K. Feigl and F. Sigmundsson for their comments. We acknowledge support from the US National Science Foundation under grants EAR-0801801 and EAR-0538119, from the French INSU-CNRS DyETI programme and from the Belgian Science Policy under projects SAMAAV and Rukwa.
Author Contributions N.d’O., A.O. and F.K. planned the radar data acquisition and computed the interferograms; J.A., A.D., J.D., R.W.F. and J.P. designed the seismic experiment and collected and analysed the resulting data; D.D., A.S.M., B.S. and C.W. performed the field observations; E.S. and D.S.S. deployed the GPS equipment and processed the resulting data; C.E. provided tectonic context; E.C. performed the model calculations; E.C. and N.d’O. wrote the paper. All authors discussed the results and commented on the manuscript.
Author Information Reprints and permissions information is available at www.nature.com/reprints. Correspondence and requests for materials should be addressed to E.C. (ecalais@purdue.edu).
METHODS
Seismology. We determined the source mechanism of the 17 July Mw5 5.9 event
using teleseismic body waves from 24 stations assuming mean crustal P- and S-wave velocities of 6.0 and 3.46 km s21, respectively, and find a source of 3-s duration with a simple pulse, a seismic moment of 1.1 3 1018N m and a purely normal faulting source mechanism with a strike of 241u, a dip of 55u and a rake of 285u. Earthquake locations were computed using the HYPOCENTER program21
with a crustal velocity model derived from the 1991 seismic refraction experi-ment22of the Kenya Rift International Seismic Project, with P-wave velocities as
given in Supplementary Table 1. Statistical uncertainties in hypocentre location are of 3–6 km in depth and north–south position and ,3 km in east–west position. Radar interferometry. We used radar data acquired by the ESA Envisat sat-ellite23. Only images acquired on descending orbits are available for the area and
time interval of interest, because of a failure in the Artemis satellite (ESA) relay-ing Envisat data to the ground. The main parameters from the two interfero-grams used here are given in Supplementary Table 2. Additional radar data from ALOS (a satellite of the Japanese Aerospace Exploration Agency) and Envisat are available; a complete catalogue can be found in ref. 4. Phase unwrapping was performed using the SNAPHU algorithm24. Satellite orbital parameters were
fixed to the values provided by Delft University of Technology and ESA. We account for possible orbital biases in the slip inversion (see Methods) by solving for phase gradients in the north–south and east–west directions and a line-of-sight offset accounting for the unknown zero-phase level.
Modelling. We discretize the dyke and faults with rectangular patches of dimen-sion,1 km 3 1 km and compute the impulse functions that relate slip on each patch13and volume change at each point source14to surface displacement at the
observation points, while assuming a Poisson ratio of 0.25 and a shear modulus of 33 GPa. We use least squares to invert the model and estimate dyke-normal opening on the dyke patches, normal dip-slip displacement on the fault patches, and volume changes at the Mogi sources from InSAR line-of-sight range change and three-dimensional GPS displacement at site Engaresero.
We subsampled the interferograms to 302 data points for the interval between 3 April 2007 and 17 July 2007 and 1,254 data points for the interval between 17 July 2007 and 21 August 2007. The data were weighted by the inverse of their (diagonal) covariance matrix formed using a single-pixel standard deviation of 5.6 mm (20% of the half radar wavelength for Envisat), which was derived from the phase variations calculated from 20 interferograms spanning January 2006 to 2008 along two profiles, one across the southern flank of Gelai and the other in
the Natron basin to the west of Gelai. To avoid implausible and overly rough slip/ opening distributions, we applied smoothing by means of a finite-difference approximation of the Laplacian operator and applied positivity constraints.
Chi-squared statistics for the best-fit models are 98,832 and 148,455 and average residuals are 2.8 cm and 5.4 cm for the 3 April 2007–17 July 2007 and 17 July 2007–21 August 2007 intervals, respectively. We have verified that the simple elastic models used here provide results similar to forward models based on a three-dimensional mixed-boundary-element method that takes into account realistic topography and gravitational stresses25. Supplementary Fig. 1
compares, side-by-side, the observed unwrapped interferogram (left panel) with the simulated unwrapped interferogram derived from the estimated slip/open-ing model parameters (middle panel), and shows the residual signal (observed minus model).
Volume-change calculations depend strongly on Poisson’s ratio (a constant value of 0.25 is used here), the shape of the magma chamber (here a point source) and magma degassing and expansion as pressure drops (not accounted for here)26,27. This later process may result in a volume increase by a factor of up
to five28.
21. Lienert, B. R. E. & Havskov, J. A computer program for locating earthquakes both locally and globally. Seismol. Res. Lett. 66, 26–36 (1995).
22. KRISP Working Party. Large-scale variation in lithospheric structure along and across the Kenya rift. Nature 354, 223–227 (1991).
23. Massonnet, D. & Feigl, K. L. Radar interferometry and its application to changes in the Earth’s surface. Rev. Geophys. 36, 441–500 (1998).
24. Chen, C. W. & Zebker, H. A. Two-dimensional phase unwrapping with use of statistical models for cost functions in nonlinear optimization. J. Opt. Soc. Am. A 18, 338–351 (2001).
25. Cayol, V. & Cornet, F. H. Three-dimensional modeling of the 1983-1984 eruption at Piton de la Fournaise volcano, Re´union Island. J. Geophys. Res. 103, 18025–18037 (1998).
26. Delaney, P. T. & McTigue, D. F. Volume of magma accumulation or withdrawal estimated from surface uplift or subsidence, with application to the 1960 collapse of Kilauea volcano. Bull. Volcanol. 56, 417–424 (1994).
27. Johnson, D. J., Sigmundsson, F. & Delaney, P. T. Comment on ‘‘Volume of magma accumulation or withdrawal estimated from surface uplift or subsidence, with application to the 1960 collapse of Kilauea volcano’’ by P. T. Delaney and D. F. McTigue. Bull. Volcanol. 61, 491–493 (2000).
28. Nishimura, T. Pressure recovery in magma due to bubble growth. Geophys. Res. Lett. 31, doi:10.1029/2004GL019810 (2004).