Simulation of a cold climate heat pump furnished
with a scroll compressor with multiple vapor
injection lines
I H BellUniversity of Liège, Belgium E A Groll, J E Braun, W T Horton Purdue University, USA
ABSTRACT
A detailed open-source scroll compressor simulation has been developed as described in a companion paper. In this work, the compressor simulation code is used to investigate refrigerant vapor injection in scroll compressors for cold climate heat pumps. The required analysis is developed for vapor injection in scroll compressors with one or two injection lines. The improvement in heating-mode efficiency at a -20◦C evaporation temperature with one injection line is as much as 10 % while with two injection lines the increase in efficiency can be as much as 16 %.
NOMENCLATURE
COPh Coefficient of Performance
(-)
hs Scroll wrap height (m) h1,h2, .. Enthalpy at state (kJ kg−1) h′f,1 Sat. liq. enth. flash #1 (kJ
kg−1)
h′f,2 Sat. liq. enth. flash #2 (kJ kg−1)
h′′f,1 Sat. vap. enth. flash #1 (kJ kg−1)
h′′f,2 Sat. vap. enth. flash #2 (kJ kg−1)
˙
mcond Condenser mass flow (kg
s−1) ˙
mevap Evaporator mass flow (kg
s−1) ˙
mf,1 Vap. gen. flash #1 (kg s−1)
˙
mf,2 Vap. gen. flash #2 (kg s−1)
˙
minj,1 Mass flow inj. #1 (kg s−1)
˙
minj,2 Mass flow inj. #2 (kg s−1)
˙
pf,1 Press. flash #1 (kg s−1)
˙
pf,2 Press. flash #2 (kg s−1)
˙
pinj,1 Press. inj. line #1 (kg s−1)
˙
pinj,2 Press. inj. line #2 (kg s−1)
˙
Qcond Condenser output (kW)
˙
Qevap Evaporator input (kW)
˙
Wcomp Compressor power (kW) ra Radius of discharge arc (m) rb Base circle radius (m) ro Orbiting radius (m) ts Scroll wrap thickness (m) x Cartesian coordinate (m) X1 Injection ratio flash #1 (-) X2 Injection ratio flash #2 (-) y Cartesian coordinate (m) θ Crank angle (rad) φ Involute angle (rad) φ0 Initial involute angle (rad) φi0 Inner wrap initial angle
(rad)
φis Inner wrap starting angle
(rad)
φie Inner wrap ending angle (rad)
φo0 Outer wrap initial angle
(rad)
φos Outer wrap starting angle
(rad)
φoe Outer wrap ending angle (rad)
1 INTRODUCTION
With the continuing emphasis on efficiency of heating and cooling systems, new technologies must be investigated to further improve system efficiency. For heat pump systems operating over large temperature lifts, refrigerant vapor injection is one technology that has been used in the past as a means of improving cycle effi-ciency.
Systems with refrigerant vapor injection exhibit similar behavior to systems with two-stage compression and economization. The limiting case of refrigerant vapor injection is that the injection occurs instantaneously at the injection pressure. This is equivalent to the compression of the suction gas to an intermediate pressure, instantaneous mixing at constant pressure, and finally the compression of the mixture of the two streams to the discharge pressure.
The advantage of refrigerant vapor injection over conventional two-stage compres-sion is that only one compressor is required, saving capital cost. In order to save manufacturing costs it is also possible to carry out two-stages of compression within one machine (1). In either case, the costs for the two-stage system are greater than that for the conventional heat pump cycle.
Other options are available within one compressor to achieve economizing, like parallel compression economization (2) with a reciprocating compressor.
While two-stage compression and refrigerant vapor injection share many similar fea-tures from a cycle perspective, the analysis of vapor injection is significantly more complex as in a real system the injection process is tightly coupled with the cycle behavior. For instance, the amount of vapor generated at the intermediate pressure must be balanced by the amount of vapor that the compressor will accept at a given injection pressure. The further development of this theme is presented below. There are a number of different types of compressors that are well-suited to refrig-erant vapor injection. In particular, the compressor geometry must be amenable to the addition of injection ports which take a finite space and must be open to the refrigerant stream for a specified range of the crank angle. From these standpoints, rotary, spool, scroll and screw compressors are good candidates.
Refrigerant vapor injection in spool compressors with two injection ports has been previously investigated (3), for which the predicted increase in cooling mode COP for two ports is as much as 20%. Vapor injection in scroll compressors has also been studied, (4; 5; 6; 7; 8; 9), and the authors have found theoretical and experimental benefits from vapor injection with one set of injection ports. All the authors have found a significant benefit to cycle performance with refrigerant vapor injection, gen-erally the benefit to cooling-mode COP is greater than 10% at extreme operation conditions.
In addition, a number of authors (10; 11; 9; 12) have considered liquid-refrigerant injection into scroll compressors as a means of decreasing the discharge temperature of the compressor for large pressure ratio applications. The analysis developed in this paper is strictly limited to refrigerant vapor injection.
A detailed simulation code has been developed as described in a companion paper (13; 14). This simulation code can be used to analyze the steady-state performance of a wide range of volumetric machines, including compressors and expanders. The target application for cold-climate heat pumps are climate zones in which heat pumps do not currently find wide application and where less efficient systems are currently in use. For instance in the USA, as of 2009, 34% of the households use electric heat (15, Table 2.7). To achieve the same primary energy efficiency as natural gas condensing boilers, the seasonal COP of the heat pump must be greater than approximately 3.0.
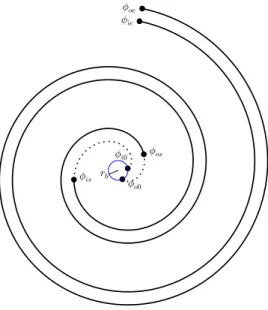
φi0 φis φie φo0 φos φoe rb
Figure 1: Involute angles for the fixed scroll wrap
This paper begins with a development of the requisite analysis for vapor injection in a scroll compressor. Then the cycle analysis is carried out, and finally, the compressor model and the cycle models are coupled together.
2 COMPRESSOR ANALYSIS AND SIMULATION 2.1 Scroll Compressor Geometry
The detailed analytical description of scroll compressor geometry, forces and other geometrically related terms is beyond the scope of this paper, but can be found in Bell (16). Nevertheless, the scroll compressor's geometry is fundamental to both an understanding of the scroll compressor's efficiency as well as the integration of vapor injection. An abbreviated description of the geometry is presented here, the reader is directed to Bell (16) for further information.
The most common configuration of a scroll compressor is composed of two scroll wraps, one of which is fixed, the other of which orbits. The orbiting motion of the motive scroll wrap traps crescent-shaped pockets of vapor which decrease in volume as they move towards the center of the compressor. The high-pressure vapor in the pockets is then discharged.
One wrap of the scroll compressor is formed of two involutes; an involute is formed by the unwrapping of a circle. Each involute is unwrapped from a base circle with radius rb, which yields the Cartesian coordinates of a point on the involute curve by
x = rb(cos φ + (φ− φ0)sin φ) y = rb(sin φ− (φ − φ0)cos φ)
(1) where φ takes on the values from φs to φe. The innermost portion of the involute
from φ0to φsis not considered as part of the involute, rather in this area, different curves are used to join the involute curves. Analytical solutions for the most common sets of these geometries are provided in Bell (16).
The inner and outer involutes of the scroll wrap have initial involute angles of φi0and φo0, respectively. This yields two involute curves with a constant distance between
them; these curves form the outer walls of the scroll wrap, as seen in Figure 1. The thickness of the scroll is given by
ts=rb(φi0− φo0) . (2)
0 π/2 π 3π/2 2π
Crank angleθ [radians] 0 10 20 30 40 50 60 V o lu m e o f ch a m b e r [c m 3]
2V
s1→
2V
c1,12V
c1,2V
dddθ
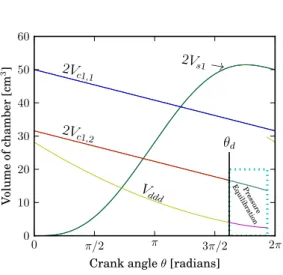
d P re ssu re Eq u ilibra tionFigure 2: Volumes of the compressor chambers for the compressor under study
Figure 2 presents the volumes of each of the chambers over the course of a rotation. The volumes of the suction pocket Vs1 initially increases during the suction process,
which draws vapor into the compressor. The suction pocket is sealed off after one rotation and becomes a compression chamber Vc1,1. This compression chamber
decreases in volume over the course of a few rotations (during which part of the time it is defined as Vc1,2) until the discharge angle is reached, at which point it
merges with the refrigerant vapor remaining in the discharge region. After pressure equilibrium, the refrigerant in the merged discharge chamber Vdddflows out into the
discharge line.
At the beginning of the rotation (θ = 0), the scroll wraps are in contact at the end of the scrolls. Over the course of one rotation (2π radians), all of the contact points move 2π radians towards the center of the compressor.
It should be mentioned here that this analysis is only valid for scroll compressors with constant wrap thickness and completely symmetric wraps. The analysis of variable wall thickness scroll wraps can be found in literature (17; 18)
2.2 Compressor Sizing
The pressure ratios for cold climate heat pump applications are quite large. For an adiabatic compression of propane from 244.5 kPa to 1476.7 kPa, with a compressor inlet superheat of 11.1 K, the ratio of outlet to inlet densities is equal to 5.52 which is equivalent to the ideal built-in volume ratio. Irreversibilities in the compression process will tend to decrease the outlet density due to the larger outlet temperature and yield a smaller required volume ratio. In addition, injection of refrigerant vapor will increase the pressure of the fluid in the working chambers, further decreasing the required volume ratio when vapor injection is applied. For these reasons, a built-in volume ratio of 3 was selected for this application. If the selected volume ratio is too large, there will be large over-compression losses in the compressor when operating at high evaporation pressures due to the mal-adjustment of the large volume ratio for the
Table 1: Parameters of the scroll compressor studied Geometric Parameters Volume ratio [-] 3.0 rb[mm] 2.228 ro[mm] 4.000 hs[mm] 52.346 t [mm] 3.000 φi0[rad] 0.000 φis[rad] 3.142 φie[rad] 21.096 φo0[rad] -1.346 φos[rad] 0.300 φoe[rad] 21.096 ra[mm] 6.426
Discharge port diameter [mm] 9.000 Symmetric Scrolls Yes
Flow Parameters
Leakage gap width [μm] 15 Flank gap width [μm] 15 Leakage flow model (19)
0 π/2 π 3π/2 2π
Crank angleθ [radians] 200 400 600 800 1000 1200 1400 1600 P re ss u re [k P a ]
p
s1p
c1,1p
c1,2p
ddd Discharge pressure P re ss u re E q u il ib ra ti o nFigure 3: Pressures in compressor evaporating at 244.5 kPa [-20◦C saturated] and condensing at 1476.7 kPa [43.3◦C saturated] small imposed pressure ratio. When working with vapor injected scroll compressors, it is generally better to err on the side of smaller volume ratios in order to avoid the potentially large overcompression effects at evaporation pressures above the design point.
The remaining scroll compressor geometric parameters were selected in order to yield an efficient and robust compressor; all the parameters needed to simulate the compressor are outlined in Table 1. Furthermore, additional parameters required to simulate the machine are provided in the simulation code1. A pressure versus
crank-angle plot is provided in Figure 3 which shows that the volume ratio is well-selected at the rating point as there are reasonable under-compression losses.
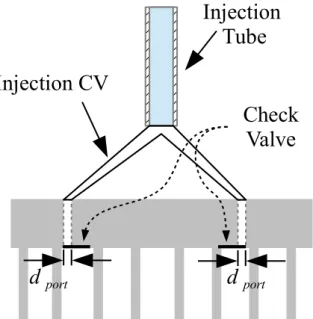
Figure 4: Schematic of the components used in the simulation for one pair of injection ports
2.3 Injection Ports and Lines
The location and sizing of the injection ports has a profound impact on the working process of the vapor injected compressor. In this analysis it is assumed that each of the injection ports is symmetric with respect to the center of the compressor and is added to the fixed scroll. Wang (5; 6) provides a quite thorough analysis of the optimal locations and characteristics of the injection ports when one injection line is used.
When there is one set of injection lines, the first pair of injection ports is located such that the ports are only in contact with the outermost compression chambers so that there is no flow of injected fluid into the suction chamber. Injection of vapor directly into the suction chamber can be thought of as a leakage term that tends to reduce the amount of volume in the suction chamber that can be used to accept suction vapor.
In the simulation code, a few simplifying assumptions are made about the injection process. It is assumed that there is no heat transfer in the injection line between the injected refrigerant and the ambient, and that the pressure drop is also zero in this line.
The system of injection line and ports is decoupled into a network of components as shown in Figure 4. The refrigerant enters into the injection tube which is treated as being a quasi-steady tube as described in Bell (13). The steady-state mean value for the mass flow rate through the tube (which is updated after each cycle of the compressor simulation) is used to calculate the pressure drop through the line. The injection tube is connected to a time-variant control volume that allows for the dynamics of the pressure in the injection lines to be modeled due to outflow from the control volume into the compression pocket of the compressor. Finally, an isentropic nozzle model is used to model the flow rate between the injection line control volume and the compression chambers.
As is noted by Wang (5; 6), check valves can be useful to avoid backflow of refrigerant into the injection lines under high evaporation pressure conditions. Simplified check
Injection line at p
inj,1Injection line at p
inj,2Figure 5: Scroll compressor with injection ports shown at a crank angle of θ = π/2 radians
valves have been implemented in the simulation by assuming idealized check valve behavior. That is, if the pressure in the injection control volume is less than the pressure in the compression chamber it is connected to, no mass is allowed to flow back into the injection control volume. The additional pressure drop associated with the check valve has not been included.
The description of the dimensions of the ports and lines considered can be found in Table 1. The ports themselves are located at an involute angle as close to the suction as possible, which yields the injection port configuration as shown in Figure 5. The inner set of injection ports at pinj,2(as described in a following section) are only used
when both pairs of injection ports are active.
The injection port is considered to be fully open to the chamber that it is connected to, and the mixing of the injected refrigerant is assumed to happen instantaneously in the compression pocket.
3 CYCLE ANALYSIS
In order to more fully study the compressor behavior with vapor injection it is neces-sary to develop the appropriate cycle models.
3.1 No Injection Lines (Conventional Operation)
When no injection lines are used, the performance of the cycle is that of the conven-tional four-component heat pump cycle. The working fluid vapor exits the evaporator slightly superheated (state point # 1) and then enters into the compressor where it is compressed to the discharge pressure at state point # 2. The working fluid is condensed in the condenser to a subcooled state (state point # 3), then expanded in the expansion device to the evaporating pressure at state point # 4, and finally evaporates in the evaporator to a superheated state.
The mass flow rate through the system is the same through all the components and is given by ˙mevap. The rate of heat input to the evaporator is given by
˙
Qevap= ˙mevap(h1− h4) (3)
and the heat rejected by the condenser (the useful output of the heat pump) is given by
˙
Qcond= ˙mcond(h2− h3) (4)
where ˙mcond = ˙mevap and the sign of ˙Qcond is selected to be positive. The electrical
power input to the compressor ˙Wcomp and the mass flow rate through the evaporator
˙
mevap are given from the compressor simulation code. W˙comp is in general greater
than ˙mevap(h2− h1)due to ambient heat loss in the compressor. The heating-mode
coefficient of performance is given by COPh= ˙ Qcond ˙ Wcomp (5)
3.2 One Injection Line Cycle Analysis
100 200 300 400 500 600 700 800 Enthalpy [kJ/kg] 200 400 600 800 1000 1200 1400 1600 1800 2000 P re ss u re [k P a ]
pe
pc
p
f,1p
inj,1h
2h
3h
4h
′ f,1h
′′ f,1−
−
h
in j,1h
1−20 −10 0 10 20 30 40 Tsat,f,1[◦C] 0.0 0.1 0.2 0.3 0.4 0.5 0.6 X1 [-]
Figure 8: Injection fraction for propane evaporating at 244.5 kPa [-20◦C saturated] and condensing at 1476.7 kPa [43.3◦C saturated] with 5 K
subcooling at the outlet of the condenser
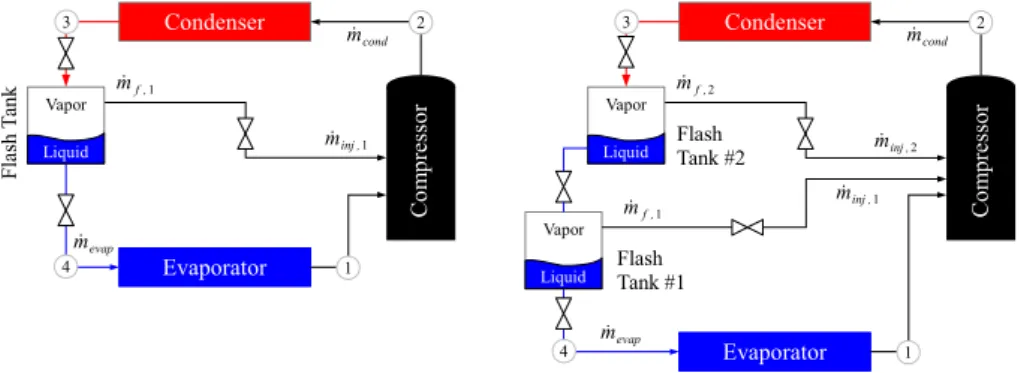
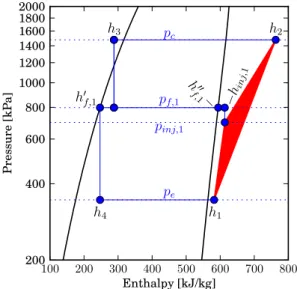
When one injection line is employed, a few components need to be added to the conventional heat pump system. In the single-injection configuration, the primary expansion valve flashes the refrigerant to an intermediate pressure pf,1, at which
point the phases are separated in a flash tank at constant pressure. The saturated vapor is sent to the compressor, and the saturated liquid is further expanded to the evaporating pressure. The two-step expansion yields a lower inlet enthalpy to the evaporator, which results in higher rate of heat input, and therefore also a higher rate of heat output in the condenser.
The mass and energy balances on the flash tank can be expressed as ˙
mcond = m˙evap+ ˙mf,1 (Mass)
˙
mcondh3 = m˙evaph′f,1+ ˙mf,1h′′f,1 (Energy)
(6) where h′f,1and h′′f,1are the saturated liquid and saturated vapor enthalpies for a given flash tank pressure pf,1. This yields the ratio of the mass flow rates of vapor to liquid
generated in the flash tank of X1= ˙ mf,1 ˙ mevap =h3− h ′ f,1 h′′f,1− h3 (7) and the condenser mass flow rate is given by ˙mcond= ˙mevap(1 + X1). The capacity and
COP of the system are as given in Equations 4 and 5, where in this case, h4is equal to h′f,1. The electrical power input to the compressor ˙Wcomp is given by the compressor
simulation code, as will be further described below.
As an example, Figure 8 shows the value of X1as a function of the flash tank
sat-uration temperature. Mass flow fractions below zero are non-physical and represent impossible operation states. The highest flash tank saturation temperature that can yield vapor generation is 38.3◦C under these conditions. This is a characteristic curve for the fluid that is independent of the compressor. The lower limit on the flash tank saturation temperature is the evaporation saturation temperature.
It should be mentioned that this analysis is intended only for pure working fluids. More care is required to use this analysis with zeotropic blends with temperature glide or azeotropic blends (like R404A or R410A) with nearly no temperature glide. In particular, for mixtures, the dew and bubble temperatures of the mixture are not equal for a given pressure.
3.3 Two Injection Line Cycle Analysis
In the two injection line case, the analysis is quite similar to that of the one injection line case. A system of equations is set up like Equation 6; there is one pair of equations
0 200 400 600 800 1000 1200 1400 pf,1[kPa] 200 400 600 800 1000 1200 1400 1600 pf ,2 [k P a ]
X
1=
0
X
2= 0
p
f ,1=
p
eFigure 9: Range of validity of flash tank pressures for two lines for propane evaporating at 244.5 kPa [-20◦C saturated] and condensing at 1476.7 kPa
[43.3◦C saturated] with 5 K subcooling at the outlet of the condenser for each flash tank which arrive from mass and energy balances:
˙ mcond = m˙f,2+ ˙mf,1+ ˙mevap ˙ mcondh3 = ( ˙mevap+ ˙mf,1)h′f,2+ ˙mf,2h′′f,2 ˙ mcond− ˙mf,2 = m˙evap+ ˙mf,1 ( ˙mcond− ˙mf,2)h′f,2 = m˙evaph′f,1+ ˙mf,1h′′f,1 (8)
which yields the ratio of vapor generated to liquid generated in each flash tank of X2= ˙ mf,2 ˙ mevap+ ˙mf,1 = h3− h′f,2 h′′f,2− h3 (9) X1= ˙ mf,1 ˙ mevap =h ′ f,2− h′f,1 h′′f,1− h′ f,2 (10)
As with the one-injection-line analysis, there are a few thermodynamic constraints on the possible flash tank pressures. One constraint is that pf,2 must be greater than pf,1, and a second constraint is that both ˙minj,1 and ˙minj,2 must be positive. For a
given operating condition, it is therefore possible to map the range of possible flash tank pressures, as shown in Figure 9.
4 COMPRESSOR SIMULATION WITH ONE PAIR OF INJECTION PORTS The analysis of vapor injection in compressors integrated into the heat pumps can be decoupled into two separate sub-models. In the first sub-model, the compressor is simulated for a given injection pressure and injection port area, independent of the cycle.
For a range of compressor injection pressures, it is then possible to back-calculate the flash tank pressures that would be required to yield the same injection mass flow rate fraction as the simulation code predicts. In other words, the simulation code will provide predictions of ˙mevapand ˙minj,1 for a given value of pinj,1. Equation 7 can
then be iteratively solved to find the pf,1 that yields the same value of X1. Finally,
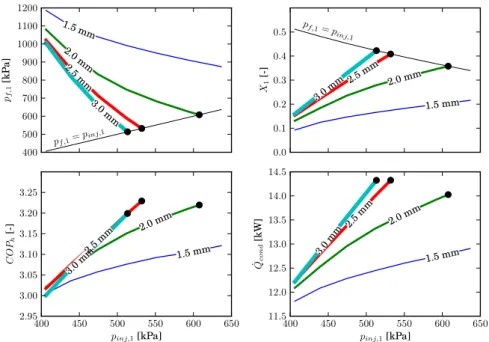
Figure 10 shows the results of this analysis; the flash tank saturation pressure is calculated as a function of the pressure of the injected vapor and the diameter of the injection port. Only the simulation results that yield a physical solution (pf,1>pinj,1)
are retained.
These results show that for a given injection port diameter there is a single solution that yields the same pressure between the injection line and the flash tank, denoted by
400 500 600 700 800 900 1000 1100 1200 pf ,1 [k P a ] 1.5mm 2.0m m 2.5 m m 3.0 m m pf,1= p inj,1 0.0 0.1 0.2 0.3 0.4 0.5 X1 [-] 1.5 mm 2.0mm 2.5m m 3.0 mm pf,1 = p inj,1 400 450 500 550 600 650 pinj,1[kPa] 2.95 3.00 3.05 3.10 3.15 3.20 3.25 C O Ph [-] 1.5 mm 2.0mm 2.5 mm 3.0 mm 400 450 500 550 600 650 pinj,1[kPa] 11.5 12.0 12.5 13.0 13.5 14.0 14.5 ˙ Qco n d [k W ] 1.5 mm 2.0mm 2.5 mm 3.0 mm
Figure 10: Flash tank pressure, system COP, heating capacity and injection fraction as a function of injection pressure to compressor and injection port
diameter (evaporating at -20◦C saturated and condensing at 43.3◦C saturated, 0 K subcooling)
the solid black circles. For a given injection pressure, as the port diameter is increased, the injection mass flow rate is increased, while ˙mevapis effectively constant, resulting
in a larger X1. Thus as the port diameter is increased, the intersection of the
system-and compressor X1curves moves to lower injection pressures.
This is analogous to the relationship between pump and system curves when siz-ing pumps for HVAC systems. The stable operation point is the intersection of the compressor (pump) curve and the system curve.
If there is a finite pressure drop between the flash tank and the injection line, the stable operation point can be found that yields the given difference in pressure. For a given injection port diameter, as the compressor injection pressure is increased, the COP increases monotonically, up to the point where the flash tank and injection pressures are equal. Therefore, the optimal system COP will always be found when the pressure drop between the flash tank and the compressor injection port is zero. Any additional pressure drop between the flash-tank and injection pressure generates irreversibilities.
There is an optimal injection port diameter that maximizes the system COP for the case where pf,1=pinj,1. As the port diameter decreases, the flash tank pressure increases,
which in turn decreases the capacity as well as increasing the throttling irreversibil-ities in the primary expansion valve. As the port diameter increases, the capacity increases, though the injection process irreversibility generation also increases due to the increased injection mass flow rate, which results in a fall-off of COP at higher injection port diameters.
On the other hand, from the standpoint of capacity, there is no penalty to compressor capacity at higher injection port diameters. The increase in heating capacity with
1.00 1.05 1.10 1.15 1.20 1.25 C O Ph / C O Ph ,b a s e li n e [-] 1 L ine 2 Lines −30 −25 −20 −15 −10 −5 0 Te[◦C] 1.20 1.25 1.30 1.35 1.40 1.45 ˙ Qco n d / ˙ Qco n d ,b a s e li n e [-] 1 L ine 2 Lines
Figure 11: Optimized compressors for a condensing temperature of 43.3◦C
vapor injection is largely due to the fact that the mass flow rate passing through the condenser is increased by a multiplicative factor of 1 + X1while the outlet of the
condenser is anchored. There is a small reduction in the outlet temperature of the compressor at higher injection mass flow rates, but the increase in capacity due to the increase in condenser mass flow rate is the dominant physical effect.
In the ideal case that there is no pressure drop between the flash tank and the compressor injection port, designing the compressor and the system for maximum efficiency yields nearly the maximum capacity as well. Therefore, in the analysis that follows, the injection port of diameter equal to 0.0025 m [2.5 mm] was selected as the injection port diameter.
5 OPTIMIZATION OF VAPOR-INJECTED COMPRESSORS WITH ONE AND TWO INJECTION LINES
As the analysis in the previous section showed, the optimal COP with one injection line is a function of both injection port diameter as well as injection pressure. Analogously, with two injection lines, the optimal performance is achieved for a com-pressor that has no pressure drop between each of the injection pressures and the respective flash tank pressure.
Thus with two injection lines it is possible to find the set of injection pressures that result in equivalent flash tank pressures. This is achieved through the use of a multi-dimensional non-linear system of equations solver.
For given injection pressures pinj,1 and pinj,2, the simulation code will then yield
predictions of ˙minj,1, ˙minj,2, as well as ˙mevap. Based on these predicted flow rates
it is possible to numerically solve Equation 9 to find the flash tank pressures pf,1and pf,2. The residuals to be driven to zero by the numerical solver are the pressure drops pf,1− pinj,1and pf,2− pinj,2by adjusting the parameters pinj,1 and pinj,2.
0 20 40 60 80 100 120 140 160 V [cm3 ] 200 400 600 800 1000 1200 1400 1600 p [k P a ]
531.1 kPa
388.4 kPa
762.3 kPa
N
o
Lin
es
O
ne
L
in
e
T
w
o
L
in
es
←
O
n
e
L
in
e
←
T
w
o
L
in
e
s
Legend
Simulation
Equal Press. Ratio
Figure 12: Pressure-volume plot for compressor with no, 1 and 2 injection lines and diagram of injection pressures (evaporating at -20◦C saturated
and condensing at 43.3◦C saturated)
Figure 11 shows the COP and capacity for the systems utilizing compressors with one and two injection lines. The injection pressure that yielded no pressure drop in the injection line was obtained using a numerical solver. These results show that the performance with two injection lines is always better than that with one injection line, which is in turn always better than the baseline system. At lower evaporation temperatures, the increase in system COP is greater than 20% with two injection lines. In addition, as the evaporation saturation temperature decreases, the improvement in heating capacity relative to the baseline improves monotonically.
Furthermore, Figure 12 shows a pressure-volume plot of the compressor operating at an evaporation pressure of 244.5 kPa [-20◦C saturated] at the optimal COPh point.
In adding one injection line, the net impact is to shift the pressure curve upwards. In adding a second injection line, the pressure-volume curve is warped during the compression process. The addition of the second injection line results in a lower first injection pressure of 386.6 kPa which results in less injection during the initial part of the compression. The second injection pressure is higher than the injection pressure with one line. The net result is that the pressure increases once the second port opens, and at the end of the compression, the pressure in the working chamber is slightly greater than that in the one-injection-line case.
CONCLUSIONS
Scroll compressors with multiple injection lines offer the prospect of significant im-provements in system efficiency. When optimizing the system design for vapor in-jection, it is necessary to carefully select the injection port diameter in order to obtain the maximum cycle efficiency. When the compressor is well-matched with the application, the increase in heating-mode COP can be greater than 20% with two injection lines.
Further work is ongoing to provide experimental validation of the results presented here.
REFERENCES LIST
[1] M. M. Mathison, James E. Braun, and Eckhard A. Groll. Modeling of a two-stage rotary compressor. HVAC&R Research, 14:719--748, 2008.
[2] Ian Bell. Performance increase of carbon dioxide refrigeration cycle with the addition of parallel compression economization. In Proc. IIR Gustav Lorentzen Conf. Natural Working Fluids, Glasgow, UK., 2004.
[3] Margaret M. Mathison, James E. Braun, and Eckhard A. Groll. Modeling of a novel spool compressor with multiple injection ports. In International Compressor Engineering Conference at Purdue, July 16-19, 2012, 2012.
[4] Baolong Wang, Xianting Li, Wenxing Shi, and Qisen Yan. Design of experimental bench and internal pressure measurement of scroll compressor with refrigerant injection. Int. J. Refrig., 30(1):179 -- 186, 2007.
[5] Baolong Wang, Wenxing Shi, Linjun Han, and Xianting Li. Optimization of refrigeration system with gas-injected scroll compressor. Int. J. Refrig., 32(7): 1544 -- 1554, 2009.
[6] Baolong Wang, Wenxing Shi, and Xianting Li. Numerical analysis on the effects of refrigerant injection on the scroll compressor. Appl. Therm. Eng., 29(1):37 --46, 2009.
[7] Baolong Wang, Wenxing Shi, Xianting Li, and Qisen Yan. Numerical research on the scroll compressor with refrigeration injection. Appl. Therm. Eng., 28(5–6): 440 -- 449, 2008.
[8] Youn-Cheol Park, Yongchan Kim, and Honghyun Cho. Thermodynamic analysis on the performance of a variable speed scroll compressor with refrigerant injection. Int. J. Refrig., 25:1072--1082, 2002.
[9] Eric L. Winandy and Jean Lebrun. Scroll compressors using gas and liquid injection- experimental analysis and modelling. Int. J. Refrig., 25:1143--1156, 2002.
[10] Asit K. Dutta, Tadashi Yanagisawa, and Mitsuhiro Fukuta. An investigation of the performance of a scroll compressor under liquid refrigerant injection. Int. J. Refrig., 24:577--587, 2001.
[11] S. Ayub, J. W. Bush, and D. K. Haller. Liquid refrigerant injection in scroll compressors operating at high compression ratios. In International Compressor Engineering Conference at Purdue University, pages 561--567, 1992.
[12] Honghyun Cho, Jin Taek Chung, and Yongchan Kim. Influence of liquid refrigerant injection on the performance of an inverter-driven scroll compressor. Int. J. Refrig., 26(1):87 -- 94, 2003.
[13] Ian H Bell, Vincent Lemort, Eckhard A. Groll, and James E. Braun. Development of a generalized steady-state simulation framework for positive displacement compressors and expanders. In International Conference on Compressors and their Systems 2013, 2013.
[14] Ian Bell. Positive Displacement Machine Simulation (PDSIM): http://pdsim.sf.net, 2012.
[15] U.S.A. Energy Information Administration. Annual energy review. Technical report, U.S.A. Energy Information Administration, 2012.
[16] Ian Bell. Theoretical and Experimental Analysis of Liquid Flooded Compression in Scroll Compressors. PhD thesis, Purdue University, 2011.
[17] Bryce R. Shaffer and Eckhard A. Groll. Parametric representation of scroll geometry with variable wall thickness. In International Compressor Engineering Conference at Purdue, July 16-19, 2012, 2012.
[18] Jens Gravesen and Christian Henriksen. The Geometry of the Scroll Compressor. SIAM Review, 43(1):113--126, 2001.
compu-tationally efficient hybrid leakage model for positive displacement compressors and expanders. Int. J. Refrig., 2013.
![Table 1: Parameters of the scroll compressor studied Geometric Parameters Volume ratio [-] 3.0 r b [mm] 2.228 r o [mm] 4.000 h s [mm] 52.346 t [mm] 3.000 φ i0 [rad] 0.000 φ is [rad] 3.142 φ ie [rad] 21.096 φ o0 [rad] -1.346 φ os [rad] 0.300 φ oe [rad] 21.0](https://thumb-eu.123doks.com/thumbv2/123doknet/6187929.159372/5.722.213.503.84.643/table-parameters-scroll-compressor-studied-geometric-parameters-volume.webp)
![Figure 8: Injection fraction for propane evaporating at 244.5 kPa [-20 ◦ C saturated] and condensing at 1476.7 kPa [43.3 ◦ C saturated] with 5 K](https://thumb-eu.123doks.com/thumbv2/123doknet/6187929.159372/9.722.233.507.76.237/figure-injection-fraction-propane-evaporating-saturated-condensing-saturated.webp)
![Figure 9: Range of validity of flash tank pressures for two lines for propane evaporating at 244.5 kPa [-20 ◦ C saturated] and condensing at 1476.7 kPa](https://thumb-eu.123doks.com/thumbv2/123doknet/6187929.159372/10.722.221.502.71.238/figure-range-validity-pressures-propane-evaporating-saturated-condensing.webp)