Improving the Use of G-CSF During Chemotherapy Using Physiological Mathematical Modelling: A Quantitative Systems Pharmacology Approach
par Morgan Craig
Facult´e de pharmacie
Th`ese pr´esent´ee `a la Facult´e des ´etudes sup´erieures en vue de l’obtention du grade de Philosophiæ Doctor (Ph.D.)
en sciences pharmaceutiques
D´ecembre, 2015
Facult´e des ´etudes sup´erieures
Cette th`ese intitul´ee:
Improving the Use of G-CSF During Chemotherapy Using Physiological Mathematical Modelling: A Quantitative Systems Pharmacology Approach
pr´esent´ee par: Morgan Craig
a ´et´e ´evalu´ee par un jury compos´e des personnes suivantes: Marc Servant, pr´esident-rapporteur
Fahima Nekka, directeur de recherche Michael C. Mackey, codirecteur
Leon Glass, membre du jury Piat van der Graaf, examinateur externe
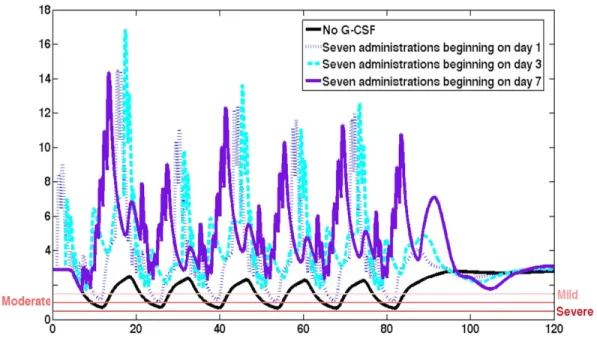
La diminution des doses administr´ees ou mˆeme la cessation compl`ete d’un traitement chimioth´erapeutique est souvent la cons´equence de la r´eduction du nombre de neutro-philes, qui sont les globules blancs les plus fr´equents dans le sang. Cette r´eduction dans le nombre absolu des neutrophiles, aussi connue sous le nom de my´elosuppression, est pr´ecipit´ee par les effets l´etaux non sp´ecifiques des m´edicaments anti-canc´ereux, qui, pa-rall`element `a leur effet th´erapeutique, produisent aussi des effets toxiques sur les cellules saines. Dans le but d’att´enuer cet impact my´elosuppresseur, on administre aux patients un facteur de stimulation des colonies de granulocytes recombinant humain (rhG-CSF), une forme exog`ene du G-CSF, l’hormone responsable de la stimulation de la production des neutrophiles et de leurs lib´eration dans la circulation sanguine. Bien que les bien-faits d’un traitement prophylactique avec le G-CSF pendant la chimioth´erapie soient bien ´etablis, les protocoles d’administration demeurent mal d´efinis et sont fr´equemment d´ e-termin´es ad libitum par les cliniciens. Avec l’optique d’am´eliorer le dosage th´erapeutique et rationaliser l’utilisation du rhG-CSF pendant le traitement chimioth´erapeutique, nous avons d´evelopp´e un mod`ele physiologique du processus de granulopo¨ı`ese, qui incorpore les connaissances actuelles de pointe relatives `a la production des neutrophiles des cel-lules souches h´ematopo¨ı´etiques dans la moelle osseuse. `A ce mod`ele physiologique, nous avons int´egr´e des mod`eles pharmacocin´etiques/pharmacodynamiques (PK/PD) de deux m´edicaments : le PM00104 (Zalypsis®), un m´edicament anti-canc´ereux, et le rhG-CSF (filgrastim). En se servant des principes fondamentaux sous-jacents `a la physiologie, nous avons estim´e les param`etres de mani`ere exhaustive sans devoir recourir `a l’ajustement des donn´ees, ce qui nous a permis de pr´edire des donn´ees cliniques provenant de 172 patients soumis au protocol CHOP14 (6 cycles de chimioth´erapie avec une p´eriode de 14 jours o`u l’administration du rhG-CSF se fait du jour 4 au jour 13 post-chimioth´erapie). En utili-sant ce mod`ele physio-PK/PD, nous avons d´emontr´e que le nombre d’administrations du rhG-CSF pourrait ˆetre r´eduit de dix (pratique actuelle) `a quatre ou mˆeme trois administra-tions, `a condition de retarder le d´ebut du traitement prophylactique par le rhG-CSF. Dans un souci d’applicabilit´e clinique de notre approche de mod´elisation, nous avons investigu´e l’impact de la variabilit´e PK pr´esente dans une population de patients, sur les pr´edictions
du mod`ele, en int´egrant des mod`eles PK de population (Pop-PK) des deux m´edicaments. En consid´erant des cohortes de 500 patients in silico pour chacun des cinq sc´enarios de variabilit´e plausibles et en utilisant trois marqueurs cliniques, soient le temps au nadir des neutrophiles, la valeur du nadir, ainsi que l’aire sous la courbe concentration-effet, nous avons ´etabli qu’il n’y avait aucune diff´erence significative dans les pr´edictions du mod`ele entre le patient-type et la population. Ceci d´emontre la robustesse de l’approche que nous avons d´evelopp´ee et qui s’apparente `a une approche de pharmacologie quantitative des syst`emes (QSP).
Motiv´es par l’utilisation du rhG-CSF dans le traitement d’autres maladies, comme des pathologies p´eriodiques telles que la neutrop´enie cyclique, nous avons ensuite sou-mis l’´etude du mod`ele au contexte des maladies dynamiques. En mettant en ´evidence la non validit´e du paradigme de la r´etroaction des cytokines pour l’administration exog`ene des mim´etiques du G-CSF, nous avons d´evelopp´e un mod`ele physiologique PK/PD nova-teur comprenant les concentrations libres et li´ees du G-CSF. Ce nouveau mod`ele PK a aussi n´ecessit´e des changements dans le mod`ele PD puisqu’il nous a permis de retracer les concentrations du G-CSF li´e aux neutrophiles. Nous avons d´emontr´e que l’hypoth`ese sous-jacente de l’´equilibre entre la concentration libre et li´ee, selon la loi d’action de masse, n’est plus valide pour le G-CSF aux concentrations endog`enes et m`enerait en fait `a la sur-estimation de la clairance r´enale du m´edicament. En proc´edant ainsi, nous avons r´eussi `a reproduire des donn´ees cliniques obtenues dans diverses conditions (l’administration exo-g`ene du G-CSF, l’administration du PM00104, CHOP14). Nous avons aussi fourni une explication logique des m´ecanismes responsables de la r´eponse physiologique aux deux m´edicaments.
Finalement, afin de mettre en exergue l’approche int´egrative en pharmacologie adopt´ee dans cette th`ese, nous avons d´emontr´e sa valeur inestimable pour la mise en lumi`ere et la reconstruction des syst`emes vivants complexes, en faisant le parall`ele avec d’autres disci-plines scientifiques telles que la pal´eontologie et la forensique, o`u une approche semblable a largement fait ses preuves. Nous avons aussi discut´e du potentiel de la pharmacologie quantitative des syst`emes appliqu´ees au d´eveloppement du m´edicament et `a la m´edecine translationnelle, en se servant du mod`ele physio-PK/PD que nous avons mis au point.
Mots cl´es: pharmacologie des syst`emes, granulopo¨ı`ese, mod´elisation m´ echanis-tique, pharmacocin´etiques/pharmacodynamiques physiologiques, biologie des syst`emes.
Dose-limitation or interruption of chemotherapeutic treatment is most often promp-ted by a decrease in circulating neutrophils, the most abundant white blood cell in the human body. Myelosuppression, or a reduction in absolute neutrophil counts (ANCs) by anti-cancer treatments, is precipitated by the nonspecific killing effect of chemother-apeutic drugs which have toxic effects on noncancerous cells. To mitigate this myelo-suppressive effect, patients are frequently administered recombinant human granulocyte colony-stimulating factor (rhG-CSF), an exogenous form of the cytokine G-CSF, which stimulates neutrophil production and release into the blood stream. While the benefits of adjuvant treatment rhG-CSF during chemotherapy are well recognised, the protocols with which it is administered are not well defined and are frequently determined ad libitum by clinicians. To quantify and address the optimisation of the administration of rhG-CSF during chemotherapeutic treatment, we developed a physiological model of granulopoiesis which incorporates the contemporary understanding of the production of neutrophils from the hematopoietic stem cells in the bone marrow. To this physiological model, we incor-porated mechanistic pharmacokinetic/pharmacodynamic (PK/PD) models of two drugs, PM00104 (Zalypsis®), a chemotherapeutic drug, and rhG-CSF (filgrastim). Through ex-haustive parameter estimation using first principles and no data fitting, we successfully predicted clinical data from 172 patients for an average patient undergoing the CHOP14 protocol (6 cycles of 14-day periodic chemotherapy with rhG-CSF administered on days 4-13 post-chemotherapy). We then demonstrated that delaying the administration of rhG-CSF to 6 or 7 days post-chemotherapy allowed for a reduction in the number of filgrastim administrations from ten to four or even three while maintaining or improving the neu-trophil nadir. We also investigated the effects of PK variability on the model’s predictions by incorporating population PK (PopPK) models of both drugs. Using five different vari-ability scenarios and cohorts of 500 in silico patients per scenario, we established that there are no statistically significant differences between a typical patient and the popula-tion in the model’s predicpopula-tions with respect to three crucial clinical endpoints, namely the time to ANC nadir, the ANC nadir, and the area under the concentration-effect curve. The model’s robustness to PK variability allows for the scaling up from the individual to
population level.
Motivated by the use of rhG-CSF in other disease-states, namely periodic pathologies like cyclical neutropenia, we next endeavoured to contextualise the model within dynamic diseases. By bringing to light that the cytokine paradigm is broken when exogenous cy-tokine mimetics are administered, we developed a novel physiological PK model for G-CSF incorporating both unbound and bound concentrations. The updated PK model prompted changes to the PD model since we could now track the concentrations of bound G-CSF. We showed that the mass-action equilibrium hypopthesis for bound and unbound drugs is not valid and led to overestimations of the renal clearance of G-CSF. We also successfully reproduced clinical data in a variety of settings (exogenous G-CSF alone, PM00104 alone, CHOP14 protocol) and clarified the mechanisms underlying the body’s response to both drugs. Lastly, we discussed the potential of quantitative systems pharmacology in both drug development and translational medicine by using the physiological PK/PD model we developed.
Keywords: quantitative systems pharmacology, granulopoiesis, mechanistic modelling, physiologic pharmacokinetics/pharmacodynamics, systems biology.
R´esum´e . . . iii
Abstract . . . vi
Contents . . . viii
List of Tables . . . xii
List of Figures . . . xiii
List of Appendices . . . xv
List of Abbreviations . . . xvi
Notation . . . xix
Dedication . . . .xxvi
Acknowledgments . . . .xxvii
Preface . . . xxx
Chapter 1: Introduction . . . 1
1.1 Neutrophil Bone Marrow Development from the Hematopoietic Stem Cells 1 1.1.1 Hematopoietic Stem Cells: Pluripotent Regulators of Hematopoiesis . . . 1
1.1.2 Neutrophil Development and Biology . . . 4
1.2 Neutrophil Pathologies . . . 5
1.3 Regulation of Neutrophils by G-CSF . . . 7
1.4 The Use of G-CSF in a Clinical Setting . . . 9
1.5 Non-oncological Treatment with rhG-CSF . . . 10
1.5.1 Severe Congenital Neutropenia . . . 10
1.5.3 Stem Cell Transplantation . . . 11
1.5.4 Further Applications and Investigational Studies . . . 11
1.6 Oncological Settings: Treating Cancer with Chemotherapy . . . 12
1.6.1 Chemotherapy: Mechanism of Action and Hematological Toxicities 13 1.7 The Use of rhG-CSF to Mitigate Myelosuppressive Chemotherapy . . . 14
1.8 An Interdisciplinary Approach to Guide the Clinical Practice . . . 16
1.9 Early Studies of Myelosuppression and Statistical Approaches . . . 17
1.10 The Friberg Model and Semi-mechanistic Approaches . . . 20
1.11 Physiologically-Based PK/PD Studies and Target-Mediated Drug Disposi-tion Models . . . 24
1.12 Systems Biology Approaches and Quantitative Systems Pharmacology De-velopments . . . 28
1.12.1 Delay Differential Equations, Age-Structured Models, and Lifespan Models in Hematopoiesis . . . 30
1.13 Population Pharmacokinetics/Pharmacodynamics and their Application to Myelosuppression . . . 33
1.14 Objectives . . . 34
References . . . 36
Chapter 2: Neutrophil Dynamics During Concurrent Chemotherapy and G-CSF Administration: Mathematical Modelling Guides Dose Optimisation to Minimise Neutropenia . . . 54
2.1 Introduction . . . 55
2.2 The Model . . . 59
2.2.1 Development of a Physiological Model of Granulopoiesis . . . 59
2.2.2 Pharmacokinetic Modelling . . . 63
2.2.3 Determination of Pharmacodynamic Models for Drug Effects . . . . 67
2.3 Results . . . 70
2.3.1 Numerical Simulations . . . 72
2.3.2 The Use of Physiological Models . . . 72
References . . . 81
2.5 Appendices . . . 85
2.5.1 Appendix A: Homeostatic Hematopoietic Parameter Estimation . . 85
2.5.2 Appendix B: PK-related Parameter Estimation . . . 88
2.5.3 Appendix C: PD-related Parameter Estimation . . . 90
Chapter 3: Impact of Pharmacokinetic Variability on a Mechanistic Physiological Pharmacokinetic/Pharmacodynamic Model: A Case Study of Neutrophil Development, PM00104, and Filgrastim . . . 94
3.1 Introduction . . . 95
3.2 A Hypothesis-driven Physiological/PK/PD Model of Granulopoiesis During Chemotherapy With Supportive Adjuvant . . . 97
3.3 Pharmacokinetics and Pharmacodynamics of PM00104 . . . 100
3.4 Pharmacokinetic and Pharmacodynamic Model of G-CSF . . . 102
3.5 Incorporating Variability Into the Physiological PK/PD Model . . . 104
3.6 Quantification of the Impact of IIV Using Computer Simulation . . . 107
3.6.1 Statistical Analyses . . . 108
3.7 Results . . . 108
3.7.1 No Statistically Significant Differences in Time to Nadir Between the Model With and Without Variability . . . 108
3.7.2 No Statistically Significant Differences in the Value of the Nadir Between the Models With or Without Variability . . . 109
3.7.3 No Statistically Significant Differences in the Area Under the Effects-time Curve Between the Model With or Without Variability . . . . 109
3.7.4 Full Time Courses of Neutrophil Counts . . . 111
3.7.5 Assessing the Impact of PK Variability on Regimens Identified by the Physiological Model . . . 113
3.8 Discussion . . . 116
References . . . 119
Chapter 4: A Mathematical Model of Granulopoiesis Incorporating the Negative Feedback Dynamics and Kinetics of
G-CSF/Neutrophil Binding and Internalisation . . . 125
4.1 Introduction . . . 126
4.2 Model Summary . . . 129
4.3 Model Development . . . 133
4.3.1 Stem Cells . . . 134
4.3.2 A physiologically constructed pharmacokinetic G-CSF model . . . . 134
4.3.3 Modelling Granulopoiesis . . . 139
4.3.4 G-CSF Pharmacodynamics . . . 143
4.3.5 Modelling exogenous drug administration . . . 148
4.4 Parameter Estimation and Equation Constraints . . . 151
4.4.1 Neutrophil Steady-State Parameter Determination and Constraints 151 4.4.2 Estimation of G-CSF Pharmacokinetic Parameters . . . 156
4.4.3 Parameter estimates from G-CSF knockout . . . 163
4.4.4 Estimating the Pharmacodynamic Parameters . . . 166
4.4.5 Estimation of Chemotherapy Related Parameters . . . 171
4.5 Parameter Values . . . 174
4.6 Model evaluation and functional responses . . . 178
4.7 Discussion . . . 183
References . . . 185
Chapter 5: Approaching Pharmacometrics as a Palaeontologist Would: Recovering the Links Between Drugs and the Body Through Reconstruction . . . 194
References . . . 200
Chapter 6: Discussion . . . 202
2.I Table of Parameter Values . . . 72
3.I Summary of the Population Pharmacokinetic Parameters of PM00104 Model . . . 106
3.II Summary of the Population Pharmacokinetic/Pharmacodynamic Pa-rameters of Filgrastim Model . . . 107
3.III Effect of Variability on the Time to Nadir . . . 109
3.IV Effect of Variability on the Neutrophil Nadir . . . 111
3.V Effect of Variability on the Area Under the Effects Curve . . . 113
4.I G-CSF Pharmacokinetic Parameter Estimates . . . 160
4.II Pharmacodynamic Parameter Estimation Results . . . 168
4.III Chemotherapy Effects Parameter Estimation Results . . . 172
4.IV Final Model Parameter Values . . . 175
4.V Auxiliary Parameter Values . . . 176
1.1 Classical Model of Blood Cell Differentiation . . . 2
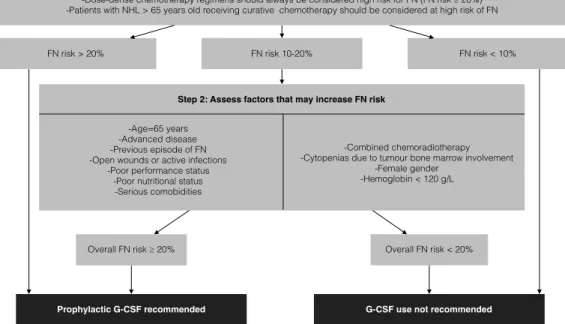
1.2 The European Organisation for Research and Treatment of Cancer Decision Tree Guidelines for the Prophylactic Use of G-CSF During Chemotherapy . . . 16
1.3 Canadian Guidelines for the Use of G-CSF During Chemotherapy . . 17
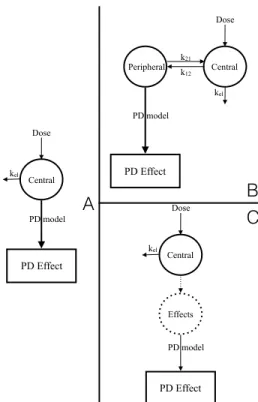
1.4 Direct and Indirect Pharmacodynamic Models . . . 22
1.5 Schematic Representation of the Friberg Model . . . 23
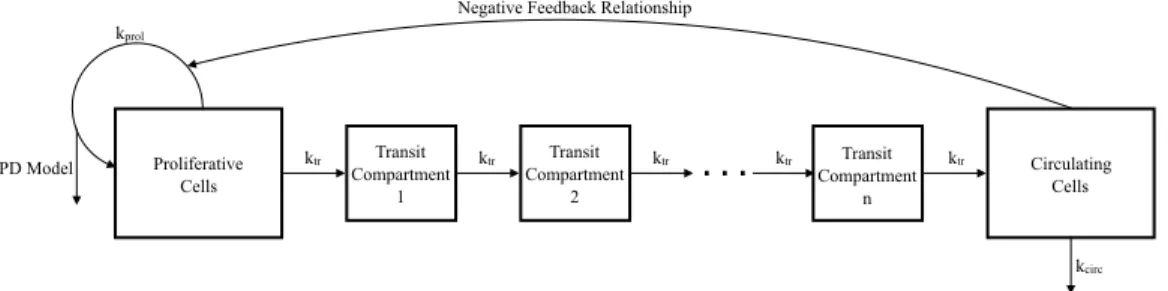
2.1 Schematic Representation of the Production of Circulating Neutrophils in the Bone Marrow . . . 61
2.2 CHOP14 Comparison . . . 74
2.3 Effect of Day of Administration . . . 77
2.4 Effect of Fixed Starting Day Post-chemotherapy . . . 78
2.5 Optimal CHOP14 dosing regimens . . . 79
3.1 Schematic Representation of Neutrophil Production . . . 99
3.2 Schematic Representation of the Pharmacodynamic Effects of PM00104 and Filgrastim . . . 105
3.3 Effect of Variability on the Time to Nadir . . . 110
3.4 Effect of Variability on the Neutrophil Nadir . . . 112
3.5 Effect of Variability on the Area Under the Effects Curve . . . 114
3.6 Effect of Variability on the Absolute Neutrophil Count . . . 115
3.7 Effect of Variability on the Time to Nadir: Magnification . . . 123
4.1 Schematic Representation of Neutrophil Production Regulated by G-CSF . . . 130
4.2 G-CSF Pharmacokinetic Modelling Issues . . . 136
4.3 Variable Aging Rate Model . . . 140
4.4 Transition From Proliferation to Maturation . . . 142
4.5 G-CSF Pharmacokinetic Parameter Fitting Results . . . 161 4.6 Pharmacokinetic Parameter Fitting Results: Testing the Estimates . 162
4.7 Granulopoiesis Model Parameter Fitting Results . . . 170 4.8 Chemotherapy Model Parameter Fitting Results . . . 173 4.9 Model Comparison to CHOP14 Protocol . . . 180 4.10 Stem Cell, Marrow Reservoir, Unbound and Bound G-CSF Responses
to CHOP14 Protocol . . . 181 4.11 Functional Responses of the Granulopoiesis Model . . . 182
Appendix I: Simulation Code for the Physiological PK/PD Neutrophil Model with Exogenous Drug Administration . . . .xxxii
Abbreviation Description
ABM Agent-based model
AIDS Acquired immunodeficiency syndrome
ALB Albumin
ANC Absolute neutrophil count ARV Antiretroviral treatments
ASCO American Society of Clinical Oncology
AUC Area under the curve
AUEC Area under the effect curve
B B-cell
BILI Bilirubin
BMP-4 Bone morphogenetic protein 4
C/EBPα CCAAT/enhancer-binding protein, alpha C/EBPε CCAAT-enhancer-binding proteins, epsilon CCS Canadian Cancer Society
CGP Circulating granulocyte pool
CHOP Chemotherapy regimen which includes
Cyclophosphamide, Hydroxydaunorubicin, Oncovin and Prednisone/Prednisolone
CI Confidence interval
CL Clearance
CLP Common lymphoid progenitor CMP Common myeloid progenitor
CN Cyclical neutropenia
CRU Competitive repopulating unit DDE Delay differential equation DNA Deoxyribonucleic acid E.coli Escherichia coli
Abbreviation Description
EORTC European Organisation for Research and Treatment of Cancer
Eos Eosinophil
EP Erythroid progenitor
FDA Food and Drug Administration
FN Febrile neutropenia
G-CSF Granulocyte colony-stimulating factor
G-CSFR Granulocyte colony-stimulating factor receptor GFI-1 Growth factor independent 1 transcription repressor GM-CSF Granulocyte-macrophage colony-stimulating factor GMP Granulocyte-macrophage progenitor
H0 Null hypothesis
HIV Human immunodeficiency virus
HoxB4 Homeobox protein B
HSC Hematopoietic stem cell IIV Interindividual variability
IL Interleukin
IOV Interoccasion variability
kDa Kilodaltons
LTRC Long-term repopulating cell
MC Monocyte
MEM Mixed-effects model
MEP Megakaryocyte erythroid progenitor MKP Megakaryocyte progenitor
MNP Marginated neutrophil pool MPP Multipotent progenitor
MTT Mean transit time
Nad ANC nadir
NCA Non-compartmental analysis
Abbreviation Description
Neu Neutrophil
NIH National Institutes of Health
NK Natural killer cell
NSERC Natural Sciences and Engineering Research Council ODE Ordinary differential equation
PBPC Peripheral blood progenitor cells
PBPK Physiologically-based pharmacokinetics PDE Partial differential equation
PK/PD Pharmacokinetics/pharmacodynamics PKPD Pharmacokinetics/pharmacodynamics
PLT Platelet
PopPK/PD Population pharmacokinetics/pharmacodynamics QSP Quantitative systems pharmacology
RBC Red blood cell/erythroid
rh Recombinant human
RV Random variable
SCN Severe congenital neutropenia
T T-cell
TBGP Total blood granulocyte pool
TGF Transforming (tumour) growth factor TMDD Target-mediated drug disposition
TNad Time to ANC nadir
TNF Tumour necrosis factor Vd Volume of distribution
Notation Interpretation Units Chapter 1
Cave Average concentration etoposide −
C24 Etoposide concentration after 24 hours −
R1 Infusion rate before 28 hours −
R2 Infusion rate after 28 hours −
Ce f f Effective concentration −
E(t) Concentration-effect relationship −
W BC(t) WBC count over time −
Baseline Baseline WBC count −
Edir Direct effect −
Eobs Observed effect −
C Drug concentration −
γ1 Hill coefficient −
C50 Half-maximal concentration −
AU CEdir Area under the concentration-effect curve −
Edir max Scaling factor −
W BCpred Predicted WBC count −
Emax Maximal effect −
P Proliferating neutrophils −
Ti Transit compartment i −
N Circulating neutrophils −
N0 Baseline neutrophil count −
γ Hill coefficient −
ktr Transit rate −
kprol Rate of proliferation −
kcirc Rate of circulation −
Cp Plasma concentration of drug −
Abbreviation Interpretation Units
DT Tissue concentration −
Rmax Total density of surface receptors −
Vc Volume of central compartment −
kon Rate of receptor binding −
kof f Rate of receptor unbinding −
km Rate of internalisation −
ksyn Rate of synthesis −
kdeg Degradation rate −
Chapters 2 and 3
Qhomeo Concentration of HSCs at homeostasis 106cells/kg
γS HSC rate of apoptosis days−1
τS Time for HSC re-entry days
AhomeoQ HSC amplification at homeostasis
κδ HSC differentiation rate into other lineages days−1
βQhomeo HSC rate of re-entry days−1
fQ Maximal HSC re-entry rate days−1
s2 HSC re-entry Hill coefficient
θ2 Half-maximal HSC concentration 106cells/kg
Nrhomeo Homeostasis concentration of reservoir 109cells/kg
Nhomeo Homeostatic concentration of TBNP 109cells/kg
Ncirchomeo Homeostatic concentration of circulating neutrophils 109cells/kg
γN Circulating neutrophil rate of removal days−1
τN P Time for neutrophil proliferation days
aN M Time for neutrophil maturation at homeostasis days
τN r Time spent in marrow reserve days
γN r Rate of removal from marrow reserve days−1
γN M Rate of removal during maturation phase days−1
Abbreviation Interpretation Units AhomeoN Neutrophil amplification at homeostasis
ηhomeoN P Neutrophil proliferation rate days−1
fN Maximal rate of neutrophil differentiation days−1
s1 Neutrophil differentiation Hill coefficient
θ1 Half maximal conc. neutrophil differentiation 109cells/kg
ftranshomeo Homeostatic rate of transit from marrow reserve days−1
kelC Zalypsis®rate of elimination days
−1
k12 Rate of exchange days−1
k21 Rate of exchange days−1
k13 Rate of exchange days−1
k31 Rate of exchange days−1
k24 Rate of exchange days−1
k42 Rate of exchange days−1
BSA Average body surface area m2
Ghomeo G-CSF concentration at homeostasis ng/mL
Gprod Rate of G-CSF production ng/mL/days
kren Rate of G-CSF renal elimination days−1
χ Normalisation factor 10ng/mL9cells/kg
kint G-CSF receptor-internalisation rate days−1
kD G-CSF dissociation constant ng/mL
ka Subcutaneous filgrastim absorption rate days−1
F Filgrastim bioavailable fraction
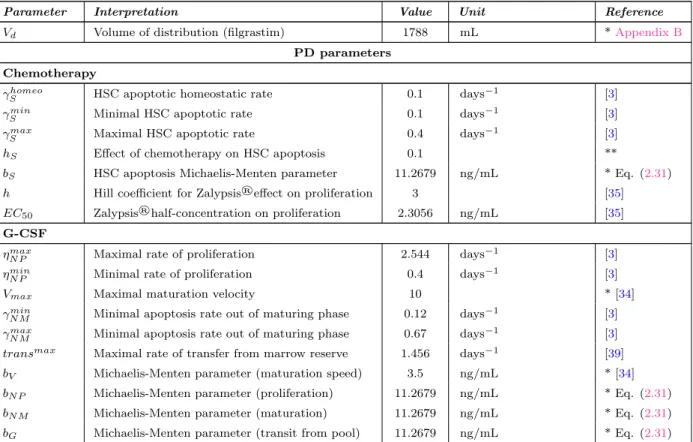
Vd Volume of distribution (filgrastim) mL
γShomeo HSC apoptotic homeostatic rate days−1
γSmin Minimal HSC apoptotic rate days−1
γSmax Maximal HSC apoptotic rate days−1
hS Effect of chemotherapy on HSC apoptosis
bS HSC apoptosis Michaelis-Menten parameter ng/mL
Abbreviation Interpretation Units
EC50 Zalypsis®half-concentration on proliferation ng/mL
ηmaxN P Maximal rate of proliferation days−1
ηminN P Minimal rate of proliferation days−1
Vmax Maximal maturation velocity
γN Mmin Minimal apoptosis rate out of maturing phase days−1 γN Mmax Minimal apoptosis rate out of maturing phase days−1 transmax Maximal rate of transfer from marrow reserve days−1
bV Michaelis-Menten parameter (maturation speed) ng/mL
bN P Michaelis-Menten parameter (proliferation) ng/mL
bN M Michaelis-Menten parameter (maturation) ng/mL
bG Michaelis-Menten parameter (transit from pool) ng/mL
Cl PM001014 Clearance L/hr
V1 PM001014 Volume of central compartment L
Q2 PM001014 Transit rate (compartments 1 and 2) L
V2 PM001014 Volume of second compartment L/hr
Q3 PM001014 Transit rate (compartments 1 and 3) L/hr
V3 PM001014 Volume of third compartment L
Q4 PM001014 Transit rate (compartments 2 and 4) L/hr
V4 PM001014 Volume of fourth compartment L
kel Rate of renal elimination filgrastim (Krzyzanski) hr−1
Vd Volume of distribution filgrastim (Krzyzanski) L
ξ GCSFR concentration per neutrophil (Krzyzanski) fg/cell
N B0 Initial number of blood neutrophils (Krzyzanski) cells/µL
SC50 Concentration eliciting 50% of the maximal effect ng/mL
Smax1 Maximum effect (Krzyzanski)
Pj,k Individual jth PK parameter for the kth occasion
ηj IIV random variable
τj IOV random variable
Abbreviation Interpretation Units
TNadtest Test time to nadir days
Nadref Reference nadir value 109 cells/kg
Nadtest Test nadir value 109 cells/kg
AUCEref Reference AUCE value 109 days cellskg
Chapter 4
γQ HSC apoptosis rate days−1
τQ Time for HSC re-entry days
AQ HSC Amplification Factor −
fQ Maximal HSC re-entry rate days−1
s2 HSC re-entry Hill coefficient −
θ2 Half-effect HSC concentration 106 cells/kg
κδ HSC differentiation rate to other lines days−1
κmin HSC-neutrophil minimal differentiation rate days−1
κ∗ HSC-neutrophil homeo differentiation rate days−1
G∗2 Bound G-CSF concentration ng/mL
s1 HSC-neutrophil differentiation Hill coefficient −
η∗NP Neutrophil homeostasis effective proliferation rate days−1
bNP Neutrophil proliferation M-M constant ng/mL
ηminNP Neutrophil minimal proliferation rate days−1
τNP Neutrophil proliferation time days
Vmax Maximal neutrophil maturation velocity −
bV Maturation velocity half-effect concentration ng/mL
aNM Homeostasis neutrophil maturation time days
γNM Neutrophil death rate in maturation days
−1
ϕ∗NR Homeostasis Reservoir Release rate days−1
ϕmaxNR Maximal Reservoir Release rate days−1
bG Reservoir Release half-effect concentration ng/mL
γNR Neutrophil death rate in reservoir days
Abbreviation Interpretation Units
γN Neutrophil Removal Rate from Circulation days−1
Gprod Endogenous G-CSF production rate ng/mL/day
V Bound G-CSF conversion factor 10ng/mL9cells/kg
kren G-CSF renal elimination rate days−1
kint G-CSF effective internalisation rate days−1
k12 Unbound to bound G-CSF compartment ng/mLdays−1Pow
k21 Bound to unbound G-CSF compartment days
−1
ng/mLPow Pow Effective G-CSF binding coefficient
ϕratioN R ϕ max NR /ϕ ∗ NR G∗1 Free G-CSF ng/mL
GSCdat(t) Data SC G-CSF function ng/mL
GIVdat(t) Data IV G-CSF function ng/mL
GSC1 (t) Simulated SC G-CSF function ng/mL
GIV1 (t) Simulated IV G-CSF function ng/mL
χ0.95 Scaling factor
Ndat375(t) Data 375 µg neutrophil function 109cells/kg
Ndat750(t) Data 750 µg neutrophil function 109cells/kg
N375(t) Simulated 375 µg neutrophil function 109cells/kg
N750(t) Simulated 750 µg neutrophil function 109cells/kg
Nchj
dat(t) Data neutrophil function for chemo subject j 109cells/kg
Nchj(t) Simulated neutrophil function for chemo subject j 109cells/kg
Q∗ HSC homeostasis concentration 106cells/kg
β(Q∗) HSC re-entry rate days−1
N∗ Homeostasis Total Blood Neutrophil Pool 109cells/kg
NR∗ Homeostasis Neutrophil Reservoir Concentration 109cells/kg NP∗ Homeostasis Neutrophil Proliferation Concentration 109cells/kg NM∗ Homeostasis Neutrophil Maturation Concentration 109cells/kg
G∗2 Homeostasis bound G-CSF concentration ng/mL
Abbreviation Interpretation Units τN∗C Homoeostasis Neutrophil mean time in circulation days
τ1/2 Circulating Neutrophil half-removal time hours
A∗N Homeostasis neutrophil proliferation+maturation amplification − ˜b
V Scaled maturation half-effect concentration ng/mL
ϕratio
NR Ratio of maximal and homeostasis reservoir release rates −
ϕNR(0) Minimal reservoir release rate days
−1
θ Ratio of rate cells leave proliferation at knockout to homeostasis −
Cko Knockout total blood neutrophil pool fraction −
µ Ratio of minimal and homeostasis proliferation rates −
Vd Volume of distribution mL
F Bioavailable fraction −
ka Subcutaneous rate of absorption days−1
kf p Rate of exchange from compartment f to p days−1
ksl1p Rate of exchange from compartment sl1 to p days
−1
kpf Rate of exchange from compartment p to f days−1
kpsl1 Rate of exchange from compartment p to sl1 days
−1
kelC Rate of elimination days
−1
ksl2f Rate of exchange from compartment sl2 to f days
−1
kf sl2 Rate of exchange from compartment f to sl2 days
−1
BSA Body surface area m2
hQ Effect of chemotherapy on Q(t) −
EC50 Half-maximal effect of chemotherapy on ηNP −
sc Chemotherapy effect Hill coefficient −
ηinfN
P Rate of proliferation with an infinite chemotherapy dose days
I want to begin by thanking my co-directors, Dr Fahima Nekka and Dr Michael Mackey, for their encouragement and support during my doctoral studies. I have been enormously lucky to work closely with both Fahima and Michael. Their input has always guided me and my research and their personal dedication to me as a student and a person has and will always be very much appreciated. I look forward to many more fruitful collaborations together.
I am grateful to the members of my thesis jury for all of their comments and questions after reading my dissertation and at my defence. I have an immense amount of respect for all of their work, so I am particularly touched by their reflections. Thank you to Dr Piet van der Graaf, Dr Leon Glass, Dr Marc Servant, and Dr Yan Burrell.
I am fortunate enough to have collaborated with exceptional researchers who have also been influential to my doctoral path. Thank you very much to Dr Tony Humphries for all of our discussions and for his guidance, which amounted to having a third co-director who helped at each step of the way. Thank you to Dr Jacques B´elair for his assistance in not only my research work, but also in my teaching experiences at l’Universit´e de Montr´eal.
I would like to thank Dr Jun Li for all of his helpful suggestions and comments, and for all of our interesting conversations and debates. Thank you also to Dr Mario Gonz´alez-Sales for sharing his ideas with me and for our collaborations, and to Dr Joe Mahaffy for our ongoing collaborations together. I am grateful for the advice and guidance of Dr Nathalie Letarte and Dr David Dale who both provided very valuable insight about clinical issues related to my work. I am also very thankful to have worked with Dr St´ephanie Portet during my masters and to have her and Dr Jullien Arino’s continued guidance during my PhD.
Thank you to my colleagues at l’Universit´e de Montr´eal–Olivier, Leila, Sarem, Guil-laume, Xiao, Steven, Abbass, Sara–and at McGill University–Grace, Gabriel, Tyler, Daniel– for all of our time spent together working (and sometimes not working as much). I’ve really enjoyed sharing this time with you all.
I’m particularly indebted to all of the UdeM staff at the Facult´e de pharmacie and at la FESP for their support.
Of course, I owe so many thanks to my friends and family (and family who are friends and friends who are family) for every piece of advice, love, kindness, and support during my (long) time as a university student. My thesis is undoubtedly better because I had an outlet of support from them. To Rachel, Jenna, Haley, Braydon, Cam, Ty, Shoni, Sean, Stacey, Mike, Jenn, Krysta, Flo, Rebecca, Sumeep, Shannon, Leanne, Josh, Dave Paton, Laurena, Sylvie, Justin, Kameron, Jeff, Gwen, Ginny, Genna, Roberta, and Dave Landreth for every message, visit, and call. To all of the kids you guys have made who are cool people we get to visit. And to my family, near and far: Auntie Rhonda and Jayne, Uncle Paul and Carole, Deanna, Vanessa, and Ellis (for being here for my defence and also for hosting us on so many occasions in Toronto–having cousin friends is the best!), Sera, Shumit, Phoenix, and Cassis, Auntie Andrea and Uncle Brian, Josh and Kate, Auntie Donna and Uncle Tony, Jeni, Blake, Grant (and one who we haven’t met yet), Nick, Sid, and Eddy, Kirby, Cory (and Charlie!), and Auntie Barbie (for being like my other mom)– thank you for loving me my whole life and helping me get here. Thanks to our close family friends the Burketts (Gary, Cindy, Kyle, Kira, Brittany, and Darcy), les Collette (Pauline et Denis), Gio, the Carberrys (Uncle Tom, Auntie Fran, Jamie, Katie, Patrick, and Quinn) and the Loewens (Peter, Paulette, Alex, and Andrew).
I’m very fortunate to have a wonderful family of (common) in-laws who have welcomed me into their gigantic family. Thanks to Hannah and Tom, Isaac and Jana, Joel and Bobbi, Josiah and Quelly, Gersh and Kat, Levi and Cassandra, and our gaggle of nieces and nephews. Lots of love to Judie and Bob for their continued love and support.
None of my accomplishments would be possible without my parents, Richard and Pam, and my sister and brother in-law, Ashleigh and Isaac. And of course our precious nephews Noah, Xavier, and Sebastian. They gave me room to grow into whatever interested me and they allowed me to be whatever and whoever I wanted to be (within reason...) and I can never show them enough appreciation. I love our overly cautious and hilarious family. To my grandparents who are no longer with us, and especially for my Margaret who passed away during my PhD. I miss you very much and am glad I got to be your grand-daughter.
Lastly, thank you to Jesse, the man I am so lucky to spend my life with. I can’t say enough nice things about how I feel about you. Thanks for always sticking up for me and
for helping me with whatever (this thesis, my PhD, grabbing things from high shelves, bike repairs, and so much more). I look forward to many, many more adventures together.
This dissertation deals with the optimisation of the use of a cytokine which stimulates certain white blood cells after anti-cancer treatment. The motivation for this work was three-fold: from a clinical standpoint, the ad libitum administration of the exogenous form of this cytokine did not serve patients in the best way possible. Pharmacologi-cally speaking, the concurrent administration of drugs presents an interesting yet complex opportunity to understand drug-drug interactions. Finally, in terms of systems biology, mathematical modellers have long been intrigued by the dynamics of the blood system and the complexity of related structures. Bridging these three major perspectives required a wholly interdisciplinary approach and has motivated several important ancillary studies.
In what follows, I will begin by situating the biological foundations of the blood and neutrophil system, including the cytokine of interest and its clinical use to treat neutrophil pathologies. Next, I will situate the continuously evolving pharmacometrics field by an-choring its history to the background of models for neutrophil development.
The publications are presented in the following order:
— Craig M, Humphries AR, B´elair J, Li J, Nekka F, Mackey MC. Neutrophil dy-namics during concurrent chemotherapy and G-CSF administration: Mathematical modelling guides dose optimisation to minimise neutropenia. Journal of Theoretical Biology, 385, 77–89 (2015).
— Craig M, Gonz´alez-Sales M, Li J, Nekka F. Impact of Pharmacokinetic Variability on a Mechanistic Physiological Pharmacokinetic/Pharmacodynamic Model: A Case Study of Neutrophil Development, PM00104, and Filgrastim. In Interdisciplinary Mathematical Research and Applications (ed. B. Toni). Springer, New York. In press.
— Craig, M., Humphries, A.R., Mackey, M.C. A mathematical model of granulopoiesis incorporating the negative feedback dynamics and kinetics of G-CSF/neutrophil binding and internalisation. Under review (submitted to the Bulletin of
Mathemat-ical Biology December 21, 2015).
— Craig, M., Gonz´alez-Sales, M., Li, J., Nekka, F. Approaching pharmacometrics as a palaeontologist would: Recovering the links between drugs and the body through reconstruction. CPT: Pharmacometrics and Systems Pharmacology. In press.
Introduction
1.1 Neutrophil Bone Marrow Development from the Hematopoietic Stem Cells
This section provides an overview of the development of circulating neutrophils to the total blood neutrophil pool from the hematopoietic stem cells. The focus is primarily systems level physiology, although certain signalling mechanisms and fundamentals will be discussed.
1.1.1 Hematopoietic Stem Cells: Pluripotent Regulators of Hematopoiesis
History is littered with coincidental and peculiar developments. While the first portion of the last century saw a nuclear arms race take hold, the focus on building atomic weapons led to several important scientific advances, extending even to the life sciences. One such breakthrough is the identification of cells capable of clonal repopulation [28]. Stem cells were first discovered by Till and McCulloch [128] after injecting bone marrow into mice spleens and observing clonal nodules in the excised organs. This pioneering work led to many subsequent discoveries on the physiology of these pluripotent cells and the identifi-cation of the various stem cell types. One such variety are those which generate the cells in the blood. Hematopoietic stem cells (HSCs) give rise to cells of all blood cell lineages and regulate hematopoiesis (the production of blood cells). HSCs produce about ten times human body weight in blood cells per lifetime [81] yet they comprise just 0.01-0.2% of the total bone marrow mononuclear cells in human beings [96]. The current understanding of the production of these hematopoietic cells is highlighted in Figure1.1, although it should be noted that there exists several proposed models of hematopoiesis. Much remains un-known about the mechanisms instructing lineage potential [28] and the current paradigm of lineage determination has recently been called into question [95]. The HSC popula-tion is fairly stable and rarely divides [102], which is likely an evolutionary mechanism
HSC CMP CLP MEP GMP TNK BCP MKP PLT RBC EP MC Neu Eos T NK B
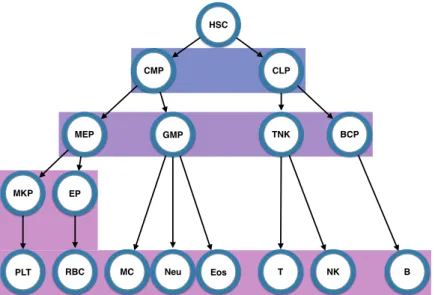
Figure 1.1 – In this classical model, the pluripotent hematopoietic stem cells give rise to the multitude of blood cells by first dividing into one of either of the primitive progenitor cells (common myeloid progenitors or common lymphoid progenitors). These primitive progenitor cells further differentiate into committed precursor cells (megakaryocyte ery-throid progenitors, granulocyte-macrophage progenitors, T-cell natural killer cell progeni-tors, and B-cell progenitors), each of which further differentiate into the lineage committed cells (megakaryocyte progenitors and platelets, erythroid progenitors and red blood cell-s/erythroids, monocytes, neutrophils, and eosinophils, T-cells, natural killer cells, and B-cells). HSC: hematopoietic stem cell; CMP: common myeloid progenitor; CLP: com-mon lymphoid progenitor; MEP: megakaryocyte erythroid progenitor; GMP: granulocyte-macrophage progenitor; TNK: T-cell natural killer cell progenitor; BCP: B-cell progenitor; MKP: megakaryocyte progenitor; EP: erythroid progenitor; PLT: platelet; RBC: red blood cell/erythroid; MC: monocyte; Neu: neutrophil; Eos: eosinophil; T: T-cell; NK: natural killer cell; B: B-cell. Background colours indicate the level of differentiation. Blue: prim-itive progenitor cells; purple: committed precursor cells; pink: lineage committed cells. Schematic adapted from [103].
as instabilities in the HSC population can lead to a variety of hematopoietic pathologies, including the class of cyclical blood disorders [16, 21,35]. Recent studies [27, 28, 95, 102] have put forward different mechanisms for the division of HSCs and the maintenance of their populations which include the classical model and the model of asymmetrical divi-sion. In the classical model, hierarchical differentiation leads to lineage commitment of multipotent progenitors (MPPs) that will become mature, circulating blood cells. This classical model, first constructed using the blood system as a basis, has subsequently been proposed as a model for the structure of other stem cell populations [141]. Others maintain
that the HSCs are capable of asymmetrical division where, after division, one daughter cell remains an HSC while the other is committed to one of the hematopoietic lineages [102]. This self-renewal process would maintain a near constant HSC population and would ac-count for the apparent robustness of HSC numbers. Further propositions include the idea that there are two reservoirs of HSCs: dormant and homeostatic [27]. In this hypothesis, the homeostatic HSCs divide about once a month and maintain the homeostatic concen-trations of blood cells whereas the dormant population (which divide once every 145 days or so) would be called upon in times of emergency or stress. Durand and Charbord [27] posit, contrary to the asymmetrical model of HSC division, that homeostatic HSCs likely perform symmetric division but their fate is primarily determined asymmetrically.
The differing opinions on various aspect of HSC physiology are directly attributable to the difficulty we have in studying them. The direct identification of an HSC is complicated. Consequently, indirect measures are instead employed [81]. The identification and purifi-cation of HSCs relies on the up- or down-regulation of the expression of certain proteins on the cell’s surface. HSCs belong to the class of long-term repopulating cells (LTRCs) and can therefore be detected in assays for LTRCs [28]. Two main methods are employed for this identification: the competitive repopulating unit (CRU) assay, which is employed in vivo, and the in vitro long-term culture-initiating cell or cobblestone area-forming cell assay. In the former case, cells from another source are supplied and CRU frequencies are measured after transplantation. In the latter method, adult bone marrow cells are cultured in presence of steroids and are then quantified using limited dilution assays [28]. Although much remains unsettled in terms of HSC biology and physiology, what we do understand has led to extraordinary advances in both basic science and medicine. HSCs have an undeniable potential given their importance in transplantations, hematological disorders, and gene therapy [81]. More broadly, the entire hematopoietic system is ideally situated for study by mathematical modelling not only because of what remains to be discovered about the HSC population and cellular particularities, but also as a result of the system in which they operate: a refined complex regulated by a variety of cytokines (cell signalling proteins) which work to maintain blood health for a lifetime. Next, we focus one important hematopoietic lineage predominately regulated by one particular cytokine.
1.1.2 Neutrophil Development and Biology
After commitment into the myeloid lineage, HSCs begin the process of becoming one of a number of terminally differentiated cells. One such blood cell is a neutrophil, the most abundant white blood cell in the body [134]. The neutrophils are implicated as first-line defenders in immune response and are therefore crucial to mammalian health. The development of neutrophils occurs only in the bone marrow, where they proliferate and mature in a process known as granulopoiesis [15]. As previously mentioned, the differentiation of HSCs into the various hematopoietic lineages is not fully elucidated. It is currently hypothesised that various signals, including HoxB4, Ikaros, the activated nuclear form of Notch1, cell cycle inhibitor P21, TGF/BMP-4 family members, TNFalpha receptor P55 signalling [144], PU.1, CCAAT enhancer binding protein (C/EBP)α, C/EBPε, and GFI-1 [15] all play a role in HSC self-regulation, while the various colony-stimulating factors (CSFs) and interleukins (ILs) mediate and instruct lineage commitment [144]. There is also likely a stochastic element to the differentiation of HSCs [122].
In the current understanding of hematopoietic blood cell production, HSCs initially differentiate into multipotent progenitors (MPPs) before branching off into two distinct progenitor types: common myeloid progenitors (CMPs) and common lymphoid progeni-tors (CLPs). The CLPs eventually lead to lymphoid cells that are primarily constituted by B-cells and T-cells, but also contain natural killer cells. CMPs will eventually form platelets, red blood cells, neutrophils, monocytes, eosinophils, basophils, and mast cells. Dendritic cells have origins in both the CMPs and the CLPs [60]. The formation of neutrophils from the CMP niche involves several transitional steps. First, CMPs differ-entiate into myeloblasts which are the common progenitor of all granulocytes (basophils, eosinophils, and neutrophils) and monocytes. The next transition involves the terminal differentiation into the neutrophil lineage. Myeloblasts become promyelocytes, myelocytes, metamyelocytes, and band neutrophils before they proliferate and mature into neutrophils (see Figure 1.1 in [78] and Figure 2 in [76]) [123]. These mature neutrophils are initially stored in the bone marrow prior to their release into the circulation [101].
Circulating neutrophils have a short half-life of approximately 7-10 hours [134] before their disappearance from the blood. A confounding factor in the reporting of neutrophil half-life is the significance of the marginated neutrophil pool (MNP). Athens [3], studying
70 male subjects from the Utah State Prison, reported the total blood granulocyte pool (TBGP) to have a mean of 65×107 cells/kg, while the circulating granulocyte pool (CGP) had a mean of 31.7×10⁷ cells/kg, leaving a marginal granulocyte pool of 33.3×10⁷ cell-s/kg. The MNP exists in several tissues and organs in addition to the capillaries. During neutrophil reinfusion, one-third of reintroduced cells were found in the liver and the bone marrow while approximately 15% migrated to the spleen. It is further known that the lungs harbour a significant amount of the TBNP. Higher rates of neutrophil margination in different ethnicities may explain why some ethnicities and races exhibit curiously low neutrophil counts while demonstrating no ill effects for the individual [134]. Further, the division between the circulating and marginated pools is in constant flux. Exercise and the release/administration of adrenaline tends to shift the size of the MGP to the CGP, which is likely a protective measure [3]. The transfer of neutrophils from the blood to the tissues/marginated pool is mediated by both integrins (receptors responsible for the cross-talk between cells and a cell to the extra cellular matrix) and selectins (cell adhesion molecules) [134].
After margination, neutrophil clearance is carried out by both the spleen and the liver, though some suggest that neutrophils which have trafficked back into bone marrow may be cleared from there [77, 101,108, 127]. More recently, researchers have observed that there are very few neutrophils which complete this migration back into the marrow. However, others report that it appears that this trafficking contributes to 32% of neutrophil clear-ance, while the liver and the spleen contribute to 29% and 31% of clearclear-ance, respectively [1, 101]. Neutrophil removal is accomplished by the macrophages at the various sites of clearance [101] during which they release IL-23, setting off a cascade of cytokine secre-tion from IL-17 in the T cells thereby inducing increasing concentrasecre-tions of granulocyte colony-stimulating factor (G-CSF) [134]. G-CSF is the cytokine which predominates in the homeostatic regulation of neutrophil production and its role and specificities will be discussed in Section 1.3 below.
1.2 Neutrophil Pathologies
As the neutrophils are implicated in immune responses, low absolute neutrophil counts (ANCs) contribute to an increased likelihood of acquiring infections. The most common
neutrophil disorder is neutropenia, or a lack of neutrophils in the blood. Due to individual fluctuations in neutrophil counts (anywhere from daily [56] to monthly [3]) small dips below baseline are not necessarily a cause for concern. For this reason, neutropenia is typically graded, where grade 1 corresponds to ANCs between 1.5 and 2 ×10⁹ cells/L, grade 2, or mild, to ANCs between 1 and 1.5 ×10⁹ cells/L, grade 3, or moderate, to ANCs between 0.5 and 1 ×10⁹ cells/L, and grade 4 (severe) to ANCs less than 0.5 ×10⁹ cells/L, though these ranges vary with age and race [68]. Neutropenia can be classified as acute (where the disorder is brought upon by an outside source whose removal restores ANCs) or as chronic, and chronic neutropenia is further subdivided into congenital, syndrome-associated, antibody-mediated, or idiopathic disorders [68].
Within the congenital disorders is severe chronic neutropenia, which itself encompasses two notable pathologies, namely cyclical neutropenia (CN) and severe congenital neutrope-nia (SCN). Cyclical neutropeneutrope-nia is a rare disease with an incidence of about one in one million where neutrophil counts oscillate with a period of 21 days, though some patients exhibit oscillations of over 40 days [21]. CN is a lifelong disease brought about by muta-tions on the neutrophil elastase (or ELANE) gene [21] which carries a high risk of infection during the times when neutrophil numbers are low (and vice versa) [68]. CN has been fairly extensively analysed by means of mathematical models (see [21] for an extensive review) because of the existence of an animal model which has presented a great potential for study. As with patients with CN, grey collies also exhibit oscillations in their neutrophil counts, although with a period of seven to 11 days [16]. This mathematical modelling of CN has been valuable. For example, the identification of the ELANE mutation by molecu-lar biologists was reinforced by the modelling prediction that a disruption in the apoptosis of neutrophil progenitors caused the cycling [21]. Recently, there has been an increased focus on aiding the clinical prediction of CN. Dale’s group at the University of Washington has submitted to the Food and Drug Administration (FDA) of the United States for the approval of an at-home blood sampling kit. This would aid in the diagnosis of CN by allowing patients to easily monitor their neutrophil counts, something which would also make rich data available to researchers [21]. Concurrently, the launch of an informal online prediction tool has made Lomb-Scargle periodogram analysis available to practitioners so they may more easily detect oscillations in suspected CN cases (visit theCyclic
neutrope-nia websiteat http://cyclicneutropenia.org). Due to the oscillatory nature of the disorder, patients with CN may experience neutrophilia (high ANCs) whereas patients with SCN experience chronically low neutrophil counts, leaving them exposed to life threatening in-fections [68]. SCN is equally if not more rare than CN (affecting approximately 0.5 in a million) and patients with the disorder are more likely to develop acute myelogenous leukaemia or myelodysplasias. Some patients have been found to carry mutations on their G-CSF receptors, leaving them with a reduced or even no response to treatment with ex-ogenous G-CSF [68,136] (discussed further in Section1.5.1). Researchers at the University of Washington established and maintain an international registry to track those affected by SCN and to keep a record of their prescribed treatments and outcomes (visit theSevere Chronic Neutropenia International Registry at https://depts.washington.edu/registry/).
Both CN and SCN are identified as rare diseases but neutropenia on the whole is not an uncommon condition since iatrogenic causes of neutropenia contribute significantly to the prevalence of the disorder. One such significant cause of acute neutropenia is brought about by myelosuppressive drugs such as those used in anti-cancer treatments. As will be discussed in Section1.6.1, chemotherapeutic drugs work by disrupting cellular division to quell the uncontrolled growth of cancerous cells. Unfortunately this disruption affects cells which are particularly short-lived, such as the neutrophils, due to their continuous production in the bone marrow (approximately 1 billion neutrophils per kilogram of body weight are released into and disappear from the blood every day) [19, 90]. Patients un-dergoing anti-cancer treatment are particularly prone to febrile neutropenia (neutropenia with fevers), which leave them open to infection during an already challenging period [91]. In both the pathological or healthy case, the control of neutrophil production and blood counts is assured through a host of chemical signals of which G-CSF is the principle actor.
1.3 Regulation of Neutrophils by G-CSF
The blood system is regulated by a diverse set of cytokines (cell signalling proteins) whose role is to control and balance cell numbers in the blood. A broad set of sig-nalling molecules are involved in regulating neutrophils counts, including IL-3, granulocyte-macrophage colony stimulating factor (GM-CSF), and IL-6, though none of these have proven to be the main drivers of granulopoiesis. In fact no defects in granulocytes were
observed when IL-3, GM-CSF, or IL-6 receptors were knocked out in mice [15]. Contrary to these results, in G-CSF(-/-) mice, only 20-30% of normal neutrophil counts are present and the mobilisation of neutrophils from the marrow into the circulation is impaired [72]. Absolute neutropenia in humans has also been observed with deficiencies in G-CSFRs, as is the case of an infant born with no neutrophils. She experienced SCN and was unrespon-sive to treatment with G-CSF due to a point mutation on the extracellular domain of the GCSFR [136]. These results suggest that G-CSF is indispensable for neutrophil regulation and it is considered the primary cytokine driving granulopoiesis [101].
Colony-stimulating factors were initially discovered in the 1960s. The first purification of human G-CSF occurred in 1983/1984 following its initial purification from mice in 1983 [90]. What would become the common recombinant human (rh) form of G-CSF was successfully expressed in Escherichia coli in 1986 [137]. Today, E. coli bacteria are still used to generate rhG-CSF for clinical uses.
Structurally, the G-CSF gene is a 174-amino acid protein with a molecular weight of 19,6 kDa and encodes a 204-amino acid protein structure (a signalling sequence at the end of the molecule accounts for the difference in the number of amino acids). Among mammals, a 99% similarity in G-CSF protein structures has been observed and humans share a 74% and a 65% similarity with the G-CSF structure of mice and rats, respectively [2]. G-CSF is formed by four alpha-helices, as shown in Figure 3 of Arvedson et al. [2] and is a part of the long-chain subfamily which includes proteins having an average length of 260 amino acids with helices 20 to 30 residues long [2].
The GCSFR binds to G-CSF with a primarily 2:2 stoichiometry [2,69] although certain groups have reportedly been able to produce a 1:1 binding in laboratory conditions [69]. The current understanding of G-CSF/GCSFR interactions was visualised in Figure 5 of Layton et al. [69].
The action of G-CSF on the neutrophils occurs in several ways to modulate the con-centration of neutrophils in the blood. G-CSF is a potent regulator of both neutrophil production (by various means) and of the release of neutrophils from the marrow into cir-culation [5,101] but it does not seem to affect the clearance or removal of neutrophils [15]. The most immediate effect of an increase in G-CSF concentrations is emergency granu-lopoiesis, or the rapid mobilisation of neutrophils into the blood [39, 101]. During such
inflammatory events, the neutrophil transit from the marrow seems to also be mediated by IL-17, though the same is not true for the maintenance of homeostasis [101]. After the release of cells from the marrow reservoir, G-CSF acts upstream on proliferating and maturing cells to ensure the replenishment of the reserve by increasing cell proliferation, decreasing the speed of transit from the marrow, and ensuring the differentiation and mat-uration of neutrophils [78]. To wit, it has been demonstrated that neutrophil precursors are subject to higher rates of apoptosis (programmed cell death) in the absence of G-CSF [90].
The major impetus for G-CSF action on the neutrophils is binding to GCSFRs on the surface of the cells, whereby G-CSF is subsequently cleared from the blood. After saturation of this mechanism, G-CSF is cleared by the kidneys [78, 90]. This dual elimi-nation route is an important mechanism of the pharmacokinetics and pharmacodynamics (PK/PD) of G-CSF and it has a notable effect on the half-life (t1/2) of G-CSF in the blood, as G-CSF has a half-life of around 4.7 hours without neutrophils available for binding but just 2 hours when neutrophils are available [90]. In a simple model, this combination of nonlinear, saturable elimination with a linear clearance route (as is common for several types of small molecules, including ethanol and erythropoietin) also affects the volume of distribution, a theoretical amount relating the volume of occupancy of a drug in the body [139,140]. Further, the two routes of elimination are relevant to the PKs of exogenous G-CSF administrations since the clearance of the drug will be increased as neutrophil counts rise, which requires multiple and repeated administration to combat this effect [90].
1.4 The Use of G-CSF in a Clinical Setting
After the replication of G-CSF in E. coli, the first rhG-CSF preparation began clinical trials in 1991, and a second derivative from hamster ovary was approved in 1993. rhG-CSF is available in various forms, including the most common forms known as filgrastim (NEUPOGEN®), lenograstim (Granocyte®), and KW-2228 (Nartograstim®) [90]. All three of these forms are biosimilar to the native G-CSF molecule, albeit with the addi-tion/deletion of an N-terminal methionine and an O-linked carbohydrate on threonine (fil-grastim), and an allowance for radioactive labelling (KW-2228) [90]. An additional form of rhG-CSF, known as pegfilgrastim (Neulasta®), which is formed by adding a polyethylene
glycol moiety to the N-terminal methionine of filgrastim, bypasses the linear elimination from the kidneys due to its increased size. As a result, although the molecule has a sim-ilar PD action as filgrastim from the binding to neutrophil receptors, it has a markedly increased exposure from the altered PKs.
The use of rhG-CSF in clinical practice has been approved for several applications. As alluded to in Section1.2, the most significant use of G-CSF mimetics is for the treatment of neutropenia of various origins. A brief outline of the use of rhG-CSF in non-oncological settings follows, before addressing its administration in cancer treatment.
1.5 Non-oncological Treatment with rhG-CSF 1.5.1 Severe Congenital Neutropenia
One of the major successes of treatment with rhG-CSF has been for patients affected by SCN. Since these individuals have a mutation on the ELANE gene, they experience higher than normal rates of apoptosis in the early proliferating neutrophil progenitors [21]. Accordingly, as G-CSF is known to increase proliferation rates, rhG-CSF is administered daily to increase neutrophil counts [20]. Treatment of SCN with rhG-CSF has proven not entirely straightforward, however, as phase II clinical trials showed a high variability in the required effective dose and the time to the onset of treatment efficacy. Regardless, fairly immediate results of the treatment were observed in the reduction of the number of infections experienced by the participants [20].
1.5.2 Cyclical Neutropenia
One of the first clinical trials after the purification of rhG-CSF was for the treatment of CN by IV administration, which was quickly changed to subcutaneous administration after it was found to be equally as efficacious [20]. The treatment of CN with rhG-CSF has proven to be an effective means of controlling the disease, using daily or once-every-other-day administrations [22]. Those affected by CN undergoing treatment with rhG-CSF experience fewer periods of severe neutropenia and no longer experience the mouth ulcers, fevers, and serious infections related to the disorder [20]. Indeed, one patient has been treated nearly daily for 20 years with exogenous G-CSF and has experienced virtually no
significant side effects [21]. Despite these encouraging results, treatment with rhG-CSF has not been shown to eliminate neutropenic cycling all together [22], though it has been demonstrated to shorten the length of the cycling [21]. Mathematical modelling has been used to address this curiosity by studying the timing of G-CSF administrations for patients with CN [16, 21, 35]. The authors of one such study demonstrated that alternate-day administration of rhG-CSF was as effective as daily treatment [35], though this assertion has yet to be borne out in a clinical setting [21].
1.5.3 Stem Cell Transplantation
Myeloid growth factors, including rhG-CSF, are used during stem cell transplantation in two notable ways. The first is to increase the mobilisation of the peripheral blood progenitor cells (PBPCs) for stem cell collection, while they are also administered during autologous stem cell transplantation (removal, storage, and reinjection of one’s own stem cells) to combat neutropenia during the procedure [22, 107]. When rhG-CSF is given repeatedly prior to autologous stem cell transplantation, PBPCs numbers are increased and there is improved neutrophil recovery and marrow engraftment [22].
1.5.4 Further Applications and Investigational Studies
Supplementary uses of rhG-CSF within hematological disorders include the treatment of Shwachman-Diamond Syndrome (mutations on the Shwachman-Blackfan-Diamond gene which disrupt cellular proliferation), acquired neutropenic disorders, including neona-tal immune and autoimmune neutropenia (disruption of maternal antibodies leading to changes in antigen expression in infants), and chronic idiopathic neutropenia (benign neu-tropenia of childhood) [21,90]. Although the mechanisms with which treatment with rhG-CSF improves outcomes for these disorders are not known, they are generally attributed to the pro-proliferative effects of the G-CSF [21]. Outside the scope of purely hemato-logical pathologies, rhG-CSF is used to treat neutropenia in inflammatory diseases like rheumatoid arthritis and acquired large granular lymphocyte syndrome. Unfortunately in these instances, a common side effect of the treatment of neutropenia with rhG-CSF is an increase or worsening in arthritic pain. rhG-CSF is also used to effectively treat glyco-gen storage disease type 1b, a disorder affecting the cellular trafficking of glucose across
the membrane, certain infectious diseases (including bacterial pneumonia and meningitis, and sepsis) [73], and has been investigated for use after stroke, myocardial infarctions, peripheral vascular disease, liver disease, traumatic nerve damage, among others [90].
A major use of rhG-CSF beyond its application in treating hematological disorders is for the treatment of human immunodeficiency virus (HIV). With the advent of combina-tion antiretroviral treatment (ARV), the prognosis of those affected by HIV has steadily improved [51,124] implying there is a greater need to manage the now lifelong comorbidi-ties associated with the infection. Early in the HIV/acquired immunodeficiency syndrome (AIDS) epidemic, neutropenic infections were identified as a critical concern for the care of patients whose HIV had progressed to AIDS [51]. Though recent progress in the man-agement of HIV has markedly increased life expectancies for those with HIV, neutropenia remains present within the patient community due to ART resistance and non-compliance [51, 124]. Beyond the decreased number of circulating neutrophils associated with HIV, it is also known that the infection (and other viral infections) causes defects on the neu-trophils themselves which affect their ability to perform chemotaxis, phagocytosis, the respiratory or oxidative burst, and their microbicidal capacity [51]. Neutropenia in pa-tients with HIV is an ongoing concern due to the increased risk of bacterial infections and invasive aspergillosis for those with hematological malignancies [51]. Treatment with filgrastim during HIV has been shown to induce a 56% reduction in mortality in a ret-rospective study [24]. Regrettably, treatment with filgrastim during HIV infection has been known to cause disseminated intravascular coagulation, hepatitis, and pancreatitis in addition to the usual bone pain, fever, and other symptoms typically experienced by patients without HIV [51]. Ultimately, since the majority of HIV-affected individuals live in the developing world (some 23.5 million people out of the 34 million globally infected in Sub-Saharan Africa alone [130]), the most significant drawback to rhG-CSF treatment for HIV patients is drug costs [51], a concern echoed in other clinical settings.
1.6 Oncological Settings: Treating Cancer with Chemotherapy
Cancer, in its various presentations, is a public health concern across the globe. In Canada, the Canadian Cancer Society (CCS) estimates that 42% of women and 45% of men will face a cancer diagnosis during their lifetime [13]. In 2012, the number of new
incidences of cancer in Canada rose to 175 310 [12], while that number is estimated to reach 196 900 in 2015 [13]. A slim (51%) majority of these new cases are lung, breast, colorectal, and prostate cancers, though there are some 100 different types of cancer known to affect humans [13]. Cancer is a broad class of cellular growth disorders, where cells undergo increased division and unmitigated growth due to a disruption in the cell cycle [85]. This cycle is generally represented as four distinct phases: G1, S, G2, and M, however Burns
and Tannock [10] wrote of the existence of the G0 phase (a quiescent, resting phase, or extended G1 phase) in 1970. Cells exiting the G0 phase committed to divide will enter G1
and the precursory mechanisms of cell division are commenced. Next, the cell enters the S phase, or DNA synthesis phase. Here, signals within the cell control the copying of the DNA inside the nucleus and 4N or tetraploid content is produced. Next, the cell rests in the G2 phase before entering the mitotic M phase where cellular division occurs [85]. The
mitotic phase comprises the separation of the cell’s chromosomes, the cleavage of the cell by the microtubules, and the production of two daughter cells. Cancer/tumour kinetics disrupt this usually well-performed process in three important ways:
1. the time of the cell cycle is disrupted (cells divide faster), 2. the fraction of cells undergoing cellular division is increased, 3. the total number of cancerous cells increases.
These three factors determine the growth rate of cancerous tumours [85]. To address the overall uncontrolled growth of cancer cells, anti-cancer treatment in the form of ra-diotherapy or chemotherapy (or a combination thereof) is administered with the goal of disrupting this rapid cellular division. Herein, we focus on chemotherapeutic options.
1.6.1 Chemotherapy: Mechanism of Action and Hematological Toxicities Current anti-cancer treatment with chemotherapy focuses on combination therapy, which aims to maximise the cellular killing effects of each drug while minimising their toxicities [85]. Chemotherapeutic drugs fall into several classes, among them alkylating agents, nitrosoureas, platinum agents, antimetabolites, antitumour antibiotics, anthracyclines, epipodophyllotoxins, vinca alkaloids, taxanes, and camptothecin analogs [86], all of which disrupt cellular division through various mechanisms of action.
The two most general means by which chemotherapeutic agents disrupt the uncontrolled growth of cells is by disturbing DNA synthesis (during the S phase) and by interfering with microtubule elongation and contraction, which leads to the inability of the cell to properly cleave. The former action is performed by drugs in the alkylating agents, nitrosoureas, platinum agents, antimetabolites, antitumour antibiotics, anthracyclines, epipodophyllo-toxins, and camptothecin analogs classes. Vinca alkaloids and taxanes perform the latter action, although they disrupt the assembly of microtubules in opposite ways. Vinca alka-loids inhibit assembly by binding to the tubulin which forms the subunits of microtubules. Taxanes, an important class of anti-cancer drugs which include paclitaxel and docetaxel, induce microtubule polymerisation and result in increased cellular apoptosis.
Unfortunately, the nature of the cell-killing mechanism of chemotherapeutic agents and their efficacy in vivo lead to cytotoxic secondary effects which limit their use [34, 79]. Of particular concern is the myelosuppressive action of chemotherapy and the induction of acute neutropenia in patients receiving treatment. To account for the somewhat rapid disappearance of the circulating neutrophils due to their half-life of around 7 hours, the neutrophil precursors in the bone marrow must be steadily dividing to replenish blood neutrophil counts and so these latter cells undergo fairly rapid division. Consequently, during anti-cancer treatment, circulating neutrophil numbers can become significantly re-duced, leading to either dose adaptation or complete cessation of treatment [106]. Further, febrile neutropenia from the chemotherapy’s cytotoxicity leaves the patient susceptible to infections, which increases the risk for hospitalisation and complications from morbidi-ties. Moreover, modern chemotherapy combinations are administered in periodic cycles, which is believed to progressively reduce the number of cancerous cells. However, this periodic administration worsens the myelosuppression due to the repeated exposure of the neutrophils to the cytotoxic drug. Accordingly, ANC counts and the response of the hematopoietic system to chemotherapy are often used as surrogates for the successfulness of the treatment [21].
1.7 The Use of rhG-CSF to Mitigate Myelosuppressive Chemotherapy
To address the onset of neutropenia in patients receiving chemotherapy, rhG-CSF is administered concurrently, frequently prophylactically. In 1991, the FDA approved the


![Figure 2.2 – Model predictions (pink) compared to CHOP14 protocol described in [31, 32]](https://thumb-eu.123doks.com/thumbv2/123doknet/11306754.281744/105.918.164.753.471.799/figure-model-predictions-pink-compared-chop-protocol-described.webp)