HAL Id: hal-03204401
https://hal-mines-albi.archives-ouvertes.fr/hal-03204401
Submitted on 21 Apr 2021
HAL is a multi-disciplinary open access
archive for the deposit and dissemination of
sci-entific research documents, whether they are
pub-lished or not. The documents may come from
teaching and research institutions in France or
abroad, or from public or private research centers.
L’archive ouverte pluridisciplinaire HAL, est
destinée au dépôt et à la diffusion de documents
scientifiques de niveau recherche, publiés ou non,
émanant des établissements d’enseignement et de
recherche français ou étrangers, des laboratoires
publics ou privés.
Using Virtual Reality to Facilitate Common Operational
Pictures Representation
Aurélie Conges, Peipei Yang, Frederick Benaben, Jacob Graham
To cite this version:
Aurélie Conges, Peipei Yang, Frederick Benaben, Jacob Graham. Using Virtual Reality to Facilitate
Common Operational Pictures Representation. VRW 2021 - IEEE Conference on Virtual Reality
and 3D User Interfaces Abstracts and Workshops, Mar 2021, Online, United States. pp.336-341,
�10.1109/VRW52623.2021.00067�. �hal-03204401�
Using Virtual Reality to Facilitate Common Operational Pictures´
Representation
Aur ´elie CONGES
*IMT Mines Albi
Peipei YANG
†Universit ´e de Bordeaux
Frederick BENABEN
‡IMT Mines Albi
Col. Jacob GRAHAM
§The Pennsylvania State University
ABSTRACT
During crisis, different organizations are involved, each with their jargon and communication devices. Information about the situation is needed by all and it is vital to be able to share the data. To central-ize that data, Common Operational Pictures are implemented, but they do not remove the risk of information overload. We propose to use virtual reality to create a virtual environment improving COP rep-resentations, thus improving situational awareness and collaborative decision making.
Keywords: Virtual reality, visualization, common operational picture, cooperation.
Index Terms: Human-centered computing—Human computer interaction (HCI)—Interaction paradigms—Virtual reality; Human-centered computing—Visualization—Visualization systems and tools—Visualization toolkits
1 INTRODUCTION
In an emergency situation, shared and accurate awareness of the situ-ation is crucial for the decision-makers to make the best decisions to solve the crisis. Here, by crisis, we refer to military or civilian crises, from battlefields to industries, from floods or fires to terrorist attacks. The emergency response to a crisis situation generally involves sev-eral organizations such as a fire department, medical services, the police, or the military. Each of those organizations has a chain of command, and needs information to make the appropriate decision regarding the situation. That information may be relevant to several organizations, but it may not be available to all, depending on their location during the crisis. It is then crucial for all organizations to be able to share the information to effectively respond to a disas-ter [13]. This information sharing, communication, and coordination between organizations are not easy and often limited [3, 18]. To overcome those problems, Common Operational Pictures (COP) are implemented during a crisis. A COP is “a single identical display of relevant information shared by more than one command that fa-cilitates collaborative planning and assists all echelons to achieve situational awareness” [1]. The term “common” means that it is for everyone involved, from the highest decision-maker to the imple-menter. “Operational” refers to the actual status and development on the crisis site, preferably in real-time, and is opposed to the broader strategic level. And “picture” refers to a unique, visual, and graphi-cal representation of the environment, actors, and actions. They are a display method allowing on-scene and off-scene actors to access and be able to understand and treat the same information about the crisis to achieve situational awareness [20]. A COP is “established and maintained by the gathering, collating, synthesizing, and disseminat-ing of incident information to all appropriate parties involved” [9].
*e-mail: [email protected] †e-mail: [email protected] ‡e-mail: [email protected] §e-mail: [email protected]
In the context of emergency management, where more than one organization is involved, building a common operational picture “is essential for clear communication and coordination of actions among emergency response organizations” [4].
COP are often displayed as geographical representations, using Geographic Information Systems (GIS), and emergency manage-ment services often use separate GIS interface and communicate only through verbal communication tools [19]. Those representa-tions might induce difficulties for the data analysis, particularly in a large scale crisis with a huge amount of gathered data. “The COP needs to be more than a handy geospatial picture. The COP must depict not only what is ongoing currently but also depict those things that facilitate situational awareness over a longer term (readiness, lo-gistics, future availabilities, etc.)” [5]. Besides the geographical data, representing the crisis sites and the actors´ positions, a COP needs to show data less easy to represent, such as the available resources, the possible consequences of decisions, or any information that could influence the decision-making process, and all of that data must be always up to date. A challenge arises with this information sharing. During a crisis, a huge quantity of data can be gathered, but not all of it concerns each involved actor. Thus, there is a risk of information overload that must be taken into account: the information must be available to the relevant organization, and must not distract actors that do not need it [10]. This implies the need for a visualization tool that allows the representation of a lot of data, intended for different organizations, in a clear and relevant way.
To sum up, to be as efficient as possible, COP need to overcome the following challenges:
• Display a huge amount of data in a readable and easily under-standable way, to decision-makers from different organization • Display geolocated data, and more abstract data such as
re-sources, consequences or logistics • Display updated data, in real-time
Immersive Analytics is “the use of engaging, embodied analysis tools to support data understanding and decision making” [7]. With Virtual Reality (VR), it offers new means of visualization that aims at removing “barriers between people, their data, and the tools they use for analysis by developing more engaging, embodied analysis tools that support data understanding and decision making everywhere and by everyone, either working individually or collaboratively” [7]. These technologies allow the users to immerse themselves in the data and viscerally understand them, for instance by extending the range of their stimulated senses. VR is a great learning tool that allows a customized and challenging environment [12], and training in VR is increasingly common, whether in the military, medical, or crisis management field [15]. However, it seems that this technology is still confined to the training grounds, and is not yet allowed on the “real” crisis response. As we said, COP mostly consist of paper maps or 2D GIS, which are often heterogeneous and not interoperable. Boards on the walls and pins or post-its complete the set up in crisis cells. These tools are definitely not optimal for sharing and visualizing complex and critical data. We believe that introducing VR to COP could improve that data sharing and visualization, making it smoother,
more efficient, and more distributed, which would result in a better situational awareness for crisis managers, thus improving decision-making and crisis management. This article presents our proposal for a Common Operational Picture displayed in Virtual Reality. After presenting the background for this proposal, we will describe how VR can improve what is already done, and then how VR can provide new functionalities that will further upgrade crisis management. In the perspectives’ part, we link our VR COP with a decision-support software and present our future work.
2 BACKGROUND
2.1 Virtual Reality for data visualization
Virtual reality offers the freedom to intuitively explore and inter-act with an environment. Users can adopt different points of view, observe objects from different angles, and evolve among them. Ac-cording to [8], an “immersive environment engage the user to interact with the data”, which induces an immersion that “provides valuable intuition of data with complex geometries”. The idea is to extend the range of solicited sensory channels and to involve more than just the user’s vision. The user is no longer just watching the data from an external point of view: as explained in [17], with Immersive Analytics and VR, the idea is to be surrounded by data that can be touched, heard, or even smelled. The user can move around the data, approaching it from a variety of points of view, using forces and gestures to interact with it. This would allow more natural interfaces, matching the usual movements of our bodies. Immersive data offer “opportunities to display substantial quantity of data, and use human metaphors such as front and back (where interesting aspects are in front of us, with those items of less interest pushed behind us)” [17]. Immersion leads to “a demonstrably better perception of datascape geometry, more intuitive data understanding and a better retention of the perceived relationships in the data” [6], and “immersive en-vironments can be exploited to more efficiently extract information from [large amounts of high-dimensional data]” [8].
Collaboration can also be enhanced thanks to VR. Immersive visualization and virtual reality “can provide an easy and natural path to a collaborative data visualization and exploration, where scientists can interact with their data and their colleagues in the same visual space” [6]. One of the advantages of virtual environments is that they could bring together people that are not in the same location, allowing them to work together, surrounded by the shared data. In the context of emergency management and Common Operational Pictures, this could mean that off-site and on-site commanders and decision-makers from several organizations could meet in a virtual environment, sharing a common crisis representation, to decide together how to deal with the situation.
2.2 Virtual Reality for Graphical Information System and Common Operational Picture
We couldn’t find many examples of VR COP outside of Sci-Fi movies where they are much more common, from “Minority Report” to “Avatar” or “Iron Man 3”. However, VR GIS are more common. Among the advantages of using VR to display 3D GIS, one can cite better visualization of the geographical data and an improvement of the associated decision-making, and new ways of interacting with GIS databases. Being able to observe a map in 3D, from several points of view, exo-centered or ego-centered, offers a better understanding of our environment. This, linked with relevant data sharing between several organizations or several levels of command during a crisis, would be very helpful for situational awareness and decision support.
In [11], the authors present a project called “Virtual reality devices in ground forces tactical command and control system”, accepted by the Defense Department of Czech Republic. The idea is to use 3D visualization of the terrain and virtual reality to increase commander situational awareness, at a tactical and operational level. To do so,
they replaced a 2D map representing data from the battlefield with a 3D representation, accessible through head-mounted displays and VR. The result is a better view and a better understanding of the situation, which can now be explored from the inside, in 3D, and support of the decision-making process of the commanders. This 3D visualization and the possibility of exploring the scene from the inside are really interesting, as it offers to the decision-makers an internal but still safe point of view that is not usual in an emergency situation.
Besides the military domain, we found an example of using VR to improve COP in the Cybersecurity domain [14]. The authors propose a 3D cyber virtual environment for collaborative cybersecurity inves-tigations and reporting practices. In this virtual environment, users have specific roles, and actions are granted according to those roles. Different points of view and filtering systems are offered, which help users understanding the data. The objective is to “merge immersive data visualizations with learning approaches [. . . ]to increase users’ cyber situational awareness”. From this virtual environment, we want to keep the filtering system and the different roles that can be attributed to users and which define the visible data for each user, depending on what they need to know at a given moment.
Regarding the disaster management field, there does not seem to be VR versions of COP that are actually used in a real crisis. We believe that virtualizing the crisis cell and the COP can offer great advantages and better tools for decision-making and situation awareness. We describe our proposal in the next part.
3 OUR PROPOSAL:ACOPINVR
Virtual reality can be approached from two angles. First, VR is a great tool to replicate reality. This is great for situational awareness of the crisis: we can imagine having access to a sizable replica of the crisis situation, maintained in real-time with a COP, available to every involved organization and commander. Provided that a 3D model of the crisis place is available, for instance from Google Maps, or Microsoft, or Open Street Map, users could adopt a “God-like” point of view, where they would be able to get a global overview of the situation. With 3D models of buildings, they could also be able to zoom on the model until they can evolve inside of it, in real size, as if they were in the middle of the crisis but without the risks. However, for data visualization, the second angle might be even more interesting. VR can be used to go beyond reality, to break free from the constraints that exist in the real world. As put by [16], “if you want to teach biology, why build a virtual classroom with desks and a blackboard in Second Life when you could build a whole interactive human cell?”. Taken together, these two angles provide great tools for situational awareness and decision making. In this part, we propose a virtual environment dedicated to situation awareness and decision making in a disaster situation, and we present a prototype of this environment. This article presents the prototype in the state it is in at the moment we write, as well as the directions we want to follow. It will evolve in the future, as we find new functionalities to add to it (see Perspectives).
3.1 Presentation of the virtual environment
To enhance situational awareness and support decision making, we propose a virtual environment dedicated to the decision-maker in a crisis situation. This environment would be available to every emergency management service involved, as a common place in which they could meet and talk even if they are not physically in the same place. Thus, all of them would be able to use the same interface for the COP. This environment is composed of a 3D map around which users can stand and walk. This map is placed on a table, its size and location are fixed, but users can interact with it through controllers. Thus, it is possible to zoom in and out to show a precise location or the general surroundings of a place. It is also possible to slide the map so that it shows another place, anywhere in the world
(which we refer to as panning the map in this article). The map will automatically adapt so that it always fits the size of the block, no matter how zoomed it is, and no matter what location is displayed. The zooming function allows the users to have a “God-like” point of view of the situation, allowing for a good stand back to get a view of the global situation, but also to zoom in the scene until being inside the crisis in real size, experiencing the crisis at the first person, but without taking risks. This would allow the decision-makers to get all the necessary information about the situation, to make the best decision.
The environment also offers the possibility to pin information on the map, such as actors, or sensors. The user can choose from a list the kind of element that he wants to add on the map, and then place it wherever he wants. Those pins can be moved or deleted if needed.
Figure 1: Inputs and outputs of the environment
The environment can take JSON files as inputs, and produce JSON files as outputs. This means that the environment can ex-change data with an external source, like software, or sensors. For instance, sensors could send geolocations for the actors to the virtual environment, which would then be able to show them on the map at their real location, in real-time. The decision-makers would then be able to follow the on-site actors and know their position at each time. Then, if a decision-maker moves an actor’s pin, the location would change and would be sent out, via a JSON file, to a decision support system for instance. This could also allow users to commu-nicate with actors on the field: moving an actor’s pin on the virtual environment could send a message to the real actor with the new location, showing him where the decision-maker wants him to be. In the same way, adding a new fireman pin on the virtual map could result in a message sent to the on-field commander, telling him to send a fireman to the location where the new pin was placed. We can also imagine to click or select a pin to request information from the corresponding actor, such as the state of the task he has to do, or information about the situation or the resources available on site.
Figure 2: View of the map in the virtual environment
3.2 Architecture
The virtual environment was created using Unity©1, in the version 2019.3.14.f1. The interaction with the environment is made with
1https://unity.com/
HTC Vive Pro©2and controllers. Steam VR©3was used to de-ploy the virtual environment and Photon Network© and Photon Voice©4to implement the multi-player aspect, for its advanced state of connection between users.
The map software development used is Microsoft MapsSDK-Unity5. Microsoft officially provides two methods to install Mi-crosoft MapsSDK. One is cloning the sample project offered by Microsoft from Github, another is starting from scratch. In this project, we choose the second option and installed the package directly within Unity® after configuring the Package Manager.
To read and produce JSON files, we used Newtonsoft.Json©6. In crisis management, the amount of data can quickly become huge, and the corresponding JSON files can be very complex, with for instance null values and lists of JSON. This explains why we used Newtonsoft.Json© instead of other widely used solutions like LitJ-SON7and JsonUtility8which we tried, but which did not work as
well as Newtonsoft.Json© (it generated errors and did not support the complex JSON files that we used).
The workflow of the virtual environment in his current state is shown in Figure 3.
After the user starts running, the map will be initialized. The location and zoom level will be set as the initial value. Then the script will parse the JSON file provided as an input. The initial pins will be put on the map according to the information from the JSON file. Users will then see a 3D map with several pins. They can then start operating on the map, zooming in and out of the map, and panning the map to find the desired location. It is also then possible to add pins with a selected role, to delete or move existing pins, as described in the previous part. The map is updated in real-time as new JSON files are received. This means that the pins on the map will move as the corresponding actor’s location on-site is changing, and the information available in the virtual environment can be updated in real-time with data coming from the field. JSON files containing the information displayed on the map are also regularly exported and sent, for instance, to decision support systems. This continuous file exchange allows the COP and connected external systems to always remain up-to-date.
Figure 3: The workflow of the virtual environment
2https://www.vive.com/fr/product/vive-pro/ 3https://store.steampowered.com/steamvr?l=french 4https://www.photonengine.com/ 5https://www.microsoft.com/en-us/maps/mixed-reality 6https://www.newtonsoft.com/json 7https://litjson.net/ 8https://docs.unity3d.com/ScriptReference/JsonUtility.html
3.3 Technical aspects
The main algorithm of this virtual environment is about movement, including panning the map, zooming in or out, and moving the pins. Those functionalities allow an improvement of the crisis visualiza-tion, providing the decision-makers with global points of view as well as more precise points of view. Besides, the panning function al-lows the decision-makers to see the surrounding area without having to use another tool or another map. The core of panning the map is to keep the wanted location at the center of the map. When panning the map, a vector is produced that shows the distance and direction of the map’s movement. We needed to calculate the new center point of the map according to the vector. Then the tile supporting the map is updated with the new center point. For moving pins, we need to catch the pin game object first. So we put all pins on separate layers to avoid unnecessary issues. We can use rays to catch the pins on the pins’ layer and get the point on the map. Then like for panning the map, we get the movement’s vector, calculate the new location, and replace the pin’s location. The process of these two operations can be abstracted to the flowchart shown in Figure 4.
Figure 4: Flowchart of the algorithms
4 PERSPECTIVES
4.1 Improve the existing
The virtual environment that we propose aims to improve situational awareness in a crisis context, in particular by improving COP’ rep-resentations. As stated in the first parts of that article, COP usually consist of paper maps, boards, and post-it, which are manually main-tained according to data exchanged vocally thanks to radio or phone calls. Our environment provides a 3D and interactive map of the crisis location, that is updated automatically and in real-time through JSON exchanges with sensors or decision support systems. The data displayed on this map can also be updated manually if needed.
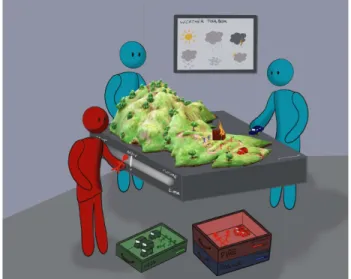
Let’s imagine a crisis cell in our virtual environment. No more paper maps on the wall, they are replaced with a single floating 3D map in the middle of the room. The decision-makers from every emergency management services are standing around the map, enjoying a global vision of the surroundings. They can see each other, communicate with each other, and interact together on the map. At some point, one of them needs to take a closer look. No need to find a more precise map, he can just zoom in on the 3D map. If the 3D model of involved buildings is available, he can even step inside it, to gathered first-hand information on the situation. Information about distance, altitude, or scale is directly available on the map. The available resources are arranged in toolboxes in the room: 4 fire trucks, 20 firemen, 3 police cars, and 15 policemen. . . Those are the actors and resources that can be used on site. They can
be placed on the map, either automatically if their geolocation can be informatically sent to the environment, or manually by grabbing them and placing them on the map. As soon as they are on the map, their location is registered in a JSON file, ready to be sent out to on-site actors or decision support systems. Other data can also be registered; such as orders or suggestions for them to do a task or go where their avatar is on the map. Various sensors on the crisis site are connected to the environment: presence, heat, smoke, water level. . . they are sending information that can be displayed on the map as soon as received. This means that a replica of the crisis can be seen in real-time on the 3D map of the virtual crisis cell. In the case of a large scale crisis, a huge amount of data can be gathered, and not all of them are necessary to every decision-maker. In the virtual crisis cell, each decision-maker could have a designated role that would act as a filtering system to only show him the data that is necessary to him. This filter could be activated or deactivated as needed so that he can avoid information overload, but also keep a global vision of the situation.
Figure 5: Picture of the virtual crisis cell
Figure 6: Details of the virtual crisis cell
Not all those functionalities are currently available in our environ-ment, so we are going to keep working on it to implement them in the next steps.
A technological crisis management platform (R-IO Suite), de-scribed in [2], has been developed as a decision support system ded-icated to improving multi-organizational crisis management. Based
on a knowledge database filled with the geographical context of the crisis site and with the available actors (such as firemen, policemen, or medical doctors) and their abilities, this platform can provide a crisis response process aiming to help the different organizations working together most effectively. This platform also allows to track the response to the crisis, and to compare the expected response and the actual situation, to adapt the response process in real-time.
We want to link this platform with our environment, to take ad-vantage of the virtual reality to improve the platform, but also to take advantage of the platform’s functionalities to improve our virtual environment. For instance, besides the visualization advantages offered by the virtual environment, we would like to allow the visu-alization of the knowledge base, using immersive analytics technics. Basically, the idea is to use the virtual environment as a more natural interface to use R-IO Suite. This link will also allow us to provide new functionalities to the crisis management domain, which we described in the next part.
4.2 Offer new functionnalities
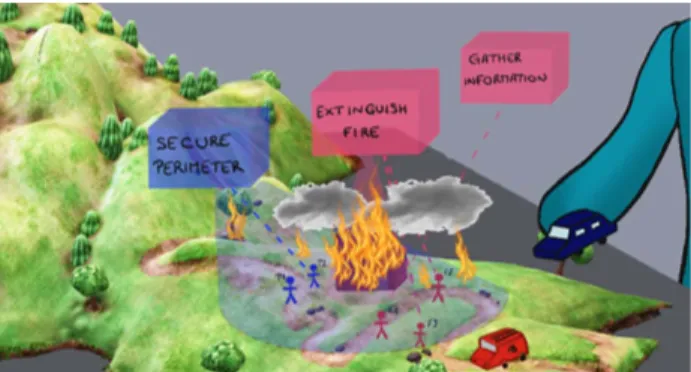
In a crisis situation, given the necessary data about the context, resources, and objectives, R-IO Suite can provide a BPMN process of how to best solve the crisis, using the resources and availabilities of all emergency management services available most efficiently [2]. At the moment, this process can only be displayed in 2D on R-IO Suite.
Let’s imagine that this process could be available in the virtual crisis cell, as shown in Figure 7. We can imagine having it floating above the map, each task pointing to the concerned actor or location. This would allow decision-makers to know at first glance if actors were unoccupied, or if locations of the crisis site were neglected. For instance, in a fire situation, one of the tasks of the process would be for a fireman to go to a fire and extinguish it. In the crisis cell, when a decision-maker would touch this task, the fireman and the fire would start glowing on the map, to make them easier to notice among the data displayed on the map. We can also imagine that an urgent task would be more visible than a background task and that they would start fading away as they are being completed. If a divergence between the expected state of the crisis and the reality where to be detected, (for instance, a new fire-starting or a fire that should have been extinguished but is not) the environment could solicit multiple sensory channels: we can imagine a sound alarm, vibrations in the handlers, or even a smoky smell appearing in the virtual environment, besides a visual element such as a flashing fire popping on the map. This would reduce the decision-makers’ chance of missing new information, and improve their reaction time.
Figure 7: The process above the virtual map
Another functionality of R-IO Suite that we would like to im-plement in this environment is the anticipation. This would allow
decision-makers to visualize the planned evolution of the situation on the 3D map. Predicting the state of the crisis in an hour, a day, based on the current situation would be a valuable tool to help make the good decision to manage the crisis. This would also allow com-manders to test solutions, or to test new conditions (like weather conditions or the number of involved actors). Visualizing them, and their consequences, in the virtual environment before ordering them in the real crisis site would allow commanders to check the rele-vance of a solution, and thus applying it with fewer risks of making mistakes.
Figure 8: Anticipation example
Apart from the functionalities of R-IO Suite, virtual reality could also provide new ways of analyzing the crisis retrospectively. All the data gathered and shared in the virtual environment, as well as the manipulations and actions taken during the crisis, could be registered. This would allow decision-makers to re-watch the management of the crisis to look for what worked or what did not work so well. Thanks to immersive analytics, exploring and analyzing the huge amount of data gathered during the crisis would be easier. Lessons would be easier to retrieve and thus, mistakes would be easier to avoid next time.
REFERENCES
[1] Military Dictionary (Letter Group C).
[2] F. Benaben, A. Montarnal, S. Truptil, M. Lauras, A. Fertier, N. Salatge, and S. Rebiere. A conceptual framework and a suite of tools to sup-port crisis management. In HICSS 2017-50th Hawaii International
Conference on System Sciences, p. 237.
[3] N. Bharosa, J. Lee, and M. Janssen. Challenges and obstacles in sharing and coordinating information during multi-agency disaster response: Propositions from field exercises. 12(1):49–65. doi: 10.1007/s10796 -009-9174-z
[4] L. K. Comfort. Crisis Management in Hindsight: Cognition, Commu-nication, Coordination, and Control. 67(s1):189–197. doi: 10.1111/j. 1540-6210.2007.00827.x
[5] J. Copeland. Emergency Response: Unity of Effort Through a Common Operational Picture:. doi: 10.21236/ADA479729
[6] C. Donalek, S. G. Djorgovski, A. Cioc, A. Wang, J. Zhang, E. Lawler, S. Yeh, A. Mahabal, M. Graham, A. Drake, S. Davidoff, J. S. Norris, and G. Longo. Immersive and collaborative data visualization using virtual reality platforms. In 2014 IEEE International Conference on
Big Data (Big Data), pp. 609–614. IEEE. doi: 10.1109/BigData.2014.
7004282
[7] T. Dwyer, K. Marriott, T. Isenberg, K. Klein, N. Riche, F. Schreiber, W. Stuerzlinger, and B. H. Thomas. Immersive Analytics: An Intro-duction. In K. Marriott, F. Schreiber, T. Dwyer, K. Klein, N. H. Riche, T. Itoh, W. Stuerzlinger, and B. H. Thomas, eds., Immersive Analytics, Lecture Notes in Computer Science, pp. 1–23. Springer International Publishing. doi: 10.1007/978-3-030-01388-2 1
[8] M. El Beheiry, S. Doutreligne, C. Caporal, C. Ostertag, M. Dahan, and J.-B. Masson. Virtual Reality: Beyond Visualization. 431(7):1315– 1321. doi: 10.1016/j.jmb.2019.01.033
[9] FEMA. National Incident Management System: FEMA 501/Draft August 2007.
[10] A. Fertier, A. Montarnal, A.-M. Barthe-Delano¨e, S. Truptil, and F. B´enaben. Reducing Information Load to Enhance Collabora-tive Awareness Thanks to a Pre-selection of Information. In L. M. Camarinha-Matos, H. Afsarmanesh, and Y. Rezgui, eds.,
Collabora-tive Networks of CogniCollabora-tive Systems, IFIP Advances in Information
and Communication Technology, pp. 286–294. Springer International Publishing. doi: 10.1007/978-3-319-99127-6 25
[11] J. Hodicky and P. Frantis. Decision support system for a commander at the operational level. In Proceedings of the International Conference
on Knowledge Engineering and Ontology Development, pp. 359–362.
SciTePress - Science and and Technology Publications. doi: 10.5220/ 0002269503590362
[12] J. Holopainen, A. L¨ahtev¨anoja, O. Mattila, I. S¨odervik, E. P¨oyry, and P. Parvinen. Exploring the Learning Outcomes with Various Tech-nologies - Proposing Design Principles for Virtual Reality Learning Environments. In HICSS 2020-53rd Hawaii International Conference
on System Sciences. doi: 10.24251/HICSS.2020.004
[13] M. Inoguchi and H. Hayashi. Visualization methods and associated challenges of disaster data for common operational picture. In
Interna-tional Conference on Information Society (i-Society 2012) IEEE, pp.
237–241.
[14] A. Kabil, T. Duval, N. Cuppens, G. Le Comte, Y. Halgand, and C. Ponchel. 3D CyberCOP: A Collaborative Platform for Cybersecu-rity Data Analysis and Training. In Y. Luo, ed., 15th International
Conference on Cooperative Design, Visualization and Engineering,
Cooperative Design, Visualization, and Engineering, pp. 176–183. Springer.
[15] P. K. Kwok, B. K. P. Chan, and H. Y. K. Lau. A Virtual Collaborative Simulation-based Training System. In Proceedings of the 10th
Inter-national Conference on Computer Modeling and Simulation, ICCMS
2018, pp. 258–264. ACM. doi: 10.1145/3177457.3177494
[16] J. Lester. Pathfinder Linden’s guide to getting started in Second Life. In Proceedings of the Second Life Education Workshop at the Second
Life Community Convention, San Francisco, vol. 26.
[17] J. McCormack, J. C. Roberts, B. Bach, C. D. S. Freitas, T. Itoh, C. Hurter, and K. Marriott. Multisensory Immersive Analytics. In K. Marriott, F. Schreiber, T. Dwyer, K. Klein, N. H. Riche, T. Itoh, W. Stuerzlinger, and B. H. Thomas, eds., Immersive Analytics, Lec-ture Notes in Computer Science, pp. 57–94. Springer International Publishing. doi: 10.1007/978-3-030-01388-2 3
[18] N. Netten and M. van Someren. Improving Communication in Crisis Management by Evaluating the Relevance of Messages. 19(2):75–85. doi: 10.1111/j.1468-5973.2011.00636.x
[19] K. Steen-Tveit, J. Radianti, and B. E. Munkvold. Using Audio-Logs for Analyzing the Development of a Common Operational Picture in Multi-agency Emergency Response. In HICSS 2020-53rd Hawaii
International Conference on System Sciences. doi: 10.24251/HICSS.
2020.074
[20] J. Wolbers and K. Boersma. The Common Operational Picture as Collective Sensemaking. 21(4):186–199. doi: 10.1111/1468-5973. 12027