Éthique et économique/Ethics and Economics, 12 (2), 2015 http://ethique-economique.net/
the MENA region: is there a moral issue?
By/Par Philippe Adair1Imène Berguiga
21. Université Paris-Est Créteil, ERUDITE, Faculty of Economics and Management, adair@u-pec.fr
2. Université de Sousse, ERUDITE and IHEC, Tunisia, imne068@yahoo.fr
A
BSTRACTThe high interest rates of microfinance institutions (MFIs) seem to oppose their social mission, and raise a moral issue. We analyse the determinants of the level of interest rates with regard to the financial performance of an unbalanced panel of 66 MFIs in nine countries of the Middle East and North Africa (MENA) region over the period 2004-2012. We differentiate internal factors (cost of capital, operating expenses and loss provisions) from the external ones (regulation, competition and inflation).The outcomes of a typology from a multivariate analysis upon the relationship between the interest rate and social performance of 53 MFIs in 2008 do not match the classification of MFIs according to Yunus and Weber, which proves irrelevant.
Keywords: costs, interest rates, MENA, microfinance institutions, multivariate analysis, performance.
R
ÉSUMÉLe taux d’intérêt élevé des institutions de microfinance (IMF) semble s’opposer à la mission sociale du microcrédit. Nous analysons les déterminants des niveaux des taux d’intérêt au regard de la performance financière d’un panel incomplet de 66 IMF dans 9 pays de la région du Moyen-Orient et d’Afrique du Nord (MENA) sur la période 2004-2012. Nous distinguons les facteurs internes (coût des fonds propres, charges d’exploitation, provisions pour pertes) et externes (règlementation, concurrence et inflation). Nous confrontons la typologie d’une analyse factorielle sur la relation entre taux d’intérêt et performance sociale de 53 IMF de la région en 2008 au classement des IMF selon Yunus & Weber, dont le critère de la marge financière s’avère non pertinent.
Mots clés : analyse factorielle, coûts, institutions de microfinance, MENA, performance, taux d’intérêt.
Éthique et économique/Ethics and Economics, 12(2), 2015
http://ethique-economique.net/ 45
I
NTRODUCTIONMicrofinance institutions (MFIs) provide financing to the poor excluded from bank credit and stand as an alternative to usury requested by informal lenders. The lending rates charged by MFIs to their borrowers stand in between the bank rate and usury.
The lending interest rates should enable MFIs to provide sustainable financial services to large numbers of poor clients while being independent of any form of subsidy (CGAP, 1997). They must therefore access commercial funds involving a payable rate and achieve a financial margin sufficient to offset all direct and indirect costs associated with their financial intermediation (Labie, 1996).
Although MFI interest rates are lower than in informal finance, they are considered too high with regard to poor clients. From the ethical point of view, high rates undermine the social acceptance of microfinance, generating the disapproval of international political leaders (CGAP, 2004; Fernando, 2006; Hudon, 2007; Gonzalez, 2010). The controversy between the advocates of free (and high) lending rates and those of capped rates took place at the very beginning of microfinance in the 1970s (Acclassato, 2008). It was revived by a strong criticism from the founder of the Grameen Bank (Yunus and Weber, 2007) and fuelled the discussion on the regulatory ceiling upon interest rates in a growing number of countries. Three main schools of thought participate in the debate upon the appropriate level of microfinance lending rates: the first two fall under the welfarist approach that opposes the institutionalist approach of the third school (Adair and Berguiga, 2014). The theological school consists mainly in Christian NGOs, according to which any interest rate equates prohibited usury, advocating near-zero rates. The second school claims that interest rates should be capped below the market rate (Helms and Reille, 2004); it gathers savings and credit unions and mutual societies as well as federations and unions of the Raiffeisen type. The third school supports MFIs opting for the sustainability of their business, which cover up their costs and reinvest their profit, thanks to high interest rates their clients cope with (Ayayi and Sene, 2010). Several studies (CGAP, 1997; Ledgerwood, 1998; Hudon, 2007; Gonzalez, 2010; Cotler and Almazan, 2013) have proposed models of determination of fair lending interest rates, albeit these models ignore the external factors influencing the rate levels.
With respect to worldwide microfinance, the MENA region is both the most recent and the narrowest market, in terms of the number of customers and loan portfolio, and the one whose growth is fastest (MIX & Sanabel, 2012). According to MIX & Sanabel (2011), MFIs charge a 19.69% interest rate per annum on average. This rate varies across countries and over time: where comes from the difference between lending rates? What are the determinants of interest rates in the MENA region? Are these interest rates undermining social performance and forsaking poor clients who represent the target of MFIs?
The first section describes the level and evolution of both debtor and creditor interest rates for a sample of 66 MFIs in nine countries from the MENA region over the period 2004-2011. The second section examines the internal components of interest rates: capital costs,
Éthique et économique/Ethics and Economics, 12(2), 2015
http://ethique-economique.net/ 46
operating expenses and loan losses. The third section focuses upon the relationship between interest rates and social performance of 53 MFIs; it confronts the classification resulting from a multivariate analysis with the classification advocated by Mohamed Yunus. The fourth section takes into account the external factors influencing the MFI interest rates: regulation, competition and inflation. The conclusion summarizes our main results.
1. THE SOURCES
,
LEVELS AND TRENDS OF MICROFINANCE INTEREST RATES IN THE MENA REGION1.1. Data sources
Thanks to the Microfinance Information Exchange (MIX) database, we selected an incomplete panel of 66 MFIs in nine countries in the MENA region over the period 2004-2011: Egypt (13), Jordan (8), Morocco (10), Tunisia (1), Yemen (7), Lebanon (5), Palestine (8), Syria (3) and Iraq (11).
The MIX provides the average lending rate per annum in nominal terms, expressing the total loans income (interest, commissions and other costs) as a percentage of the outstanding amount of the gross loan portfolio. This database also collects information on financial expenses and debts: i.e. the cost of resources used by MFIs to finance their loan portfolio; hence, the nominal borrowing rate can be calculated by dividing the total financial expenses upon total liabilities (savings deposits, trade payables and payables to subsidized rate) (Appendix 1).
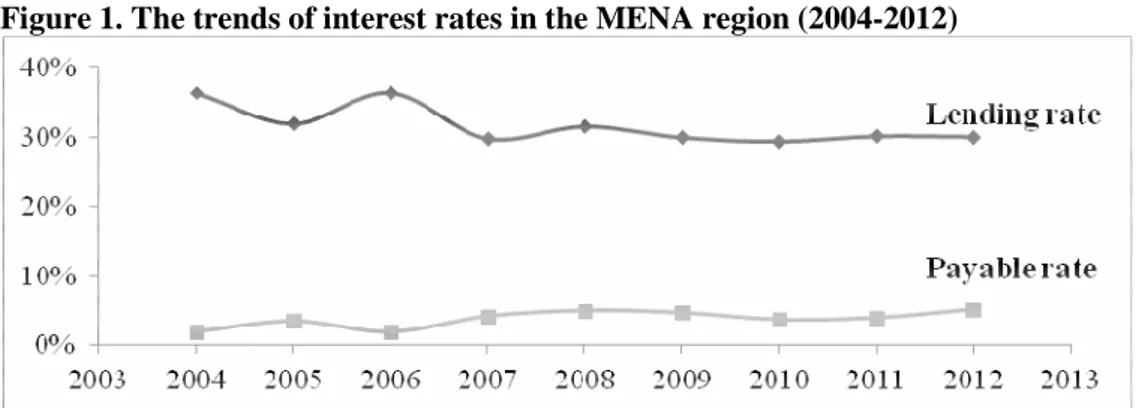
Figure 1. The trends of interest rates in the MENA region (2004-2012)
Source: our design from the MIX
1.2. Levels and change in lending rates
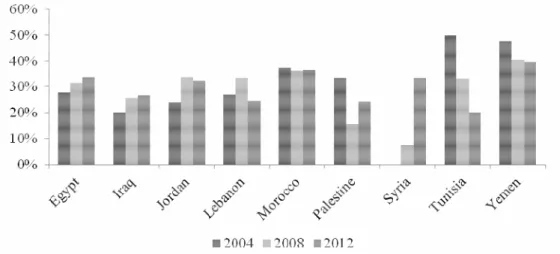
The median lending rate of interest for MENA MFIs varies between 29% and 36% over the 2004-2012 period (Figure 1) and half of MFI applies a rate of 30% in 2012. These rates decline until 2009 and then stabilize until 2012; however, they diverge according to the country over the period (Figure 2). Levels fall gradually in Morocco, Yemen, Palestine and Tunisia: Yemeni MFIs recorded the highest median interest rates in the MENA region, 48%
Éthique et économique/Ethics and Economics, 12(2), 2015
http://ethique-economique.net/ 47
in 2004 and 39.4% in 2012; the rate of the Tunisian MFI went down from 50% in 2004 to 20.21% in 2011.In contrast, rates rise in Egypt, Jordan, Iraq and Syria. The MENA MFIs differ according to their stage of development: those of Egypt and Jordan are mature (over eight years old), while those of Iraq and Syria are the youngest (Appendix 2). The increase in lending rate in these countries therefore requires further explanation than age.
Figure 2. The trends of lending interest rates across MENA countries (2004-2012)
Legend: data are median rates. Source: our design from the MIX
1.3. The levels and trends of borrowing interest rates
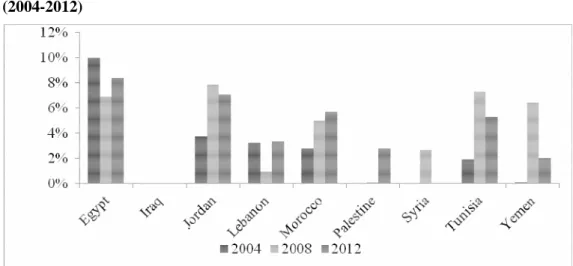
The median payable rates of interest of the MENA MFIs averaged 2% in 2004 up to 5.22% in 2012 (Figure 1). The trend over the 2004-2012 period is mixed across countries (Figure 3). Rising interest rates can be explained by the maturity of microfinance in Morocco, including MFIs receive the majority of funding for the region; the increased indebtedness of MFIs in Jordan and Yemen reinforces the leverage between 2007 and 2008 (MIX & Sanabel, 2010).
Conversely, the lower rates for MFIs in Egypt can be explained by the ease of access to preferential borrowing rates; in 2008, the cost of resources used by MFIs in Egypt and Lebanon declined significantly compared to 2004 and 2011.The Tunisian MFI records the highest cost of resources (7.32%). MFIs in Palestine and Iraq are not mature enough to raise funds from banks without the help of credit guarantees (MIX & Sanabel, 2010). The increase in payable rates does not explain he decline in lending rates until 2007: the more MFIs pay interest charges on their borrowed funds, the less the return on their portfolio, and vice versa. However, both rates follow the same trend since 2008.
Éthique et économique/Ethics and Economics, 12(2), 2015
http://ethique-economique.net/ 48
Figure 3. The trends of borrowing interest rates across MENA countries (2004-2012)
Legend: data are median rates. Source: our design from the MIX
2. COMPONENTS OF THE LENDING RATE IN THE MENA REGION
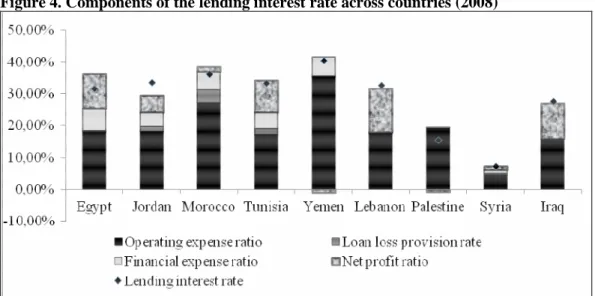
The excess (or negative) between income and expenses is ready profits (or losses) of the MFI. The components of lending rates cover three broad headings: financial expenses, provisions for non-performing loans and operating expenses (Box 1). The increase or decrease in one or more components generates a rise or decline in the lending rate (Rosenberg et al, 2013).
Box 1. Components of the lending interest rate
Lending rate = (financial expenses /AGLP) + (loan loss provision /AGLP) + Operating expenses/AGLP) + (profit /AGLP)
Lending rate ratio = financial expense ratio + loan loss provision ratio +operating expense ratio + net profit ratio
Payable interest rate = Financial revenue /AGLP AGLP = Average Gross Loan Portfolio
Source: our design
The lending rate in the MENA region is one of the lowest in the world and the ratio of total expenses to total assets is the lowest compared to other regions (MIX & Sanabel, 2010). According to the breakdown of these costs in 2008, the ratio of operating expenses is the major component in the structure of costs for MENA MFIs. Moreover, profitability is not the main determinant of lending rates (Figure 4).
Éthique et économique/Ethics and Economics, 12(2), 2015
http://ethique-economique.net/ 49
Figure 4. Components of the lending interest rate across countries (2008)
Source: our design from the MIX
2.1. Financial expenses
MFIs use three funding sources: equity, debt and the deposits. Equity, including subsidies, was the main source. Since the donors restricted their commitments in the MENA region, MFIs did raise loans from private investors (Figure 5). Debts are now the primary source, followed by subsidies and credit guarantees.
Figure 5. The funding sources of the MENA MFIs (2007-2011)
Éthique et économique/Ethics and Economics, 12(2), 2015
http://ethique-economique.net/ 50
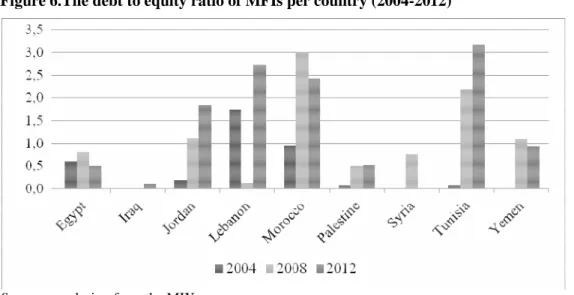
The evolution of the debt to equity ratio (leverage) shows that MFIs from Morocco, Jordan, Yemen and Tunisia are mainly financed with debt, including voluntary savings (Figure 6). The Moroccan MFIs have access to commercial debt without any credit guarantee, thanks to the maturity, size and performance of microfinance in the country. MFIs from Jordan, Yemen and Tunisia are mature compared to those of the young emerging markets of Lebanon, Palestine, Syria and Iraq (Appendix 2). In Jordan, MFIs increased their median leverage from 0.2 to 1.8 between 2004 and 2012, while the leverage of MFIs in emerging markets is less than 1. Debts amount to half the equity of Egyptian MFIs, which still depend on credit guarantees to access commercial loans (MIX & Sanabel, 2010).
Figure 6.The debt to equity ratio of MFIs per country (2004-2012)
Source: our design from the MIX
Generally, the more MFIs are indebted, the more they pay high financial expenses, unless they benefit from subsidies or concessional rates. The level of median financial costs incurred by Moroccan MFIs (5% in 2008) is lower than that in Egypt (7.01%) and Yemen (6.08%) (Figure 4). In Yemen and Syria, the collection of voluntary savings also increases financial expenses.
Various donors finance MFIs: domestic financial institutions (commercial, public and cooperative banks), development finance institutions (DFIs), funds (microfinance investment vehicles, funds from international NGOs and foundations) and governments as well as other providers (NGOs, individuals and private companies). Domestic financial institutions are the main lender of MENA MFIs providing 81.87% of the overall debt in 2008, with a weighted average loan period of 67 months, and charge a 4.71% interest rate. Loans from governments and DFIs account only for 12% of the overall debt and charge an 8.27% interest rate (MIX 2008). Funds charge the lowest rate (3.91%), which is subsidized.
Éthique et économique/Ethics and Economics, 12(2), 2015
http://ethique-economique.net/ 51
2.2. Provisions for loan losses
The borrowing rates differ according to the institutional status and operating areas of MFIs. On the one hand, banks usually grant a limited loan amount with respect to their status (Hartarska and Nadolnyak, 2008). In 2008, most MFIs in the sample (four out of five) are NGOs operating on mature microfinance markets: Egypt, Morocco and Jordan (Appendix 2): Despite their status, these MFIs have attracted donors and commercial lenders that charge low borrowing rates. On the other hand, commercial lenders do not wish to finance operations on the rural and agricultural markets. This led governments either to establish institutions and specialized rural credit programs with interest rates capped at artificially low levels, or to grant credit at concessional rates. Almost half the MFIs of the sample are involved in rural areas, especially in Egypt and Palestine, and taking advantage from subsidized rates (MIX & Sanabel, 2009).
Most customers have no collateral and, as credits are not backed by real guarantees, MFIs incur a default risk. In as much as the loan portfolio generates interest income, the quality of loan repayment is essential for any MFI. The distinction between a good loan that is paid on time, and a risky loan that is late over (x) days from the due date, is paramount: the longer the delay, the higher the probability of default. The MFI can pass the non-performing loans (NPL) either on loss provisions when it is anticipated, or on losses when provisioned receivables become irrecoverable. The provision for NPL is a cost to the MFI, which reflects levels of loan delinquency and the value of actual losses during the period (Rosenberg et al. 2013).
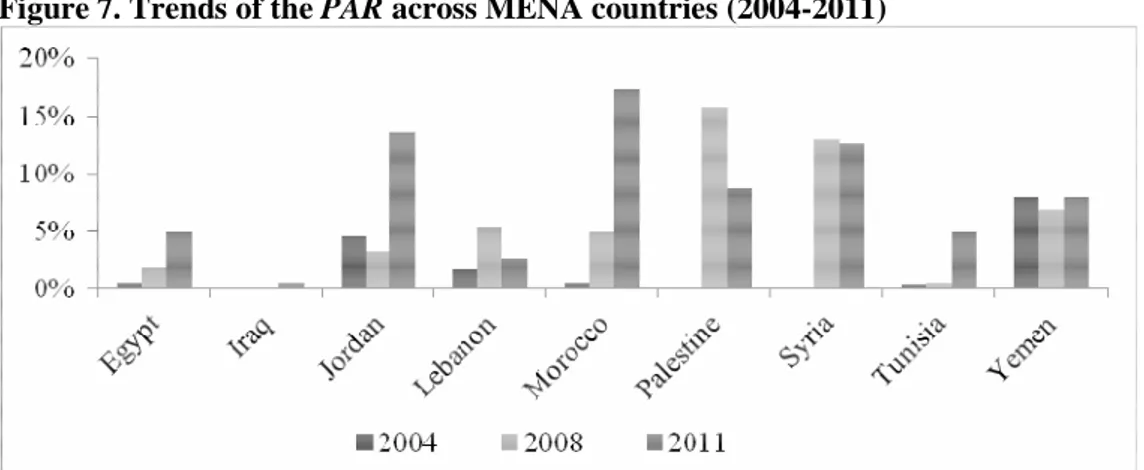
The ratio of portfolio at risk (PAR (30)) measures the default risk, which is calculated by dividing the stock of all loans with arrears exceeding 30 days by the total outstanding loan portfolio (Appendix 1). Although MENA experiences the lowest PAR amongst all regions, it deteriorates over 2004-2011 in Morocco, Egypt and Tunisia (Figure 7). In 2008, Palestine and Syria record the highest PAR, due to political instability in both countries (Adair and Berguiga, 2010). The increase in Tunisia and Egypt reflects the negative impact of the "Arab Spring" on the microfinance sector. In Morocco, it is due to the absence of prudential standards and a credit bureau. In 2008, Moroccan MFIs recorded the highest ratio of provisions for NPL in the region (3.84%), ahead of Tunisia (1.88%) and Jordan (1.49%) (Figure 4 above).
The ratio of risk coverage, the percentage of PAR covered by provisions for loan losses, fell in Morocco between 2008-2011 due to lack of funds: the average weighted PAR jumps from 5% in 2008 to 17% in 2011; the rate of losses on NPL increased by 1% in 2007 to 12% in 2009 (MIX & Sanabel, 2009). In 2008, less than half MFIs mainly grants joint guarantee loans: seven in Morocco and nine in Egypt (Appendix 2). Although such loans tend to tame the default risk with respect to individual loans (Armendariz and Morduch, 2005), the quality of the loan portfolio deteriorated for Moroccan and Egyptian MFIs: joint guarantee has proved insufficient to control the default risk.
Éthique et économique/Ethics and Economics, 12(2), 2015
http://ethique-economique.net/ 52
Figure 7. Trends of the PAR across MENA countries (2004-2011)
Legend: data are weighted means Source: our design
2.3. Operating expenses
The ratio of operating expenses measures the cost required to provide a loan unit, and depends on the productivity of staff and other operating costs (administrative burdens, branch network, transport, depreciation, etc.). The lower the ratio, the higher the efficiency of the MFI. Levels of MFI interest rates follow those of operating expense ratios (Figure 4 above), which are the determining factor in lending rates. In 2008, the highest operating expense ratios for MENA MFIs are recorded in Yemen (35.43%), Morocco (27.3%) and Palestine (19.27%).
The growth of MFIs can improve their efficiency by achieving economies of scale and expanding their loan portfolio, hence reducing the ratio of operating expenses. Such is the case for the mature markets of Egypt, Jordan and Tunisia, as well as Lebanon (Figure 4). However, such is not the case for MFIs in Morocco, although over two-thirds are mature (Appendix 2). The cost per borrower (CB) more than doubled between 2004 and 2011, while staff productivity (PP) fell from 220 borrowers per staff in 2006 to 118 in 2009; the increase in arrears has forced the personnel to devote more effort to loans recovery, at the expense of issuing new loans (MIX & Sanabel, 2010).
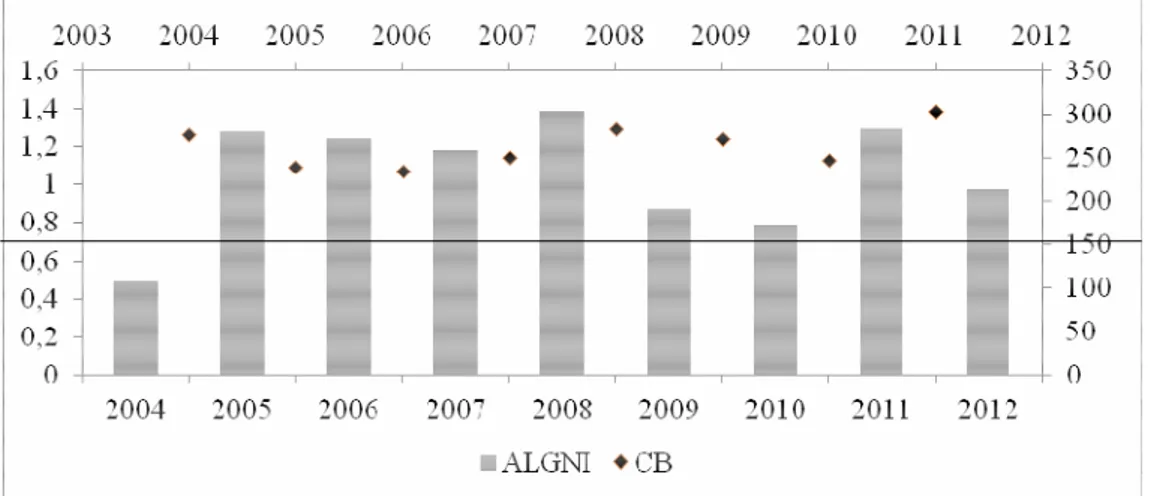
In Palestine, the average loan amount per borrower based on gross national income (GNI) per capita (ALGNI) increases and the cost per borrower (CB) declines (Figure 8). However, MFIs remain inefficient and record the highest cost per borrower in the region ($ 304 in 2011); staff manages individual loans with an average amount per borrower that exceeds the GNI per capita and earns almost seven times the loans income (MIX & Sanabel, 2011).
Éthique et économique/Ethics and Economics, 12(2), 2015
http://ethique-economique.net/ 53
Figure 8.Average loan amount (as of GNI per capita) and cost per borrower in Palestine
Source: our design from the MIX
3. INTEREST RATES AND THE SOCIAL PERFORMANCE OF MFIS IN THE MENA REGION
3.1. Methodology
Yunus and Weber (2007) propose to restrict the lending rates to 10-15% points compared to the cost of financing for MFIs; this cap is designed to prevent MFIs to take excessive profits on loans to the poor (Gonzalez, 2011). Microcredit interest rates are evaluated according to the financial margin (interest rates premium), corresponding to the difference between lending rates and borrowing rates (cost of funds). The borrowing rate is calculated from dividing the financial burden by the average loan amount (AGLP) or total assets, in as much both ratios give similar results. Yunus and Weber (2007) rank MFIs into three categories (Box 2): the green zone includes those that target poverty, the yellow zone (intermediate but not defined) and the red zone includes MFIs that maximize their profits. This classification distinguishes MFIs whose clients are easy to serve from those whereof customers are more difficult to serve and whose operating costs per unit are the highest. The classification is due almost exclusively to the operating expenses, rather than profit levels, that amount to 80% of total expenditure covered by the financial margin for most MFIs.
We study the relationship between lending rates and the social performance of MFIs in the MENA region, thanks to a (multivariate) cross-section analysis of 53 MENA MFIs in 2008. We use 12 variables to identify social performance and internal determinants of financial margin (Table 1). We design a typology that we compare to the classification of Yunus and Weber (2007). The latter proves unable to disentangle the MFIs that are not pro-poor from those whose interest rates are but usury.
Éthique et économique/Ethics and Economics, 12(2), 2015
http://ethique-economique.net/ 54
Box 2: the classification of MFIs - pro-poor, intermediate and loan sharks
Green zone: interest rate – cost of funds ≤ 10 percentage points. MFIs operating within this zone are termed as "pro-poor". Yellow zone: interest rate – cost of funds ≤ 15 percentage points. MFIs operating within this zone are termed as "intermediate". Red zone: interest rate – cost of funds> 15 percentage points.
MFIs operating within this zone are termed as "loan-sharks". They are commercial firms whose main goal is to achieve large profit on behalf the shareholders and investors.
Source: Yunus and Weber (2007)
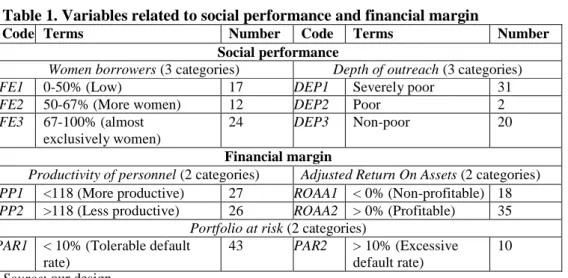
Table 1. Variables related to social performance and financial margin
Code Terms Number Code Terms Number
Social performance
Women borrowers (3 categories) Depth of outreach (3 categories)
FE1 0-50% (Low) 17 DEP1 Severely poor 31
FE2 50-67% (More women) 12 DEP2 Poor 2
FE3 67-100% (almost
exclusively women)
24 DEP3 Non-poor 20
Financial margin
Productivity of personnel (2 categories) Adjusted Return On Assets (2 categories)
PP1 <118 (More productive) 27 ROAA1 < 0% (Non-profitable) 18
PP2 >118 (Less productive) 26 ROAA2 > 0% (Profitable) 35
Portfolio at risk (2 categories) PAR1 < 10% (Tolerable default
rate)
43 PAR2 > 10% (Excessive default rate)
10
Source: our design
Social performance in 2008 is expressed by two variables proxies (Adair and Berguiga, 2010): the social impact of MFIs (Depth of outreach) according to poverty lines ($ 1.25/ a day and $ 2/ a day), and the percentage of women borrowers (FE).
The internal determinants of financial margin are operating expenses, provisions for losses and net profit (Figure 4 above), we respectively measured by the productivity of personnel (PP), the portfolio at risk 30 days (PAR (30)) and return on assets adjusted from subsidies (ROAA), which is calculated by Adair and Berguiga (2010). An MFI is considered more (less) productive when its productivity is above (below) the median; a PAR (30) below (above) 10% implies tolerable (excessive) delinquency rates; an ROAA standing above or below 0% indicates that the MFI is profitable or not profitable.
3.2. Multivariate factor analysis and clustering of MFIs in 2008
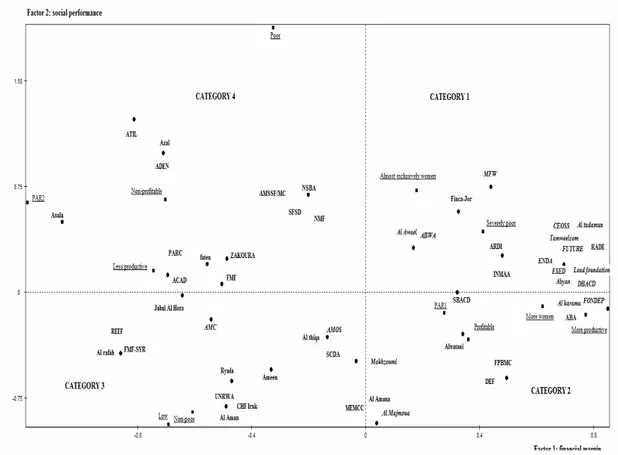
We restrict our factor analysis to the first two axes 1-2 that are most interpretable (Figure 9). Axis 1 opposes the PP1, PAR2 and ROAA1 terms to the PP2, PAR1 and ROAA2 terms; it can be interpreted as the axis of the financial margin components; it opposes MFIs whose financial margin is low to those whose margin is high. Axis 2, contrasting the FE1, DEP3 and ROAA2 terms with the FE3, DEP1 and ROAA1 terms, distinguishes profitable and non-socially performing MFIs, which target the non-poor and few women – from unprofitable and socially performing MFIs.
Éthique et économique/Ethics and Economics, 12(2), 2015
http://ethique-economique.net/ 55
The interpretation of the relationship between financial margin and social performance from a clustering analysis outlines a typology of MFIs into four categories.
Category 1 gathers 20 MFIs that are both socially effective and profitable; their financial margin is high: these MFIs that are pro-poor oriented have a positive impact on women (exclusive targeting), their default rate is very low and staff is very productive. Only three MFIs in this category (ARDI, INMAA and Finca-Jor) experience negative profitability although they have productive staff, and a less risky loan portfolio. These MFIs incur costs per borrower above the median ($ 74) because they grant small loans. Their high financial margin was not enough to cover their expenses. According to Gonzalez (2010) and Roberts (2013), it is operating expenses and not profitability that determine the financial margin of Category 1 MFIs.
Category 2 identifies seven MFIs with high financial margin that are not socially effective, targeting non-poor women or poor men.
Category 3 gathers 19 MFIs with low financial margin that are not socially effective.
Category 4 identifies seven MFIs with low financial margin, albeit they are socially effective and profitable. However, the Yemeni MFI Azal did not cover expenses, despite its lending rate that is the highest in the region (58%) and a very low deposit rate (2.67%). It experiences a very high default rate (13.02%) and a non-productive staff; hence, it must increase efficiency rather than interest rates.
Two-thirds (35 of 53) of our sample are profitable MFIs and over a half apply high lending rates above the median rate (31%). Almost half of these MFIs (16 of 35) appears in both categories 1 and 2: this suggests, on the one hand, that poor clients are able to afford high levels that do not prevent MFIs to achieve social performance. On the other hand, according to Roberts (2013), the profit motive encourages MFIs to set high lending rates.
As regards category3, AMC and Makhazoumi are profitable MFIs, while they charge high lending rates of interest. Staff productivity is very low, 7.83 and 38 customers respectively per staff member. The AMC loan portfolio recorded a 12% delinquency rate. The application of a very high interest rate enabled these two MFIs to cover all their expenses and make a profit.
Éthique et économique/Ethics and Economics, 12(2), 2015
http://ethique-economique.net/ 56
Figure 9. Axes 1-2: lending rates of interest and profitability of MENA MFIs (2008)
Legend: 18 profitable MFIs whose lending interest rate is above the median rate Source: our design
3.3. MENA typology versus the Yunus and Weber classification
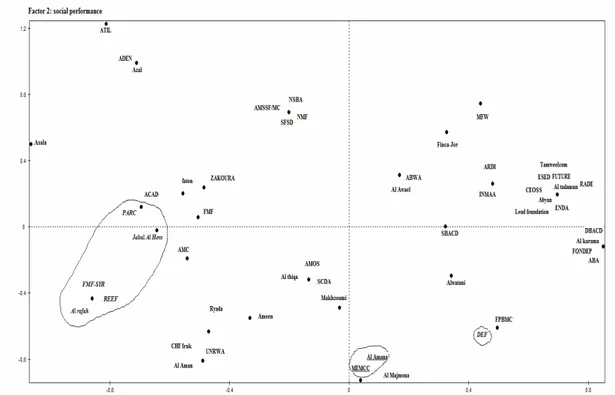
We place the MFIs from our typology into the classification designed by Yunus and Weber (2007); it comes out that over six out of seven MFIs fall within in the "red zone", whereof the financial margin is above 15%. Yunus and Weber assume financial performance is the main objective of these MFIs. However, our typology shows that these MFIs are included in all four categories and some do achieve social performance (Figure 10).
Éthique et économique/Ethics and Economics, 12(2), 2015
http://ethique-economique.net/ 57
Figure 10. Axes 1-2 (MFIs): MENA typology vs. the Yunus and Weber classification
Legend: green zone (6), yellow zone (2) and red zone (45) according to the Yunus and Weber classification
Source: our design
A 15% financial margin did not preclude MFIs in the "red zone" from targeting poor women. Some MFIs in Category 1 record low financial expenses, whereas others in Category 4 face high financial expenses with a less productive staff and an excessive default rate.
Over one out of 10 MFIs in our sample are located in the "green zone" and belong to category 3. According to Yunus and Weber (2007), the main objective of MFIs in this zone is to targeting poor, albeit our typology shows they are generating but a small financial margin and target rather non-poor men.
In the light of our typology, the Yunus and Weber classification is flawed. MFIs in the "red zone" may be socially effective as well as they can be non-profitable, whereas MFIs in the "green zone" are neither financially nor socially effective. Thresholds set by Yunus and Weber for the financial margin are irrelevant, and the financial margin as a criterion for ranking the orientation of an MFI proves inadequate. Hence, we must investigate the role of exogenous factors.
Éthique et économique/Ethics and Economics, 12(2), 2015
http://ethique-economique.net/ 58
4. THE EXTERNAL FACTORS INFLUENCING INTEREST RATES IN THE MENA REGION
4.1. Regulation
MFIs need regulation in order to grow, particularly to access funds from banks and markets. In half the MENA countries, MFIs are regulated (Appendix 2); however, regulation varies across countries as well as from an institutional status to another (Adair and Berguiga, 2010). In Palestine and Lebanon, some MFIs depend upon the Home Office, whereas laws governing associations apply to NGOs, and laws for commercial or banking firms to NBFIs. Other countries (Tunisia, Morocco, Egypt, Syria and Yemen) have enacted specific legislation for the microfinance industry that imposes a cap upon lending rates and prohibits deposit collection, which can affect the performance of MFIs.
Capping the lending rate was adopted to facilitate the access of the poor to credit, and reducing the financial burden of the MFI. The cap upon interest rates applied only to Tunisia and Morocco in 2008; since then, it has been implemented in at least six MENA countries. According to our typology, the Tunisian MFI belongs to Category 1: capped rates have a positive impact on its social performance as well as its financial margin, enabling to cover its costs and ensure profitability. In Morocco, six out of 10 MFIs in categories 1 and 4 are socially effective: capped rates have a positive effect on social performance; however, six out of 10 Moroccan MFIs also fall in categories 1 and 2, whereof the latter is not socially effective. In Morocco and Tunisia, capped rates would allow MFIs to achieving high financial margin and be profitable. Moreover, do MFIs really comply with capped rates? It is difficult to know because the effective interest rates are not transparent. According MIX & Sanabel (2009), MFIs do not comply with capped rates and most bill higher interest rates (Pearce, 2011; MIX & Sanabel, 2012).
Beyond its core credit business, an MFI can diversify its services with savings collection. Such collection is often restricted to banks or postal networks (MIX & Sanabel, 2010). MENA MFIs are prohibited to collect savings, except in Syria and Yemen. Yemen enacted a microfinance legislation in 2009. In Syria, a single law was devoted exclusively to microfinance by 2007; it authorizes the establishment of MFIs providing microfinance services, savings accounts and microinsurance (MIX & Sanabel, 2009). According to our typology, four of the five Yemeni MFIs included in category 4 are socially effective, whereas the Syrian MFIs included in Category 3 are socially inefficient (Figure 11). In both countries, MFIs achieve low financial margin; in as much as they collect (small) deposits, financial expenses rise due to the payment of interest as well as operational expenses because their staff is dedicated to savings management; however, customers seem to be faithful to their MFIs.
4.2. Competition
Market power is a major factor contributing to the high level of lending rates that is above those of commercial banks, especially for MFIs that often act as if they have a local monopoly (CGAP, 2001; McIntosh et al, 2005). Competition is increasing in the microfinance industry for many countries (Porteous, 2006). It should not only benefit consumers by offering them a wider choice of products and providers, but also requires from each MFI to lower its lending rates in order to remain competitive by reducing operating
Éthique et économique/Ethics and Economics, 12(2), 2015
http://ethique-economique.net/ 59
costs, thus increasing its effectiveness (Boye et al, 2008). The literature identifies various measures of competition: the concentration indexes (Herfindahl-Hirshman Index, bank concentration ratio) gauge competition in terms of numbers, whereas H-statistic and the Lerner index measure it in terms of degree. These measures were subject to criticism (Bikker and Haaf, 2002; Angelini and Ceterolli, 2003).
Several proxies have been used to measure the intensity of competition in the microfinance industry. Such as the number or variation in the number of MFIs per country (McIntosh et al, 2005; Hatarska and Nadolnyak, 2007), the percentage of borrowers in the adult population (Cotler and Almazan, 2013), the market share held by the four largest MFIs in a given country (Olivares-Polanco, 2005) and the Lerner index (Assefa et al, 2010). Competition is also measured for group lending MFIs, with respect to the presence, number and geographic distance with the competitors offering group loans (McIntosh et al, 2005). Cull et al (2009) apprehend competition at the country level rather than at institutional level: they gauge competition of MFIs vis-à-vis banks with penetration variables (number of branches per capita and density). The outcomes from these various ad hoc measurements of competition prove somehow difficult to compare.
Table 2. Indicators of competition across MENA MFIs (2008)
Source: our calculus from PovcalNet (2008) and the MIX (2008)
Assuming there no other competitors, such as banks that exclude the poor and informal lenders, we examine three measurements of competition from the demand side among MFIs in the MENA region. First, the number and penetration rate of MFIs; second, the market share of the first two MFIs for every MENA country; and third, a weighted concentration effect that we design as the gap in the number of borrowers for every MENA country to the median number of borrowers (Appendix 1).
MFIs (13) are quite a few in Egypt, but only 5.4% of the population below the $ 2 / a day poverty line access microfinance (Table 2): the rate of penetration is very low, albeit higher than in Yemen. Jordan has the highest penetration rate exceeding 100%, with seven MFIs that target both the poor as well as the non-poor: according to our typology, four of these MFIs listed in categories 2 and 3 are not socially effective (Figure 11). Hence, the penetration rate is not the best measurement for competition although it takes into account the demand side.
Country Number of MFIs
Rate of penetration
Market share of the first two MFIs
Gap to the weighted median Egypt 13 5.4% 39% 46.0582012 Iraq 3 0.5% 96% 6.028 Jordan 7 111.7% 54% 16.4115918 Lebanon 3 - 98% 5.26177778 Morocco 10 32.6% 64% 114.199578 Palestine 8 54.1% 38.5% 2.9561875 Syria 2 1.7% 100% 5.53725 Tunisia 1 16.7% 100% 0 Yemen 6 0.2% 56% 3.46888889
Éthique et économique/Ethics and Economics, 12(2), 2015
http://ethique-economique.net/ 60
As regards market power, MFIs in Tunisia and Syria are respectively a monopoly and duopoly (Table 2). The Enda Tunisian MFI listed in category 1 requires a high 33% rate from its clients who are poor women. In contrast, the two Syrian MFIs from category 3 apply a very low interest rate: they are inefficient and did not use their market power to cover their costs with an increase in lending rates. Market power is important for the first two MFIs in Morocco and Jordan: respectively 64% and 54% of clients. MFIs in Egypt (13) and Palestine (8) compete: the first two MFIs gather respectively 39% and 38.5% of customers. Unlike Palestine, competition in Egypt has a positive impact on social performance and effectiveness of the MFIs, the majority is in category 1: they have a very productive staff, are targeting the poor and implement high interest rates (above the median), upon which competition has no impact. The competition indicator based on the market share of the first two MFIs thus drives to mixed conclusions.
According to the effect of concentration, the higher the gap, the weaker is competition (Table 2). The outcomes confirm there is little competition in Morocco and Jordan, in tune with the market power index. However, the effect is also high in Egypt (46.05); which would imply the absence of competition, contrary to what the extent of market power suggested.
Figure 11. Axes 1-2: MENA MFIs and country specific effect (2008)
Legend: Egypt (E) 13 MFIs; Iraq (I) 3 MFIs; Jordan (J) 7 MFIs; Lebanon (L) 3 MFIs; Morocco (M)
10 MFIs; Palestine (P) 8 MFIs; Syria (S) 2 MFIs; Tunisia (T) 1 MFI and Yemen (Y) 6 MFIs.
Éthique et économique/Ethics and Economics, 12(2), 2015
http://ethique-economique.net/ 61
4.3. Inflation
Inflation can be a significant barrier to the development of MFIs: the level of real interest rates does not only reduce the demand of the poor but also undermines the sustainability of microfinance. In the context of high inflation, real lending interest rate may become negative: MFIs must choose between negative real interest rates, which damage their loan portfolio, or nominal rates that cover inflation.
The inflation rate in the MENA region in 2008 was very high in Yemen (18.97%), Egypt (18.31%), Syria (15.74%) and Jordan (14.92%); it had a different impact on the expense of (nominal and real) interest rate for MFIs in Jordan and Syria. In Syria, inflation triggered a negative real portfolio yield (-7%), the expense of nominal interest rate (7.45%) was far below the inflation rate (15.74%). Syrian MFIs as of Category 3 recorded very low financial margin and proved unprofitable; they were urged to increase their nominal interest rate to offset the increase in inflation after 2008. Given the same situation of rising inflation in 2008, Jordan MFIs have set on average a 33% nominal interest rate, significantly higher (over the double) than the inflation rate, and benefited from a positive real interest rate (13.64%). Five of the seven MFIs as of categories 1 and 2 were able to achieve high financial margin to cover their expenses, including inflation and be profitable (Figure 11).
C
ONCLUSIONWe study the lending interest rates of a panel of 66MFIs in the MENA region over the period 2004-2012 in order to explain why they are set at high level. The examination of the internal components shows that operating costs are the main determinant of lending rates, followed by loss provisions and financial expenses. The financial margin that is included in the lending rate depends upon operating costs in the first place and not profitability.
We design a multivariate factor analysis of 53 MFIs in 2008 focusing on the relationship between the financial margin and social performance. Most MFIs in the MENA region are profitable while applying a high interest rate that borrowers would be able to bear. From clustering analysis, we build a typology into four categories of MFIs that we compare to the three zones classification of Yunus and Weber (2007). The thresholds thereof are irrelevant and the choice of the financial margin as a guiding criterion of MFIs proves inadequate. Three other external factors affect the financial margin: competition among MFIs, regulations and inflation in the countries of the MENA region where they operate. The impact of competition on the lending rate and social performance differs according to measurements that do not match. Regulatory caps are set on lending rates and the collection of deposits is usually prohibited; most MFIs charge interest rates above caps and those collecting deposits seem to be socially effective. The rise in inflation has a negative effect upon the level of lending rates; hence, MFIs must often increase their rates to avoid deterioration of the loan portfolio.
The setting of an adequate level for lending rates is critical for MFIs in the MENA region in order to be both competitive and profitable, while avoiding social mission drift. However, in the absence of transparent pricing (Microfinance Transparency, 2010), microfinance cannot develop as socially effective and financially sustainable because stakeholders (customers, regulators, donors, competing MFIs, etc.) cannot make informed decisions.
Éthique et économique/Ethics and Economics, 12(2), 2015
http://ethique-economique.net/ 62
Our multivariate factor analysis focused on 2008, thanks to the availability of data and the outcomes of a previous study (Adair and Berguiga, 2010); however, it faces an inherent limitation to any cross-section approach. Thus, we will next use panel data analysis upon the microfinance interest rates in the MENA region. This should complement our research on the interactions between social performance and financial performance (Adair and Berguiga, 2014), which is the heart of the microfinance issues.
R
EFERENCESAcclassato H. D. (2008). ‘Taux d'intérêt effectif, viabilité financière et financement des petits opérateurs économiques par les institutions de microfinance au Bénin’, Annals of Public and Cooperative Economics, 79(1):155-188.
Adair P. and Berguiga I. (2014). ‘How do the social and financial performance of microfinance institutions interact? A panel data study upon the MENA region (1998-2011)’, Savings & Development, 38(1): 1-20.
Adair P. et Berguiga I. (2010). ‘Les facteurs déterminants de la performance sociale et de la performance financière des institutions de microfinance dans la région MENA : une analyse en coupe instantanée’, Région et Développement, 32 : 91-119.
Armendariz de Aghion B., Morduch, J. Eds. (2005). The Economics of Microfinance, MIT Press, Cambridge, USA. Second ed. 2010.
Angelini, P., Cetorelli, N. (2003). ‘The Effects of Regulatory Reform on Competition in the Banking Industry”, Journal of Money, Credit, and Banking, 35: 663-684.
Assefa, E., Hermes, N., Meesters, A. (2010). ‘Competition and Performance of Microfinance Institutions’, University of Groningen, the Netherlands.
Ayayi, A., Séne, M. (2010). ‘What drives microfinance institution's financial sustainability?’. The Journal of Developing Areas, 44 (1): 303-324.
Bikker, J., Haaf, K. (2002). ‘Measures of Competition in the Banking Industry, Review of the Literature’, Economic and Financial Modelling, 9: 53-98.
Boyé, S., Hajdenberg, J., Poursat, C. Eds. (2008). Le guide de la micro finance, microcrédit et épargne pour le développement, Editions d’Organisations, Paris.
CGAP. (2004).‘L’impact du plafonnement des taux d’intérêt sur la microfinance’,Note sur la microfinance, 18,The World Bank, Washington DC, USA.
CGAP. (1997).Les taux d’intérêt applicables aux microcrédits, The World Bank, Washington DC, USA.
Cotler, P., Almazan, D. (2013). ‘The Lending Interest Rates in the Microfinance Sector: Searching for its Determinants’, The Business and Economics Research Journal, 6(1): 69-81. Cull, R., Demirgüç-Kunt, A., Morduch, J. (2006). ‘Financial Performance and Outreach: A Global Analysis of Leading Microbanks’, World Bank Policy Research Working Paper 3827,The World Bank, Washington DC, USA.
Cull, R., Demirgüç-Kunt, A., Morduch, J. (2009). ‘Microfinance meets the market’, Journal of Economic Perspectives, 23(1): 167-92.
Éthique et économique/Ethics and Economics, 12(2), 2015
http://ethique-economique.net/ 63
Fernando, N. A. Ed. (2006).Understanding and dealing with high interest rates on microcredit a note to policy makers in the Asia and Pacific region, East Asia department of the Asian Development Bank (ADB).
Gonzalez, A. (2010). ‘Analyzing microcredit interest rates: A review of the methodology proposed by Mohammed Yunus’, Mix data brief 4. Mixmarket.
Hatarska, V., Nadolnyak, D. (2007). ‘Do regulated microfinance institutions achieve better sustainability and outreach? Cross-country evidence’, Applied Economics, 39(10): 1207-1222.
Helms, B., Reille, X. (2004). ‘Interest Rate Ceilings and Microfinance: The Story So Far’, CGAP Occasional Paper 9, The World Bank. Washington DC, USA.
Hudon, M. (2007). ‘Fair interest rates when lending to the poor’,Ethics and Economics,5(1): 1-8.
Labie, M. (1996). ‘Perspective d’autonomie et pérennisation des systèmes financiers’,Revue Tiers-Monde, 145: 85 - 97.
Lahaye, E., Rizvanolli, R., Dashi, E. (2012). ‘Current Trends in Cross-Border Funding for Microfinance’, CGAP Brief, The World Bank, Washington DC, USA.
Ledgerwood, J. (1998). Microfinance Handbook: an institutional and financial perspective, The World Bank, Washington DC, USA. Third ed. 2000.
McIntosh, C., de Janvry, A., Sadoulet,E. (2005).‘How Rising Competition among Microfinance Institutions Affects Incumbent Lenders’,The Economic Journal, 115: 987-1004.
Microfinance Transparency. (2010). http://www.mftransparency.org/
MicroRate and Inter-American Development Bank. (2003). Indicateurs de Performance pour les Institutions de Microfinance, Guide Technique.Sustainable Development Department Micro, Small and Medium Enterprise Division, Washington DC, USA.
MIX & Sanabel. (2009). Benchmarking et analyse de la micro finance dans la région arabe, www.mixmbb.org
MIX & Sanabel. (2010). Benchmarking et analyse de la micro finance dans la région arabe, www.mixmbb.org
MIX & Sanabel. (2012). Benchmarking et analyse de la micro finance dans la région arabe, www.mixmbb.org
Olivares-Polanco, F. (2005). ‘Commercializing Microfinance and Deepening Outreach? Empirical Evidence from Latin America’,Journal of Microfinance,7: 47-69.
Pearce D. (2011). ‘Financial Inclusion in the Middle East and North Africa: Analysis and Roadmap Recommendations’,Policy Research Working Paper 5610, The World Bank, Washington DC, USA.
PovcalNet. (2008).www.worldbank.org
Porteous, D. (2006). ‘Competition and Microcredit Interest Rates’, CGAP Focus Note 33, The World Bank, Washington DC, USA.
Éthique et économique/Ethics and Economics, 12(2), 2015
http://ethique-economique.net/ 64
Roberts P. W. (2013).‘The profit orientation of Microfinance Institutions and effective interest rates’,World Development, 41: 120-131.
Rosenberg, R., Gonzalez, A.,Nahrain,S. (2009).‘The New Moneylenders: Are the Poor Being Exploited by High Microcredit Interest Rates?’, CGAP Occasional Paper, 15, The World Bank, Washington DC, USA.
Rosenberg, R., Gaul, S., Ford, W.,Tomilova,O. (2013). Microcredit Interest Rates and Their Determinants: 2004–2011, Access to Finance Forum Reports by CGAP and its Partners 7, The World Bank, Washington DC, USA.
Yunus, M., Weber, K. (2007). Creating a World without Poverty: Social Business and the Future of Capitalism. New York: Public Affairs.
Éthique et économique/Ethics and Economics, 12(2), 2015
http://ethique-economique.net/ 65
Appendix1. Multivariate factor analysis: a dictionary of variables
Variables Definitions Sources
Depth of outreach (Depth)
Comparison between poverty thresholds ($ 1.25 and $ 2/a day) according to Gross National Income per capita (GNI) and Average Loan per borrower according to GNI per capita (ALGNI)
WDI, MIX, PovcalNet
Loan size (ALGNI) Average Loan per borrower according to GNI per capita (Adjusted) Return On
Assets (ROAA)
Adjusted Operating Profit before subsisdies / Average Total Assets
MIX, IMF
(Nominal) lending interest rate
Financial Revenue / Loan Portfolio MIX
(Nominal) payable interest rate
Financial expenses / Liabilities MIX
Financial margin (premium)
Portfolio performance – Cost of funds = Lending interest rate – Payable interest rate
MIX
Operating expense ratio
Operating expenses/Average outstanding loans MIX
Productivity of personnel (PP)
Number of borrowers / Number of Staff MIX
Portfolio At Risk (PAR)
Portfolio At Risk >30 days / Loan Portfolio MIX
Loan loss rate Amount written-off over the period / Outstanding value MIX Risk coverage ratio Provision for loan losses / PAR MIX Women Borrowers
(FE)
% of women borrowers MIX
Regulation Qualitative (regulated vs.unregulated) MIX,
CGAP Institutional status Qualitative (NGOs vs. other MFIs) MIX Gap to the weighted
median
Number of borrowers per country - median number of borrowers per country / Number of MFIs per country
MIX
Market share of the first two MFIs
Total number of clients in the first two MFIs / Total number of clients in the country
MIX
Penetration rate Number of borrowers / Size of the population below the $ 2 poverty line
MIX, PovcalNet Source: authors
Éthique et économique/Ethics and Economics, 12(2), 2015
http://ethique-economique.net/ 66
Appendix 2. Characteristics of the 53 IMF (2008)
Legend: Egypt (E), Iraq (I), Jordan (J), Lebanon (L), Morroco (M), Palestine (P), Syria (S), Tunisia (T), Yemen (Y) Source: authors E I J L M P S T Y Total Infant (<5 years) 3 3 2 0 1 2 1 0 4 16 Young (5-8 years) 1 0 0 1 2 0 1 0 2 7 Age Mature (> 8 years) 9 0 5 2 7 6 0 1 0 30 Rural 6 0 2 1 5 5 2 0 0 21 Operating area Urban 7 3 5 2 5 3 0 1 4 30 Joint-guarantee 9 0 3 0 7 1 0 0 4 24 Loan methodology Individual 4 3 4 3 3 7 2 1 2 29 NGO 13 3 3 2 10 4 2 1 5 43 Institutional
status Non NGO 0 0 4 1 0 4 0 0 1 10
Regulated 0 1 2 1 10 5 0 1 0 20
Regulation
/Subject (D:20150602134857+02’00’) /ModDate () /Keywords (PDFCreator Version 0.9.5) /Creator (D:20150602134857+02’00’) /CreationDate (aurecari) /Author -mark-