HAL Id: hal-01008825
https://hal.archives-ouvertes.fr/hal-01008825
Submitted on 8 Nov 2018
HAL is a multi-disciplinary open access archive for the deposit and dissemination of sci-entific research documents, whether they are pub-lished or not. The documents may come from teaching and research institutions in France or abroad, or from public or private research centers.
L’archive ouverte pluridisciplinaire HAL, est destinée au dépôt et à la diffusion de documents scientifiques de niveau recherche, publiés ou non, émanant des établissements d’enseignement et de recherche français ou étrangers, des laboratoires publics ou privés.
Reliability-based approach for the stability analysis of
shallow circular tunnels driven by a pressurized shield
Guilhem Mollon, Daniel Dias, Abdul-Hamid Soubra
To cite this version:
Guilhem Mollon, Daniel Dias, Abdul-Hamid Soubra. Reliability-based approach for the stability analysis of shallow circular tunnels driven by a pressurized shield. 2nd International Conference on Computational Methods in Tunneling (EURO:TUN 2009), Sep 2009, Bochum, Germany. �hal-01008825�
Reliability-based approach for the stability analysis of
shallow circular tunnels driven by a pressurized shield
Guilhem MOLLON1, Daniel DIAS2 and Abdul-Hamid SOUBRA3
1
PhD Student, INSA Lyon, Université de Lyon, LGCIE Domaine B, 69621 Villeurbanne Cedex, France. E-mail: [email protected],
2
Associate Professor, INSA Lyon, Université de Lyon, LGCIE Domaine B, 69621 Villeurbanne Cedex, France. E-mail: [email protected],
3
Professor, University of Nantes, Civil Engineering Department, Bd. de l’université, BP 152, 44603 Saint-Nazaire cedex, France. E-mail: [email protected]
Abstract
A probabilistic analysis of the stability of a shallow circular tunnel driven by a pressurized shield in a frictional and cohesive soil is presented. A deterministic model based on numerical simulations is used. The response surface methodology is employed for the assessment of the Hasofer-Lind reliability index. Only the soil shear strength parameters are considered as random variables. The assumption of uncorrelated variables was found conservative in comparison to the one of negatively correlated parameters. Also, it was found that the hypothesis of nonnormal distribution for the random variables has almost no effect on the reliability index for the practical range of values of the applied pressure.
1 INTRODUCTION
The stability analysis of tunnels driven by a pressurized shield is commonly performed using deterministic approaches. A reliability-based approach is more rational since it enables one to consider the inherent uncertainty of the input parameters. In this paper, a reliability-based analysis of a shallow circular tunnel driven by a pressurized shield in a c-ij soil is presented. The deterministic model involves the tunnel face stability and focuses on the computation of the tunnel collapse pressure (i.e. the active pressure). The response surface methodology is used to find an approximation of the analytically-unknown performance function and the corresponding reliability index. The random variables considered in the analysis are the soil shear strength parameters c and ij. After a brief description of the deterministic model, the reliability analysis is presented. Then, the probabilistic numerical results are presented and discussed.
2 DETERMINISTIC MODEL
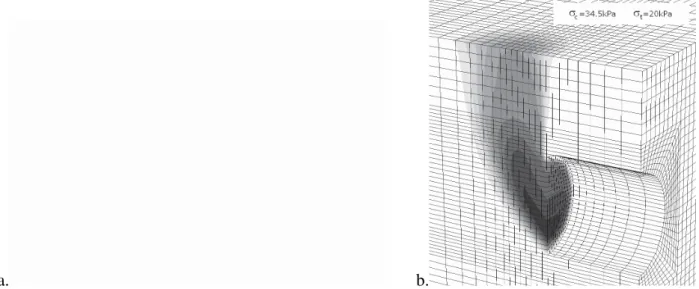
This section focuses on the computation of the tunnel face collapse pressure of a shallow circular tunnel driven by a pressurized shield using the finite difference
code FLAC3D. A circular tunnel of diameter D=10m and cover C=10m (i.e.
C/D=1) driven in a c-ij soil is considered in this paper (Fig.1a). A three-dimensional non uniform mesh is used. The present model is composed of approximately 27,000 zones. The tunnel face region was subdivided into 198 zones since very high stress gradients are developed in that region. For the displacement boundary conditions, the bottom boundary was assumed to be fixed and the vertical boundaries were constrained in motion in the normal direction. A conventional elastic-perfectly plastic model based on the Mohr-Coulomb failure criterion was adopted to represent the soil, with the following parameters: E=240MPa, Ȟ=0.3, ij=17°, c=7kPa, ȥ=0°, and Ȗ=18kN/m3. For the determination of the collapse face pressure, a stress control approach is used [3]. The deterministic tunnel face collapse pressure was found equal to ıc=34.5kPa. The
collapse velocity field given by FLAC3D when the applied pressure is smaller than ıc is provided in Fig.1b. Stability against collapse is ensured as long as the
a. b.
Figure 1: a. Mesh and dimensions of the FLAC3D model ; b. Velocity field for
σ
t<σ
c3 RELIABILITY ANALYSIS
The reliability index is a measure of the safety that takes into account the inherent uncertainties of the input parameters. A widely used reliability index is the Hasofer and Lind index. Its matrix formulation is:
(
)
(
x)
T x F x HLx
μ
C
x
μ
β
=
−
−−
∈ 1min
(1)in which x is the vector representing the n random variables, ȝx is the vector of
their mean values and C is their covariance matrix. Due to the relatively low effect of the elastic modulus E and the Poisson ratio Ȟ on the tunnel collapse pressure, only c and ij will be considered as random variables. Thus, in the present paper, the vector x of random variables in equation (1) includes the soil cohesion and angle of internal friction. The minimization of equation (1) is performed subject to the constraint G
( )
x ≤0 where the limit state surface G( )
x =0 separates the n-dimensional domain of random variables into two regions: a failure region F where G( )
x ≤0 and a safe region where G( )
x >0. The performance function of the present problem is given by:1
−
=
c tG
σ
σ
(2)From the First Order Reliability Method (FORM) and the Hasofer-Lind reliability index βHL, one can approximate the failure probability as Pf ≈Φ
(
−βHL)
where( )
⋅Φ is the cumulative distribution function of a standard normal variable. In this method, the limit state function is approximated by a hyperplane (i.e. a straight line in the case of two variables) tangent to the limit state surface at the design point.
It should be emphasized here that when using numerical simulations for the deterministic model as is the case in the present paper, the closed form solution of the performance function is not available. Thus, the determination of the reliability index is not straightforward. An algorithm based on the response surface methodology (RSM) proposed by [4] is used in this paper in the aim to calculate the reliability index and the corresponding design point. The basic idea of this method is to approximate the performance function by an explicit function of the random variables, and to improve the approximation around the design point (point of maximum probability of failure) via iterations. The approximate performance function widely used in literature has a quadratic form. It uses a second order polynomial with squared terms. The expression of this approximation is given by:
( )
¦
¦
= = + + = n i i i n i i i x b x a a x G 1 2 1 0 . . (3)where xi are the random variables, n is the number of the random variables and
(
a ,i bi)
are the coefficients to be determined. In this paper, two random variablesc and ϕ are considered (i.e. n=2). A brief explanation of the algorithm used is as follows:
1- Evaluate the performance function G(x) at the mean value point ȝ and the 2n points each at μ ±kσ where k is usually equal to 1 (this parameter may be varied in some cases if necessary);
2- The above 2n+1 values of G(x) can be used to solve equation (3) for the coefficients(ai, bi). This provides a tentative response surface function;
3- Solve equation (1) to obtain a tentative design point and a tentative ȕHL
subject to the constraint that the tentative response surface function of step 2 be equal to zero;
4- Repeat steps 1 to 3 until convergence. Each time step 1 is repeated, the 2n+1 sampled points are centred at the new tentative design point of step 3.
Notice finally that steps 2 and 3 were done using the optimization tools in Microsoft Excel. However, step 1 was performed using deterministic FLAC3D calculations. This iterative method leads to the so-called design point (c*,ij*), which is the point of maximum probability of failure.
4 PROBABILISTIC NUMERICAL RESULTS
The values used in this paper for the statistical moments of the shear strength parameters belong to the intervals proposed in the literature and are given as follows:
μ
c=
7
kPa
,μ
ϕ=
17
$,COV
c=
20
%
, andCOV
ϕ=
10
%
. For the probability distribution of the random variables, two cases are studied. In the first case, referred to as normal variables, c and ij are considered as normal variables. In the second case, referred to as nonnormal variables, c is assumed to be lognormally distributed while ij is assumed to be bounded and a beta distribution is used [1]. The parameters of the beta distribution are determined from the mean value and standard deviation of ij [2]. A negative correlation between c and ij with(
ρc,ϕ =−0.5)
is assumed to exist when these random variables are considered as correlated.A convergence criterion on the reliability index was adopted. It considers that convergence is reached when a difference (in absolute value) smaller than 10-2 between two successive reliability indices is achieved. This criterion was reached after 3 to 5 iterations. Thus, only 15 to 25 numerical simulations by FLAC3D were necessary. The corresponding average CPU time required is about 20 X 90 minutes = 1800 minutes (i.e. 30 hours) on a 2.4 GHz quad-core CPU. When σt=70 kPa, a value of 3.50 was found for the reliability index in the case of
uncorrelated (
ρ
c,ϕ=
0
) variables, and a value of 4.47 for correlated ( ρc,ϕ =−0.5) variables. These values correspond to failure probabilities of respectively2.3 10
×
−4 and4.0 10
×
−6 as calculated by FORM approximation.a. b.
Figure 2: a. Reliability index versus the applied face pressure ; b. CDF of the tunnel face pressure for normal variables
The Hasofer-Lind reliability index versus the applied pressure ıt is given in Fig.
2a. The cases of normal, nonnormal, correlated
(
ρc,ϕ =−0.5)
and uncorrelated(
ρc,ϕ =0)
shear strength parameters are considered. The reliability index decreases with the decrease of the applied pressure until it vanishes for an applied pressure equal to the deterministic collapse pressure. This case corresponds to a deterministic state of failure for whichσ σ
t=
c using the mean values of the random variables for normal variables (or the equivalent normal mean values fornon normal variables) and the failure probability is equal to 50%. The
comparison of the results of correlated variables with those of uncorrelated variables shows that the reliability index corresponding to uncorrelated variables is smaller than the one of negatively correlated variables. One can conclude that the hypothesis of uncorrelated shear strength parameters is conservative in comparison to the one of negatively correlated parameters. For instance, when the applied pressure is equal to 60kPa, the reliability index increases by 30% if the variables c and ij are considered as negatively correlated. The reliability index of nonnormal variables is slightly greater than that of normal variables. For the same pressure of 60kPa, the reliability index increases by only 5% if the variables are considered as nonnormal.
The CDF of the face pressure is given in Fig. 2b. As expected, the CDF (which is equal to the probability of failure) tends to 1 when the applied pressure decreases
(especially when ıt<20kPa) and is very small (close to zero) when the applied
pressure becomes high (especially when ıt>60kPa). It appears that the distribution
of the tunnel face pressure is more spread out in the case of uncorrelated variables. Consequently, the assumption of negative correlation between c and ij reduces the variance of the tunnel face pressure.
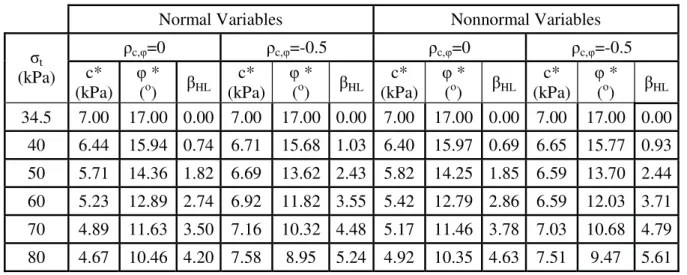
Table 1: Values of the design point and reliability index for different values of the tunnel applied pressure, for normal, nonnormal, correlated and uncorrelated random variables.
Normal Variables Nonnormal Variables ȡc,ij=0 ȡc,ij=-0.5 ȡc,ij=0 ȡc,ij=-0.5 ıt (kPa) c* (kPa) ij * (o) ȕHL c* (kPa) ij * (o) ȕHL c* (kPa) ij * (o) ȕHL c* (kPa) ij * (o) ȕHL 34.5 7.00 17.00 0.00 7.00 17.00 0.00 7.00 17.00 0.00 7.00 17.00 0.00 40 6.44 15.94 0.74 6.71 15.68 1.03 6.40 15.97 0.69 6.65 15.77 0.93 50 5.71 14.36 1.82 6.69 13.62 2.43 5.82 14.25 1.85 6.59 13.70 2.44 60 5.23 12.89 2.74 6.92 11.82 3.55 5.42 12.79 2.86 6.59 12.03 3.71 70 4.89 11.63 3.50 7.16 10.32 4.48 5.17 11.46 3.78 7.03 10.68 4.79 80 4.67 10.46 4.20 7.58 8.95 5.24 4.92 10.35 4.63 7.51 9.47 5.61
Table 1 presents the Hasofer-Lind reliability index and the corresponding design point for different values of the applied pressure ıt. The cases of normal,
nonnormal, correlated
(
ρc,ϕ =−0.5)
and uncorrelated(
ρc,ϕ =0)
shear strength parameters are considered. Table (1) shows that for uncorrelated shear strength parameters, the values ofc
* andϕ
* at the design point are smaller than their respective mean values and decrease with the increase of the applied pressure. For negatively correlated shear strength parameters,c
* slightly exceeds the mean for some values of the applied pressure. This can be explained by the counter clockwise rotation of the critical dispersion ellipse due to the negative correlation [3]. The position of the design point, which is the point of tangency between the critical ellipse and the limit state surface, changes from the one found for uncorrelated soil shear strength parameters. A higher value ofc
* and a lower value ofϕ
* were found in case of negative correlation. Consequently,c
* can become greater than the mean value for a negative correlation. This conclusion is similar to that found by [5].5 CONCLUSION
A reliability-based analysis of the stability of a shallow circular tunnel driven by a pressurized shield in a c-ij soil is presented. A deterministic model based on numerical simulations using the finite difference code FLAC3D is employed. The assessment of the tunnel reliability was performed using the Hasofer-Lind reliability index. The response surface methodology was used to find an approximation of the analytically-unknown limit state surface and the corresponding reliability index. Only the soil shear strength parameters are considered as random variables. The hypothesis of uncorrelated shear strength parameters was found conservative in comparison to the one of negatively correlated variables. The assumption of nonnormal distribution for the random variables has almost no effect on the reliability index for the practical range of values of the applied pressure. Finally, it was found that the negative correlation between random variables leads to a less spread out distribution of the tunnel pressure than the case of uncorrelated shear strength parameters. This means that the negative correlation between random variables decreases the variance of the tunnel face pressure.
REFERENCES
[1] Fenton, G. A., and Griffiths, D. V. (2003). "Bearing capacity prediction of spatially random C-ij soils." Can. Geotech. J., 40, 54-65.
[2] Haldar, A., and Mahadevan, S. (2000). Probability, reliability, and statistical methods in engineering design, Wiley, New York.
[3] Mollon, G., Dias, D., and Soubra, A-H. (2009) "Probabilistic study of circular tunnels in homogeneous soils using response surface methodology"
J. of Geot. & Geoenv. Eng. (in press)
[4] Tandjiria, V., Teh, C.I., and Low, B.K. (2000). "Reliability analysis of laterally loaded piles using response surface methods." Struct. Safety, 22, 335-355.
[5] Youssef Abdel Massih, D. S. and Soubra, A.-H. (2008). "Reliability-based analysis of strip footings using response surface methodology." Int. J. of