HAL Id: hal-01009763
https://hal-univ-rennes1.archives-ouvertes.fr/hal-01009763
Submitted on 4 Sep 2014
HAL is a multi-disciplinary open access
archive for the deposit and dissemination of
sci-entific research documents, whether they are
pub-lished or not. The documents may come from
teaching and research institutions in France or
abroad, or from public or private research centers.
L’archive ouverte pluridisciplinaire HAL, est
destinée au dépôt et à la diffusion de documents
scientifiques de niveau recherche, publiés ou non,
émanant des établissements d’enseignement et de
recherche français ou étrangers, des laboratoires
publics ou privés.
Prevalence and impact of frailty on mortality in elderly
ICU patients: a prospective, multicenter, observational
study.
Pascale Le Maguet, Antoine Roquilly, Sigismond Lasocki, Karim Asehnoune,
Elsa Carise, Marjorie Saint Martin, Olivier Mimoz, Grégoire Le Gac,
Dominique Somme, Catherine Cattenoz, et al.
To cite this version:
Pascale Le Maguet, Antoine Roquilly, Sigismond Lasocki, Karim Asehnoune, Elsa Carise, et al..
Prevalence and impact of frailty on mortality in elderly ICU patients: a prospective, multicenter,
observational study.. Anaesthesia and Intensive Care Medicine, Elsevier Masson, 2014, 40 (5),
pp.674-82. �10.1007/s00134-014-3253-4�. �hal-01009763�
Prevalence and impact of frailty on mortality in elderly ICU patients: A prospective,
multicenter, observational study
Running title: Frailty and critically ill patients
Pascale LE MAGUET1, Antoine ROQUILLY2, Sigismond LASOCKI3, Karim ASEHNOUNE2, Elsa CARISE4, Marjorie
SAINT MARTIN3, Olivier MIMOZ4,5,6, Grégoire LE GAC1, Dominique SOMME7,8, Catherine CATTENOZ7, Fanny
FEUILLET9, Yannick MALLEDANT1, 8,10 , Philippe SEGUIN1,8,10
1CHU Rennes, Département d’Anesthésie Réanimation, Rennes, France
2CHU Nantes, Département d’Anesthésie Réanimation, Nantes, France
3CHU Angers, Département d’Anesthésie Réanimation, Angers, France
4CHU Poitiers, Département d’Anesthésie Réanimation, Poitiers, France
5
Inserm Eri 23, Poitiers, France 6Université Poitiers, Poitiers, France
7CHU Rennes, Service de Gériatrie, Rennes, France
8Université Rennes 1, Rennes, France
9EA 4275 “Biostatistique, Pharmacoépidémiologie et Mesures Subjectives en Santé” Nantes, France
10Inserm U991, Rennes, France
Corresponding author and address for reprints: Dr. Philippe SEGUIN, Hôpital Pontchaillou, Service d’Anesthésie-Réanimation 1, d’Anesthésie-Réanimation Chirurgicale, Hôpital de Pontchaillou, 2 rue Henri Le Guilloux, 35033 Rennes Cedex 9, France. Tel: 33.2.99.28.42.46; Fax: 33.2.99.28.24.21; e-mail: philippe.seguin@chu-rennes.fr
Conflict of interest statement. PLM, AR, EC, MSM, OM, GLG, DS, CC, FF, YM, and PS declare that they have no conflicts of interest. SL has received consulting fees from Viforpharma. KA has received lecturing and consulting fees from Braun, Astellas, and Fresenius.
Abstract
Purpose: Frailty is a recent concept used for evaluating elderly individuals. Our study determined the prevalence of frailty in intensive care unit (ICU) patients and its impact on the rate of mortality.
Methods: A multicenter, prospective, observational study performed in four ICUs in France included 196 patients aged ≥65 years hospitalized for >24 hours during a 6-month study period. Frailty was determined using the frailty phenotype (FP) and the clinical frailty score (CFS). The patients were separated as follows: FP score <3 or ≥3 and CFS < 5 or ≥ 5.
Results: Frailty was observed in 41% and 23% of patients based on a FP score ≥3 and a CFS ≥5, respectively. At admission to the ICU, the Simplified Acute Physiology Score II (SAPS II) and Sequential Organ Failure Assessment (SOFA) scores did not differ between the frail and nonfrail patients. In the multivariate analysis, the risk factors for ICU mortality were FP score ≥3 (hazard ratio [HR], 3.3; 95% confidence interval [CI], 1.6-6.6; p<0.001), male gender (HR, 2.4; 95% CI, 1.1-5.3; p=0.026), cardiac arrest before admission (HR, 2.8; 95% CI, 1.1-7.4; p=0.036), SAPS II score ≥ 46 (HR, 2.6; 95% CI, 1.2-5.3; p=0.011), and brain injury before admission (HR, 3.5; 95% CI, 1.6-7.7; p=0.002). The risk factors for 6-month mortality were a CFS ≥5 (HR, 2.4; 95% CI, 1.49-3.87; p<0.001) and a SOFA score ≥7 (HR, 2.2; 95% CI, 1.35-3.64; p=0.002). An increased CFS was associated with significant incremental hospital and 6-month mortalities.
Conclusions: Frailty is a frequent occurrence and is independently associated with increased ICU and 6-month mortalities. Notably, the CFS predicts outcomes more effectively than the commonly used ICU illness scores.
Introduction
With increased life expectancy and improved medico-surgical procedures, the number of elderly patients admitted to intensive care units (ICUs) has been increasing and is expected to increase dramatically in the next decade [1-3]. However, controversies exist regarding aging as a risk factor for mortality in ICUs. Currently, identifying elderly patients who may or may not benefit from intensive treatment remains challenging, and the final decisions may be subjective [4-10]. The scoring systems currently used do not precisely assess co-morbidity and prehospital functional status or disability. Moreover, the mechanisms underlying the aging process are heterogeneous. Therefore, clinicians need a method for quantifying the interindividual variability in aging rate [11].
To achieve this objective, frailty has been recently established as a concept that is primarily investigated in the elderly population and is distinct from disability or co-morbidity [12, 13]. Frailty is characterized by a loss of physiological reserves and, consequently, an inability to maintain homeostasis to combat a disease or injury [12, 13]. The common signs and symptoms of frailty include fatigue, weight loss, weakness, low activity level, slow motor performance, and cognitive loss [12, 14]. Frailty has been associated with increased morbidity and mortality in emergency and geriatric medicine and surgery [15, 16], but it has been poorly investigated in critically ill patients [17, 18]. Therefore, understanding the relationship between frailty and ICU outcomes is becoming increasingly important.
The aim of our study was to determine the prevalence of frailty and the impact of frailty on mortality in a prospective cohort of patients older than 65 years who were admitted to ICUs.
Materials and methods
This prospective, observational study was conducted in four university-affiliated hospitals in France (Rennes, Nantes, Angers, and Poitiers). Recruitment was conducted from November 1, 2011, to May 1, 2012. As a non-interventional study, the local ethics committee waived the need for informed consent according to French legislation (Comité d’Ethique du CHU de Rennes, France, no 11.39).
All of the patients aged ≥65 years and hospitalized for >24 hours in the ICU were considered to be eligible for inclusion in the study. Patients were excluded if they had no proxies or could not be interviewed. For patients readmitted to the ICU,
only the first ICU hospitalization was considered. All of the patients included in the study were followed for 6 months or until death.
Data collection
Age, gender, and body mass index were recorded for each patient at the time of ICU admission. The reasons for ICU admission (medical, scheduled and unscheduled surgery, and trauma) and, more specifically, data regarding brain injury, cardiac arrest, and the presence of an infection at the time of ICU admission were collected. The severity of illness was assessed according to the Simplified Acute Physiology Score II (SAPS II) [19], the modified SAPS II (SAPS II without age) score, the Sequential Organ Failure Assessment (SOFA) score [20], and the Glasgow Coma Scale. Life expectancy was estimated using the McCabe classification [21].
During the patients’ hospitalization, the following data were collected: the occurrence of severe sepsis, septic shock, acute renal failure, and acute respiratory distress syndrome; the number of acquired infections per patient; the need for dialysis; the duration of mechanical ventilation; and the need for surgery [22, 23]. The use of corticosteroids, neuromuscular blocking agents, and vasopressors was recorded. The rates of limitation and discontinued treatment were also documented.
The multi-dimensional syndrome of frailty in elderly, critically ill patients was assessed using two scales [12, 17]. There is no clear consensus regarding the definition of frailty, and, schematically, two operational approaches have been proposed [13]. Fried et al. validated the first operational definition, i.e., the frailty phenotype (FP), which views frailty as a biological syndrome resulting from cumulative decline across multiple physiological systems and contains 5 criteria (shrinking, weakness, slowness, low-level physical activity, and self-reported exhaustion) [12, 24]. All five components were considered from the previously reported definition and adapted to the ICU environment (Table 1, electronic supplementary material [ESM]) [12, 24]. The patients were considered to be frail if they had 3 or more frailty components among the 5 criteria [12]. The second scale, the clinical frailty score (CFS), which has been adapted from the clinical frailty scale developed by Rockwood et al., views frailty as a multidimensional risk state that can be better measured by the quantity rather than by the nature of the health problems (cumulative deficit model) [17, 25]. The CFS ranges from 1 (very fit) to 9 (terminally ill), with frailty ranging from scores of 5 to 8 (mildly, moderately, severely, and very severely frail). The patients were considered to be frail when the CFS was ≥5 (Table 2, ESM) [17]. Moreover, the FP score and the CFS were
each separated into 4 categories (from nonfrail to the most severely frail/terminally ill; FP score 0, 1-2, 3, and >3 and CFS 1-3, 4, 5, and >5), and the hospital and 6-month mortalities were studied for each category.
Furthermore, disability was quantified using the Katz Index of Independence in activities of daily living (ADL), which assesses the ability of patients to perform the daily activities of bathing, dressing, toileting, transferring, continence, and feeding. This index correlates with physical dependence. Patient dependence was described in 1 of 2 manners for each function: independent (1 point) or dependent (0 point). The ADL score ranges from 0 (complete dependence) to 6 (complete independence) [26]. The burden of co-morbidity was quantified using the Charlson Co-morbidity Index, which is based on the assignment of co-morbidities observed in patients in one of several categories [27]. A weighted score is assigned to each co-morbidity based on the relative risk of 1-year mortality. The sum of the index scores is an indicator of disease burden and a predictor of death [27]. Memory status was assessed by asking relatives if they had noticed whether the patient had exhibited memory problems in the last 6 months. It was quantified as present if the patient had trouble remembering the names of people he/she had recently met, had trouble remembering the flow of a conversation, and had an increased tendency to misplace items.
The FP, CFS, Katz Index of Independence in ADL, and presence or absence of a memory disorder were obtained as soon as possible from the patient, when possible, or his/her relatives. The Charlson Co-morbidity Index was obtained from the patient, when possible, or his/her relatives (spouse, children, and sibling(s)); the referring physician; and the patient’s medical charts. Moreover, based on the possible interference between these scores and the acute illness requiring ICU admission, the patient or his/her relatives were asked to extrapolate the patient’s status one month before hospital admission.
The ICU and hospital lengths of stay and the ICU, hospital, and 6-month mortalities were recorded. Finally, for all of the patients who survived the ICU, their final location (home, hospital, or other institution) after 6 months was recorded.
Statistical analysis
All of the statistical analyses were performed using SAS 9.1 Statistical Software (SAS Institute, Cary, NC, USA). The quantitative variables are expressed as the mean ± standard deviation, and the qualitative variables are expressed as numbers (percentages). The patients were divided into 2 independent groups, namely, frail and nonfrail patients, based on a FP score <3 or ≥3 and a CFS <5 or ≥5, respectively. For descriptive statistics, the categorical variables were compared
using the χ2 test or Fisher’s exact test, as required. The continuous variables were compared using Student’s t test. The
survival variables were compared using the log rank test, and Kaplan-Meier survival curves were constructed.
To build the model for multivariate analysis, we selected among the variables with a p≤0.20 according to the univariate analysis. Subsequently, survival regression (Cox proportional hazard model) was performed to identify the independent factors associated with ICU and 6-month mortalities. The hazard ratios (HRs) and 95% confidence intervals (95% CIs) were calculated. The model fit and calibration were assessed using the c-index. A p<0.05 was considered to be statistically significant for all of the comparisons.
Results
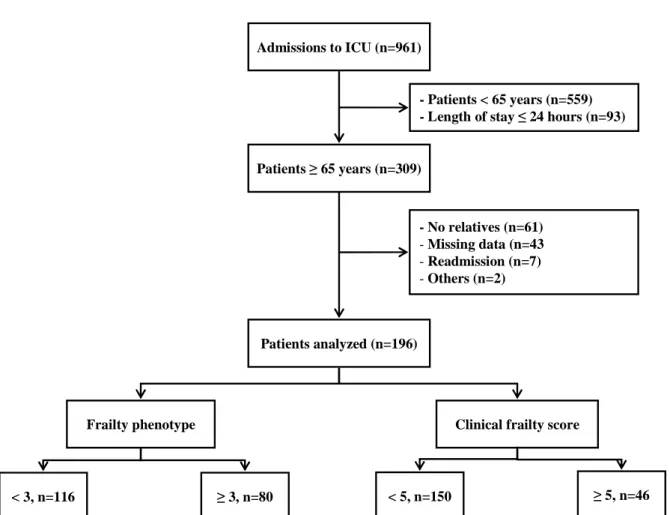
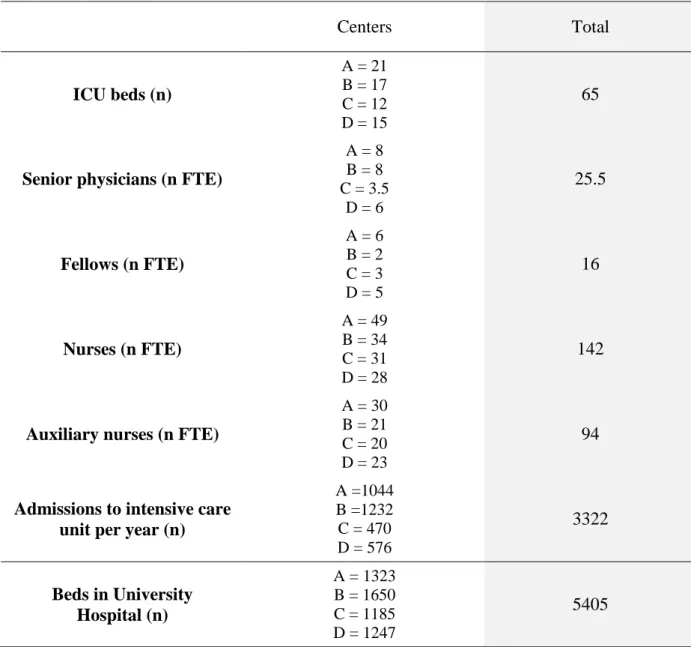
During the 6-month study period, 961 patients were admitted to the ICUs. A total of 309 elderly patients ≥65 years old, hospitalized >24 hours, and consecutively admitted to the ICUs were assessed for eligibility, and 196 were analyzed (Rennes, n=107; Nantes, n=49; Angers, n=22; and Poitiers, n=18) (Figure 1, ESM). Details regarding the ICUs and institutions from which the patients were recruited are presented in Table 3 of the ESM. The frailty data were collected at the time of admission by querying the patients (31%), their relatives (61%), or both (8%).
Frailty was observed in 80 patients (41%) and 46 patients (23%) of the 196 patients based on a FP score ≥3 and a CFS ≥5, respectively (Table 1). The CFS was significantly correlated with the FP score (R2=0.66, p<0.001). At baseline, frail
patients had significantly higher numbers of severe underlying diseases, co-morbidities, disabilities, and memory disorders (Table 1). During ICU hospitalization, the limitation or discontinuation of treatment was significantly more frequent in patients who had a CFS ≥5 (Table 2). There were no differences in ICU and hospital lengths of stay between the frail and nonfrail patients, regardless of the measurement modalities used to assess frailty (Table 2). Figure 1 depicts survival probability according to the FP score and CFS status. Only ICU mortality was higher among frail-FP patients, whereas frail-CFS patients had significantly higher ICU, hospital, and 6-month mortality rates (Figure 2). According to the CFS, nonfrail patients were more likely to live at home (Figure 2).
Table 3 provides hospital and 6-month mortality rates according to the increasing levels of the FP scores and CFSs. An increase in the CFS was associated with significant incremental hospital and 6-month mortalities.
The univariate analysis of ICU and 6-month mortalities is provided in Tables 4 and 5 in the ESM. In the multivariate analysis, the risk factors for ICU mortality were a FP score ≥3 (HR, 3.3; 95% CI, 1.6-6.6; p<0.001), male gender (HR, 2.4; 95% CI, 1.1-5.3; p=0.026), cardiac arrest before admission (HR, 2.8; 95% CI, 1.1-7.4; p=0.036), a SAPS II ≥46 (HR, 2.6; 95% CI, 1.2-5.3; p=0.011), and brain injury before admission (HR, 3.5; 95% CI, 1.6-7.7; p=0.002) (c-index=0.76 [0.45; 0.99]). The risk factors for 6-month mortality were a CFS ≥5 (HR, 2.4; 95% CI, 1.5-3.9; p<0.001) and a SOFA ≥7 (HR, 2.2; 95% CI, 1.3-3.6; p=0.002) (c-index=0.75 [0.53; 0.93]).
Discussion
In this prospective study involving ICU patients ≥65 years old, 41% and 23% were considered to be frail at the time of admission according to the FP score and CFS, respectively. Frailty constitutes an independent risk factor for ICU and 6-month mortalities. These results are consistent with a recent study performed in a younger population of ICU patients aged ≥50 years, which showed that frailty evaluated by the CFS was associated with an increased risk of adverse events, morbidity, and mortality [18].
In our study, age did not appear to be a predictive factor of death; however, this result is a controversial issue. Recently, a large retrospective study in patients ≥75 years of age reported a linear increase in the adjusted mortality probability at 28 days from ICU admission and at 1 year among the 28-day ICU survivors [9]. Similarly, aging was independently associated with a higher mortality rate in patients suffering from circulatory failure [28]. Nevertheless, evidence suggests that factors other than age itself, notably, previous health status, play a pivotal role in outcome [4, 10]. In a medical ICU, in patients ≥80 years old, long-term mortality was shown to be independently associated with the presence of an underlying fatal disease and severe functional limitations [4]. Similarly, although focused on the long-term quality of life after ICU admission, a reduction in health-related quality of life was observed up to 36 months after ICU admission and was related to the effects of pre-existing diseases [10].
To better define long-term outcomes in elderly individuals, it is important to include other parameters, such as disability and co-morbidity, rather than chronologic age and the common illness severity scores [29]. Frailty is a state of increased vulnerability in elderly adults, which is distinct from disability and co-morbidity; however, an overlap exists between these entities [14]. The prevalence of frailty is approximately 7% in the general population ≥65 years old [12, 14], although a higher prevalence (>40%) has been reported, particularly in patients who are hospitalized for various reasons [14, 25, 30,
31]; these prevalence differences could be a result of the different frailty models used [32]. Geriatric frail patients are predisposed to hospitalization, institutionalization, and decreased survival [14, 25, 31]. Frailty was identified to be a major predictor of postoperative complications and death after scheduled or unscheduled surgery [16, 30].
It is not surprising that several components of a preexisting frailty syndrome may compromise rehabilitation and outcome. An ICU hospitalization is an exhausting experience; after discharge from the ICU, the majority of patients have early substantial functional disabilities in ADL [33]. We studied long-term mortality but did not evaluate health-related quality of life (HRQOL), which has been controversially reported to be impaired in the elderly after ICU discharge [34, 35]. Nevertheless, frail ICU patients reportedly had a lower HRQOL at 6 and 12 months, regardless of their physical and mental status, which reinforces the importance of the “frail” versus “nonfrail” status at the time of admission [18]. Moreover, in the ICU, severe weakness is recognized to be a complication that, in turn, significantly impacts the recovery and return to former functional status of patients who survive organ failures [36]. Although valid for all patients, these points are more important for elderly individuals. The early recognition of frailty may help to identify targets for interventions to reduce the functional decline related to critical illness and ICU stay [36, 37].
Our results are consistent with those in previous reports, performed in areas other than ICUs [25, 38]. Frailty, independent of age, is a risk factor for ICU and 6-month mortalities. Notably, the FP score is associated with ICU mortality, whereas the CFS is associated with 6-month mortality. The assessment of functional measures provided by the FP score may be subjective, particularly when ascertained from surrogate decision-makers or family, and may explain the differences between the two scores. However, two operational definitions of frailty, namely, the FP score and CFS, were proposed because they responded to two different approaches regarding the concept of frailty, and they capture related but distinct groups of patients. In a recent study performed in a geriatric population, the prevalence of frailty ranged from 6% to 45% when 8 commonly used scales were compared [32]. The FP score is known to more precisely evaluate sarcopenia and decreased functional reserves with the loss of resilience to stressors and is likely to be more relevant for the ICU
environment. The CFS, which explores the physical aspects and the environmental spectrum, appears to be more relevant for delayed mortality [13].
Upon first admission to the ICU, frail patients were more dependent and had more memory problems and co-morbidities than nonfrail patients; however, the common markers of illness severity at the time of admission and during hospitalization were not different between frail and nonfrail patients. The severity of illness scoring systems used in the ICU (i.e.,
APACHE II, SAPS II, and SOFA) are largely dominated by the assessment of acute physiological derangements that are present at the time of admission, although several researchers incorporate a limited assessment of confirmed advanced co-morbid illnesses [17, 39]. This point underscores the importance of determining the frailty status in ICU patients to assess the need for increasing the duration of hospitalization and institutionalization and to predict mortality.
Our study has several limitations. For example, the threshold of 65 years of age used for patient inclusion in this study may be criticized. Nevertheless, it is generally accepted that elderly individuals are at least 65 years old. The threshold of ≥65 years old has been frequently used to characterize frailty in ICU patients, although frailty may also exist in younger individuals [12, 18, 24, 25]. Several components of the FP score, notably those that evaluate performance, were difficult to explore in ICU patients, which could explain the differences between the FP scores and CFS [12, 24]. In accordance with a geriatrician’s advice, we chose to interpret slowness as difficulty walking while aided and the occurrence of a fall. Other components of frailty were easier to translate because clear substitutes were available [24]. The majority of the questionnaires, notably those for the FP score, were completed by the next-of-kin and may be over- or underscored as a consequence. However, in the ICU, this approach is routine and can be considered to be the “real life” and pragmatic approach, although the next-of-kin tend to underestimate the patient’s abilities and the degree of family ties may modify the relevance of the responses [40, 41]. Finally, during ICU hospitalization, the limitation or discontinuation of treatment was more frequent in frail patients and may have contributed to the increased mortality rates in these patients. This potential bias is difficult to avoid because the weight of the frailty status in the decisions to withhold/withdraw therapy has not been studied; other factors are usually considered in these types of decisions. Similarly, 20% of our patients suffered a brain injury and 8% suffered cardiac arrest; thus, it could be argued that in these patients, the decision of whether to withdraw support may be different for frail and nonfrail patients. Nevertheless, we did not find any difference in the support withdrawal practice between these patient subgroups (Tables 6 and 7, ESM) or between the 4 ICUs studied (Tables 8 and 9, ESM).
Conclusions
As the number of elderly patient admissions to the ICU continues to increase, physicians must identify the predictive factors of mortality. At the time of admission, the common markers of illness severity (SAPS II and SOFA), as assessed by ICU physicians, did not differ between the frail and nonfrail patients. The frailty status is frequently assessed and allows for
a better definition of the risk of death in elderly patients, particularly using the CFS, although the use of the frailty score in decision-making regarding the withdrawal of support must be approached with caution.
Acknowledgments: We thank Aurore Hoarau and Veronique Sebille (EA 4275 Biostatistique, Recherche Clinique et Mesures Subjectives en Santé, Université of Nantes Faculté de Médecine, Nantes Cedex 1, France) for their help in performing the statistical analysis and Kenneth Rockwood for providing constructive comments.
References
1. Kvåle R, Flaatten H (2002) Changes in intensive care from 1987 to 1997 – has outcome improved? A single centre study. Intensive Care Med 28:1110-1116. doi:10.1007/s00134-002-1378-3
2. Blot S, Cankurtaran M, Petrovic M, Vandijck D, Lizy C, Decruyenaere J, Danneels C, Vandewoude K, Piette A, Vershraegen G, Van Den Noortgate N, Peleman R, Vogelaers D (2009) Epidemiology and outcome of nosocomial bloodstream infection in elderly critically ill patients: a comparison between middle-aged, old, and very old patients. Crit Care Med 37:1634-1641. doi: 10.1097/CCM.0b013e31819da98e
3. Ihra GC, Lehberger J, Bauer P, Schmutz R, Metnitz B, Metnitz PGH (2012) Development of demographics and outcome of very old critically ill patients admitted to intensive care units. Intensive Care Med 38:620-626. doi: 10.1007/s00134-012-2474-7
4. Boumendil A, Maury E, Reinhard I, Luquel L, Offenstadt G, Guidet B (2004) Prognosis of patients aged 80 years and over admitted in medical intensive care unit. Intensive Care Med 30:647-654. doi: 10.1007/s00134-003-2150-z 5. de Rooij SE, Govers A, Korevaar JC, Abu-Hanna A, Levi M, de Jonge E (2006) Short-term and long-term mortality in
very elderly patients admitted to an intensive care unit. Intensive Care Med 32:1039-1044. doi: 10.1007/s00134-006-0171-0
6. Sacanella E, Pérez-Castejon JM, Nicolas JM, Masanés F, Navarro M, Castro P, López-Soto A (2009) Mortality in healthy elderly patients after ICU admission. Intensive Care Med 35:550-555. doi: 10.1007/s00134-008-1345-8 7. Boumendil A, Angus DC, Guitonneau AL, Menn AM, Ginsburg C, Takun K, Davido A, Masmoudi R, Doumenc B,
Pateron D, Garrouste-Orgeas M, Somme D, Simon T, Aegerter P, Guidet B; ICE-CUB study group (2012) Variability of intensive care admission decisions for the very elderly. PLoS One 7:e34387. doi: 10.1371/journal.pone.0034387 8. Sprung CL, Danis M, Iapichino G, Artigas A, Kesecioglu J, Moreno R, Lippert A, Curtis JR, Meale P, Cohen SL, Levy
MM, Truog RD (2013) Triage of intensive care patients: identifying agreement and controversy. Intensive Care Med 39:1916-1924. doi: 10.1007/s00134-013-3033-6
9. Fuchs L, Chronaki CE, Park S, Novack V, Baumfeld Y, Scott D, McLennan S, Talmor D, Celi L (2012) ICU admission characteristics and mortality rates among elderly and very elderly patients. Intensive Care Med 38:1654-1661. doi: 10.1007/s00134-012-2629-6
10. Orwelius L, Nordlund A, Nordlund P, Simonsson E, Bäckman C, Samuelsson A, Sjöberg F (2010) F. Pre-existing disease: the most important factor for health related quality of life long-term after critical illness: a prospective, longitudinal, multicentre trial. Crit Care 14:R67. doi: 10.1186/cc8967
11. Rusinova K, Guidet B (2014) “Are you sure it’s about ‘age’?” Intensive Care Med 40:114-116. doi: 10.1007/s00134-013-3147-x
12. Fried LP, Tangen CM, Walston J, Newman AB, Hirsch C, Gottdiener J, Seeman T, Tracy R, Kop WJ, Burke G, McBurnie MA; Cardiovascular Health Study Collaborative Research Group (2001) Frailty in older adults: evidence for a phenotype. J Gerontol A Biol Sci Med Sci 56:146-156. doi: 10.1093/gerona/56.3.M146
13. Clegg A, Young J, Iliffe S, Rikkert MO, Rockwood K (2013) Frailty in elderly people. Lancet 381:752-762. doi: 10.1016/S0140-6736(12)62167-9
14. Fried LP, Ferrucci L, Darer J, Williamson JD, Anderson G (2004) Untangling the concepts of disability, frailty, and comorbidity: implications for improved targeting and care. J Gerontol A Biol Sci Med Sci 59:255-263. doi:
10.1093/gerona/59.3.M255
15. Dasgupta M, Rolfson DB, Stolee P, Borrie MJ, Speechley M (2009) Frailty is associated with postoperative complications in older adults with medical problems. Arch Gerontol Geriatr 48:78-83. doi:
10.1016/j.archger.2007.10.007
16. Lee DH, Buth KJ, Martin BJ, Yip AM, Hirsch GM (2010) Frail patients are at increased risk for mortality and prolonged institutional care after cardiac surgery. Circulation 121:973-978. doi:
10.1161/CIRCULATIONAHA.108.841437
17. McDermid RC, Stelfox HT, Bagshaw SM (2011) Frailty in the critically ill: a novel concept. Crit Care 15:301. doi: 10.1186/cc9297
18. Bagshaw SM, Stelfox HT, McDermid RC, Rolfson DB, Tsuyuki RT, Baig N, Artiuch B, Ibrahim Q, Stollery DE, Rokosh E, Majumdar SR (2013) Association between frailty and short- and long-term outcomes among critically ill patients: a multicentre prospective cohort study. CMAJ 25:E95-E102. doi: 10.1503/cmaj.130639
19. Le Gall JR, Lemeshow S, Saulnier F (1993) A new Simplified Acute Physiology Score (SAPS II) based on a European/North American multicenter study. JAMA 270:2957-2963. doi: 10.1001/jama.1993.03510240069035 20. Vincent JL, Moreno R, Takala J, Willatts S, De Mendonça A, Bruining H, Reinhart CK, Suter PM, Thijs LG (1996)
The SOFA (Sepsis-related Organ Failure Assessment) score to describe organ dysfunction/failure. On behalf of the Working Group on Sepsis-Related Problems of the European Society of Intensive Care Medicine. Intensive Care Med 22:707-710. doi: 10.1007/BF01709751
21. McCabe WR, Jackson GG (1962) Gram-negative bacteremia. Arch Intern Med 110:847-855. doi: 10.1001/archinte.1962.03620240029006
22. Bone RC, Balk RA, Cerra FB, Dellinger RP, Fein AM, Knaus WA, Schein RM, Sibbald WJ; ACCP/SCCM Consensus Conference Committee (1992) Definitions for sepsis and organ failure and guidelines for the use of innovative
therapies in sepsis: The ACCP/SCCM Consensus Conference Committee, American College of Chest Physicians/Society of Critical Care Medicine. Chest 101:1644-1655. doi: 10.1378/chest.101.6.1644
23. Bellomo R, Ronco C, Kellum JA, Mehta RL, Palevsky P (2004) Acute renal failure: definition, outcome measures, animal models, fluid therapy and information technology needs: the Second International Consensus Conference of the Acute Dialysis Quality Initiative (ADQI) Group. Crit Care 8:R204-R212. doi:10.1186/cc2872
24. Avila-Funes JA, Helmer C, Amieva H, Barberger-Gateau P, Le Goff M, Ritchie K, Portet F, Carrière I, Tavernier B, Gutiérrez-Robledo LM, Dartigues JF (2008) Frailty among community-dwelling elderly people in France: the three-city study. J Gerontol A Biol Sci Med Sci 63:1089-1096. doi: 10.1093/gerona/63.10.1089
25. Rockwood K, Howlett SE, MacKnight C, Beattie BL, Bergman H, Hébert R, Hogan DB, Wolfson C, McDowell I (2004) Prevalence, attributes, and outcomes of fitness and frailty in community-dwelling older adults: report from the Canadian study of health and aging. J Gerontol A Biol Sci Med Sci 59:1310-1317. doi: 10.1093/gerona/59.12.1310 26. Katz S, Downs TD, Cash HR, Grotz RC (1970) Progress in development of the index of ADL. Gerontologist 10:20-30. 27. Charlson ME, Pompei P, Ales KL, MacKenzie CR (1987) A new method of classifying prognostic comorbidity in
longitudinal studies: development and validation. J Chronic Dis 40:373-383.
28. Biston P, Aldecoa C, Devrient J, Beattie BL, Bergman H, Hébert R, Hogan DB, Wolfson C, McDowell I (2014) Outcome of elderly patients with circulatory failure. Intensive Care Med 40:50-56. doi: 10.1007/s00134-013-3121-7 29. Minne L, Ludhikhuize J, de Jonge E, de Rooij S, Abu-Hanna A (2011) Prognostic models for predicting mortality in
elderly patients: a systematic review. Intensive Care Med 37:1258-1268. doi: 10.1007/s00134-011-2265-6
30. Robinson TN, Wu DS, Stiegmann GV, Moss M (2011) Frailty predicts increased hospital and six-month healthcare cost following colorectal surgery in older adults. Am J Surg 202:511-514. doi: 10.1016/j.amjsurg.2011.06.017
31. Cawthon PM, Marshall LM, Michael Y, Dam TT, Ensrud KE, Barrett-Connor E, Orwoll ES; Osteoporotic Fractures in Men Research Group (2007) Osteoporotic Fractures in Men Research Group. Frailty in older men: prevalence, progression, and relationship with mortality. J Am Geriatr Soc 55:1216-1223. doi: 10.1111/j.1532-5415.2007.01259.x 32. Theou O, Brothers TD, Mitnitski A, Rockwood K (2013) Operationalization of frailty using eight commonly used
scales and comparison of their ability to predict all-cause mortality. J Am Geriatr Soc 61:1537-1551. doi: 10.1111/jgs.12420
33. van der Schaaf M, Dettling DS, Beelen A, Lucas C, Dongelmans DA, Nollet F (2008) Poor functional status immediately after discharge from an intensive care unit. Disabil Rehabil 30:1812-1818. doi:
10.1080/09638280701673559
34. Roch A, Wiramus S, Pauly V, Forel JM, Guervilly C, Gainnier M, Papazian L. (2011) Long-term outcome in medical patients aged 80 or over following admission to an intensive care unit. Crit Care 2011;15:R36. doi: 10.1186/cc9984 35. Hofhuis JG, van Stel HF, Schrijvers AJ, Rommes JH, Spronk PE (2011) Changes of health-related quality of life in
critically ill octogenarians: a follow-up study. Chest 140:1473-1483. doi: 10.1378/chest.10-0803 36. Griffiths RD, Hall JB (2010) Intensive care unit-acquired weakness. Crit Care Med 38:779-787. doi:
10.1097/CCM.0b013e3181cc4b53
37. Wood KA, Ely EW (2003) What does it mean to be critically ill and elderly? Curr Opin Crit Care 9:316-320. doi: 10.1097/00075198-200308000-00011
38. Ensrud KE, Ewing SK, Taylor BC, Fink HA, Cawthon PM, Stone KL, Hillier TA, Cauley JA, Hochberg MC, Rodondi N, Tracy JK, Cummings SR (2008) Comparison of 2 frailty indexes for prediction of falls, disability, fractures, and death in older women. Arch Intern Med 168:382-389. doi: 10.1001/archinternmed.2007.113
39. Knaus WA, Draper EA, Wagner DP, Zimmerman JE (1985) APACHE II: a severity of disease classification system. Crit Care Med 13:818-829. doi: 10.1097/00003246-198510000-00009
40. Capuzzo M, Grasselli C, Carrer S, Gritti G, Alvisi R (2000) Quality of life before intensive care admission: agreement between patient and relative assessment. Intensive Care Med 26:1288-1295. 10.1007/s001340051341
41. Hofhuis J, Hautvast JL, Schrijvers AJ, Bakker J (2003) Quality of life on admission to the intensive care: can we query the relatives? Intensive Care Med 29:974-979. doi: 10.1007/s00134-003-1763-6
Figure Legends
Fig. 1 Kaplan-Meier survival curves for 6-month mortality according to the frailty phenotype and clinical frailty score status
Table 1: Baseline characteristics
, Frailty, disability and co-morbidity scores and memory status.
Total
(n = 196)
Not frails
FP < 3
(n = 116)
Frails
FP ≥ 3
(n = 80)
p
Not frails
CFS < 5
(n = 150)
Frails
CFS ≥ 5
(n = 46)
p
Age, years
75 ± 6
74 ± 6
75 ± 6
0.96
75 ± 6
76 ± 7
0.34
Sex, male
128 (65)
72 (62)
56 (70)
0.25
100 (67)
28 (61)
0.47
BMI, kg.m
-228 ± 6
28 ± 5
28 ± 8
0.45
28 ± 5
30 ± 10
0.12
Type of admission
Medical
Scheduled surgery
Unscheduled surgery
Trauma
50 (26)
52 (26)
76 (39)
18 (9)
31 (27)
24 (21)
47 (40)
14 (12)
19 (24)
28 (35)
29 (36)
4 (5)
0.09
34 (23)
42 (28)
58 (39)
16 (11)
16 (35)
10 (22)
18 (39)
2 (4)
0.25
At admission
Brain injury
40 (20)
28 (24)
12 (15)
0.12
32 (21)
8 (17)
0.56
Cardiac arrest
15 (8)
8 (7)
7 (9)
0.60
8 (5)
7 (15)
0.05
Infection
85 (43)
46 (40)
39 (49)
0.21
64 (43)
21 (46)
0.72
SAPS II
48 ± 17
49 ± 17
47 ± 16
0.52
48 ± 17
49 ± 16
0.51
Modified SAPS II*
33 ± 16
32 ± 16
33 ± 17
0.52
32 ± 17
34 ± 16
0.57
SOFA
7 ± 4
7 ± 4
7 ± 3
0.65
7 ± 4
7 ± 3
0.93
Glasgow coma scale
11 ± 5
11 ± 5
11 ± 5
0.51
11 ± 5
11 ± 5
0.98
McCabe score
A
B
C
88 (45)
85 (43)
23 (12)
64 (55)
43 (37)
9 (8)
24 (30)
42 (52)
14 (18)
0.0014
75 (50)
61 (41)
14 (9)
13 (28)
24 (52)
9 (20)
0.02
CFS
3.7 ± 1.6
2.9 ± 1.3
4.8 ± 1.3
< 0.0001
-
-
-
FP
-
-
-
-
1.7 ± 1.4
3.3 ± 1.1
< 0.0001
Charlson Score
2.1± 2.0
1.8 ± 1.8
2.5 ± 2.1
0.006
1.9 ± 2.0
2.6 ± 1.9
0.05
Katz Score
5.3 ± 1.5
5.8 ± 0.8
4.6 ± 2.0
< 0.0001
5.8 ± 0.9
3.7 ± 2.1
< 0.0001
Memory disorders
43 (22)
18 (16)
25 (31)
0.01
27 (18)
16 (35)
0.02
Quantitative and qualitative values are expressed as the mean±SD and n (%). BMI: Body mass index. SAPS II: Simplified acute physiologic score II. SOFA:
Sequential organ failure assessment. *The modified SAPS II score was SAPS II not including age. FP: Frailty phenotype. CFS: Clinical frailty score
Table 2: Clinical data during ICU hospitalization and ICU and hospital length of stay.
Total
(n = 196)
Not frails
FP < 3
(n = 116)
Frails
FP ≥ 3
(n = 80)
p
Not frails
CFS < 5
(n = 150)
Frails
CFS ≥ 5
(n = 46)
p
Severe sepsis
73 (37)
44 (38)
29 (36)
0.81
58 (39)
15 (33)
0.46
Septic shock
68 (35)
39 (34)
29 (36)
0.70
54 (36)
14 (30)
0.49
Number of acquired infections
0.8 ± 0.8
0.9 ± 0.9
0.8 ± 0.7
0.31
0.9 ± 0.9
0.7 ± 0.6
0.13
Acute renal failure
83 (42)
43 (37)
40 (50)
0.07
64 (43)
19 (41)
0.87
Dialysis
41 (21)
25 (22)
16 (20)
0.79
33 (22)
8 (17)
0.50
Mechanical ventilation, days
11 ± 15
12 ± 15
10 ± 15
0.35
10 ± 14
12 ± 20
0.54
ARDS
14 (7)
8 (7)
6 (8)
0.87
12 (8)
2 (4)
0.53
Surgery
98 (50)
61 (53)
37 (46)
0.38
74 (49)
24 (52)
0.74
Corticosteroid treatment
43 (22)
22 (19)
21 (26)
0.23
31 (21)
12 (26)
0.44
Use of neuromuscular blocking
24 (12)
14 (12)
10 (13)
0.93
20 (13)
4 (9)
0.40
Vasopressor use
113 (58)
68 (59)
45 (56)
0.74
91 (61)
22 (48)
0.12
Limitation or discontinuance
of treatment
38 (19)
18 (16)
20 (25)
0.10
18 (12)
20 (43)
< 0.0001
Length of stay, days
ICU
8 [5-17]
10 [5-18]
7 [4-14]
0.21
9 [5-18]
8 [4-14]
0.96
Hospital
23 [13-47]
24 [13-50]
21 [13-42]
0.15
24 [13-49]
22 [13-42]
0.26
Quantitative and qualitative values are expressed as the mean ± SD or median [Interquartile range] and n (%). ARDS: Acute respiratory distress
syndrome. FP: Frailty phenotype. CFS: Clinical frailty score.
18
Table 3. ICU, hospital and 6-month mortalities according to the level of frailty.
ICU mortality
(n = 41)
p†
Hospital mortality
(n = 65)
p†
6-month mortality
(n = 72)
p†
Frailty phénotype
0 (n = 36)
10 (28)
11 (31)
11 (31)
1 - 2 (n = 80)
9 (11)
25 (31)
28 (35)
3 (n = 36)
7 (19)
9 (25)
10 (28)
4 - 5 (n = 44)
15 (34)
0.02
20 (45)
0.11
23 (52)
0.09
Clinical frailty score
1-3 (n = 88)
16 (18)
26 (30)
28 (32)
4 (n = 62)
8 (13)
16 (26)
17 (27)
5 (n = 19)
7 (37)
7 (37)
7 (37)
6 - 8* (n = 27)
10 (37)
0.21
16 (59)
0.003
20 (74)
< 0.001
19
Figure 1.
dur ee_sui vi
STRATA: gr oup=2f r ai l Censor ed gr oup=2f r ai l gr oup=cf sf r a Censor ed gr oup=cf sf r a gr oup=f i f r ai Censor ed gr oup=f i f r ai gr oup=nof r ai Censor ed gr oup=nof r ai
CFS + FP+ (n = 38) CFS + FP -(n = 8) CFS – FP + (n = 42) CFS – FP -(n = 108) S u rv iv al p ro b ab ili ty Time (Days) Log rank p = 0.0024
20
Figure 2.
FP < 3 FP ≥ 3 CFS < 5 CFS ≥ 5 0 10 20 30 40 50 60 70Home Hospi tal O the r insti tuti on
0 10 20 30 40 50 60 70
Home Hospital O ther instituti on
L iv in g s it u a ti o n a t 6 m o n th s (% ) p=0.27 p=0.002 0 10 20 30 40 50 60 70
IC U Hospi tal 6 months
0 10 20 30 40 50 60 70
IC U Hospi tal 6 months
M o rt a li ty (% ) p=0.015 p=0.15 p=0.22 p=0.04 p=0.003 p=0.002
Frailty phenotype Clinical frailty score
n=66 n=35 n=3 n=2 n=8 n=10 n=88 n=13 n=4 n=1 n=11n=5
21
Prevalence and impact of frailty on mortality in elderly ICU patients: a
prospective, multicenter observational study.
Pascale Le Maguet, MD, Antoine Roquilly
2, MD, PhD, Sigismond Lasocki
3, MD, PhD,
Karim Asehnoune
2, MD, PhD, Elsa Carise
4, MD, Marjorie Saint Martin
3, MD, Olivier
Mimoz
4,5,6, MD, PhD, Grégoire Le Gac
1, MD, Dominique Somme
7,9, MD, PhD, Catherine
Cattenoz
7, MD, Fanny Feuillet
8, PhD, Yannick Malledant
1,9,10, MD; Philippe Seguin
1,9,10,
MD, PhD.
1
CHU Rennes, Département d’Anesthésie Réanimation, Rennes, France.
2CHU Nantes,
Département d’Anesthésie Réanimation, Nantes, France.
3CHU Angers, Département
d’Anesthésie Réanimation, Angers, France.
4CHU Poitiers, Département d’Anesthésie
Réanimation, Poitiers, France.
5Inserm Eri 23, Poitiers, France.
6Université Poitiers,
Poitiers, France.
7CHU Rennes, Service de Gériatrie, Rennes, France.
8EA 4275
"Biostatistique, Pharmacoépidémiologie et Mesures Subjectives en Santé" Nantes, France.
9Inserm U991, Rennes, France.
10Université Rennes 1, Rennes, France
Corresponding author:
Philippe SEGUIN, MD, PhD
Hôpital Pontchaillou,
Service d’Anesthésie-Réanimation 1,
Réanimation Chirurgicale,
2 rue Henri Le Guilloux,
35033 Rennes Cedex 9, France.
Tel: 33.2.99.28.42.46
Fax: 33.2.99.28.24.21
e-mail: philippe.seguin@chu-rennes.fr
22
Online resource 1: Table 1 Frailty phenotype score
Online resource 2: Table 2 Clinical frailty score
Online resource 3: General characteristics of the 4 centers.
Online resource 4: Table 3 Univariate analysis for ICU mortality
Online resource 5: Table 4 Univariate analysis for 6-month mortality
Online resource 6: Table 5 Severity, support and outcome for brain injury patients according
to the frailty status
Online resource 7: Table 6 Severity, support and outcome for cardiac arrest patients
according to frailty
Online resource 8: Table 7 Severity, support and outcome for brain injury patients according
to centers
Online resource 9: Table 8 Severity, support and outcome for cardiac arrest patients
according to centers
Online resource 10: Fig 1 Flow chart
Online resource 11: references
23
Online resource 1.
Table 1: Operationalizing a phenotype of frailty.
Characteristics of
frailty
Original scale [1]
Tools used in our study
(adapted from [2])
Shrinking
Unintentionally (not due
to dieting or exercise)
weight loss ≥4.5 kg or
more than 5% of body
weight in the prior year
Unintentionally (not due
to dieting or exercise)
weight loss ≥4.5 kg or
more than 5% of body
weight in the prior year
Yes = 1
No = 0
Weakness
Handgrip strength
measured by
dynamometer (adjusted
for gender and body mass
index)
Difficulty rising from a
chair
Yes = 1
No = 0
Slowness
Time to walk 15 feet,
(adjusted for gender and
standard height)
Slowed walking speed
(during the last 6 months,
with difficulties walking
and with aid) and/or the
occurrence of fall(s).
Yes = 1
No = 0
Low physical
activity
Kilocalories expended per
week.
Discontinued daily leisure
activities such as walking
or gardening and/or
discontinued some sport
activity per week.
Yes = 1
No = 0
Exhaustion
Feeling that everything
the patient does is an
effort and/or the feeling
that he could not get
going, as well as how
often in the last 3 months
he/she felt this way:
rarely or not at all=0,
occasionally=1,
often=2,
usually=3
Feeling that everything
the patient does is an
effort and/or the feeling
that he could not get
going, as well as how
often in the last 3 months
he/she felt this way:
rarely or not at all=0,
occasionally=1,
often=2,
usually=3
Answering
2 or 3 to
either of
these
questions
were
considered
frail (1
point) by
exhaustion
Nonfrail: FP < 3. Frail: FP ≥ 3.
24
Online resource 2.
Table 2: Clinical frailty score.
Score
Frailty grade
Description
1
Very Fit
People who are robust, active, energetic and motivated. These
people commonly exercise regularly. They are among the fittest
for their age.
2
Well
People who have
no active disease symptoms
but are less fit than
category 1. Often, they
exercise or are very
active occasionally
,
e.g. seasonally.
3
Managing well
People whose
medical problems are well controlled,
but are
not
regularly active
beyond routine walking.
4
Vulnerable
While
not dependent
on others for daily help, often
symptoms
limit activities.
A common complaint is being “slowed up”,
and/or being tired during the day.
5
Mildly frail
These people often have
more evident slowing,
and need help in
high order independence in activities of daily living
(finances,
transportation, heavy housework, medications).
Typically, mild
frailty progressively impairs
shopping and walking outside alone,
meal preparation
and housework.
6
Moderately frail
People need help with
all outside activities
and with
keeping
house
. Inside, they
often have problems with stairs and need
help
with bathing
and might need minimal assistance (cuing,
standby)
with dressing.
7
Severely frail
Completely dependent for personal care
, from whatever cause
(physical or
cognitive). Even so, they seem stable and not at high
risk of dying (within ~ 6 months).
8
Very
severely
frail
Completely dependent, approaching the end of life. Typically,
they could not recover even from a minor illness.
9
Terminally Ill
Approaching the end of life. This category applies to people with
a life expectancy
<6 months
, who are
not otherwise evidently
frail.
25
Online resource 3.
Table 3: General characteristics of the 4 centers. (A=Rennes, B=Nantes, C=Angers,
D=Poitiers)
Centers
Total
ICU beds (n)
A = 21
B = 17
C = 12
D = 15
65
Senior physicians (n FTE)
A = 8
B = 8
C = 3.5
D = 6
25.5
Fellows (n FTE)
A = 6
B = 2
C = 3
D = 5
16
Nurses (n FTE)
A = 49
B = 34
C = 31
D = 28
142
Auxiliary nurses (n FTE)
A = 30
B = 21
C = 20
D = 23
94
Admissions to intensive care
unit per year (n)
A =1044
B =1232
C = 470
D = 576
3322
Beds in University
Hospital (n)
A = 1323
B = 1650
C = 1185
D = 1247
5405
FTE: Full time equivalent
ICU: Intensive care unit
26
Online resource 4.
Table 4: Univariate analysis for ICU mortality
.
Total
(n = 196)
Dead
(n = 41)
Alive
(n = 155)
p†
Age, years
75 [69 - 79]
75 ± 6
75 ± 6
0.70
Sex, male
128 (65)
31 (76)
97 (63)
0.03*
BMI, kg.m
-227.4 [24.0-30.9]
27.9 ± 5.7
28.1 ± 6.5
0.29
Type of admission
Medical
Scheduled surgery
Unscheduled surgery
Trauma
50 (26)
52 (26)
76 (39)
18 (9)
13 (32)
8 (19)
14 (34)
6 (15)
36 (23)
44 (28)
63 (41)
12 (8)
0.30
At admission
Brain injury
40 (20)
11 (27)
29 (19)
0.19*
Cardiac arrest
15 (8)
6 (15)
9 (6)
0.08*
Infection
85 (43)
17 (41)
68 (44)
0.55
SAPS II
46 [35 - 57]
53 ± 17
46 ± 17
0.04*
SOFA
7 [4 - 9]
9 ± 3
6 ± 4
0.55
Glasgow coma scale
15 [6 - 15]
9 ± 5
12 ± 5
0.18*
McCabe score
A
B
C
88 (45)
85 (43)
23 (12)
19 (46)
19 (46)
3 (8)
69 (44)
66 (43)
20 (13)
0.92
CFS
4 [3 - 4]
4.1 ± 2.0
3.6 ± 1.4
0.04*
FP
2 [1 - 3]
2.3 ± 1.7
2.0 ± 1.4
0.02*
Charlson Score
2 [0 - 3]
2.0 ± 2.0
2.1 ± 2.0
0.68
Katz Score
6 [6 - 6]
5.0 ± 1.9
5.3 ± 1.4
0.79
Memory disorders
43 (22)
13 (32)
30 (19)
0.09*
Severe sepsis
73 (37)
15 (37)
58 (37)
0.09*
Septic shock
68 (35)
16 (39)
52 (34)
<0.01*
Acute renal failure
83 (42)
22 (54)
61 (39)
0.85
Dialysis
41 (21)
11 (27)
30 (19)
0.08*
ARDS
14 (7)
4 (10)
10 (6)
0.18
Surgery
98 (50)
23 (56)
75 (48)
0.32
Corticosteroid treatment
43 (22)
12 (29)
31 (20)
0.16*
Use of neuromuscular blocking
24 (12)
9 (22)
15 (10)
0.54
Vasopressor use
113 (58)
32 (78)
81 (52)
0.91
Quantitative and qualitative values are expressed as the median [IQR] or mean ± SD and n (%). †Log Rank tests
* Variables selected for Cox model
BMI: Body mass index. SAPS II: Simplified acute physiologic score II. SOFA: Sequential organ failure assessment. FP: Frailty phenotype. CFS: Clinical frailty score. ARDS: Acute respiratory distress syndrome
27
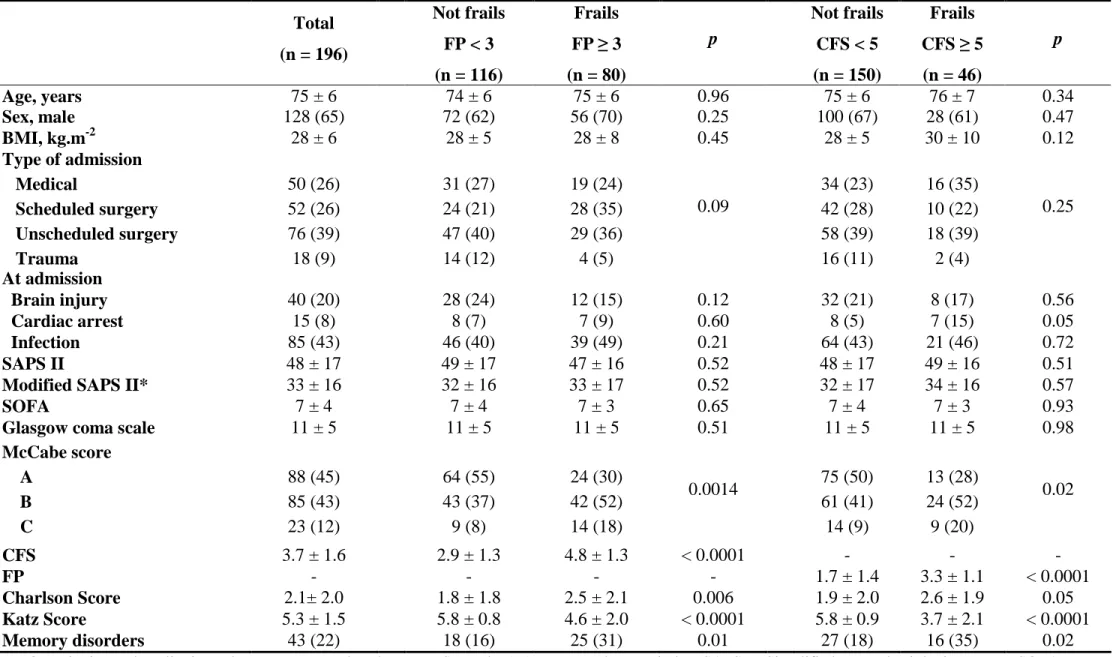
Online resource 5.
Table 5: Univariate analysis for 6-month mortality
.
Total
(n = 196)
Dead
(n = 72)
Alive
(n = 124)
p†
Age, years
75 [69 - 79]
75 ± 7
75 ± 6
0.88
Sex, male
128 (65)
50 (69)
78 (63)
0.33
BMI, kg.m
-227.4 [24.0 - 30.9]
28.0 ± 7.3
28.1 ± 5.7
0.19*
Type of admission
Medical
Scheduled surgery
Unscheduled surgery
Trauma
50 (26)
52 (26)
76 (39)
18 (9)
23 (32)
16 (22)
27 (38)
6 (8)
27 (22)
36 (29)
49 (39)
12 (10)
0.44
At admission
Brain injury
40 (20)
17 (24)
23 (19)
0.25
Cardiac arrest
15 (8)
8 (11)
7 (6)
0.10*
Infection
85 (43)
33 (46)
52 (42)
0.73
SAPS II
46 [35 - 57]
52 ± 18
46 ± 16
0.01*
SOFA
7 [4 - 9]
8 ± 3
6 ± 4
<0.01*
Glasgow coma scale
15 [6 - 15]
10 ± 5
12 ± 5
0.18*
McCabe score
A
B
C
88 (45)
85 (43)
23 (12)
31 (43)
32 (44)
9 (13)
57 (46)
53 (43)
14 (11)
0.90
CFS
4 [3 - 4]
4.2 ± 1.9
3.4 ± 1.3
<0.01*
FP
2 [1 - 3]
2.3 ± 1.6
1.9 ± 1.4
0.21
Charlson Score
2 [0 - 3]
2.3 ± 2.1
2.0 ± 1.9
0.95
Katz Score
6 [6 - 6]
4.8 ± 1.8
5.5 ± 1.3
<0.01*
Memory disorders
43 (22)
17 (24)
26 (21)
0.64
Severe sepsis
73 (37)
27 (37)
46 (37)
0.79
Septic shock
68 (35)
29 (40)
39 (31)
0.41
Acute renal failure
83 (42)
35 (49)
48 (39)
0.18*
Dialysis
41 (21)
19 (26)
22 (18)
0.21
ARDS
14 (7)
5 (7)
9 (7)
0.95
Surgery
98 (50)
39 (54)
59 (48)
0.58
Corticosteroid treatment
43 (22)
19 (26)
24 (19)
0.26
Use of neuromuscular blocking
24 (12)
11 (15)
13 (10)
0.33
Vasopressor use
113 (58)
50 (69)
63 (51)
<0.01*
Quantitative and qualitative values are expressed as the median [IQR] or mean ± SD and n (%). †Log Rank tests
* Variables selected for Cox model
BMI: Body mass index. SAPS II: Simplified acute physiologic score II. SOFA: Sequential organ failure assessment. FP: Frailty phenotype. CFS: Clinical frailty score. ARDS: Acute respiratory distress syndrome
28
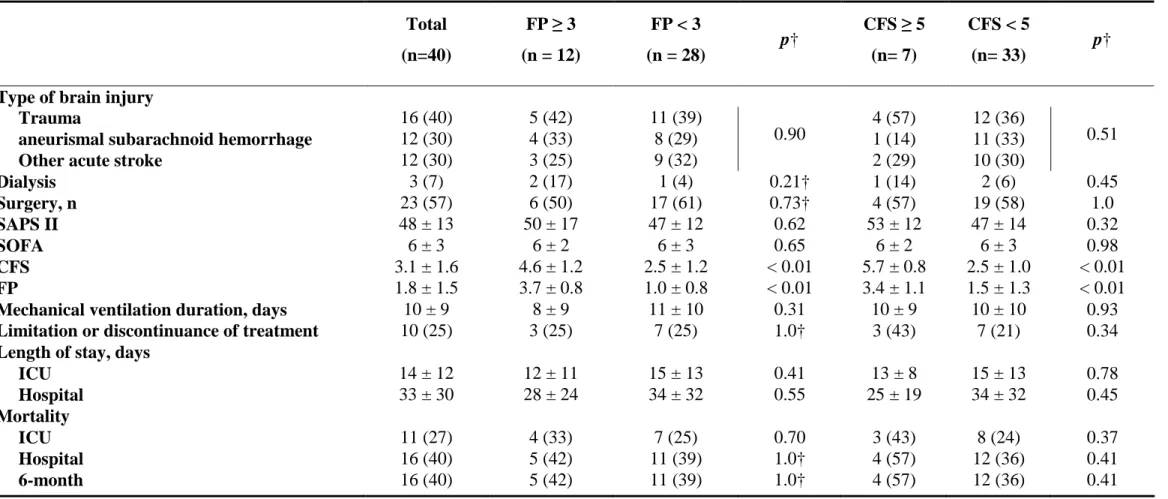
Online resource 6 .
Table 6: Support and outcome for brain injury patients according to frailty.
Total
(n=40)
FP ≥ 3
(n = 12)
FP < 3
(n = 28)
p†
CFS ≥ 5
(n= 7)
CFS < 5
(n= 33)
p†
Type of brain injury
Trauma
16 (40)
5 (42)
11 (39)
4 (57)
12 (36)
aneurismal subarachnoid hemorrhage
12 (30)
4 (33)
8 (29)
1 (14)
11 (33)
Other acute stroke
12 (30)
3 (25)
9 (32)
0.90
2 (29)
10 (30)
0.51
Dialysis
3 (7)
2 (17)
1 (4)
0.21†
1 (14)
2 (6)
0.45
Surgery, n
23 (57)
6 (50)
17 (61)
0.73†
4 (57)
19 (58)
1.0
SAPS II
48 ± 13
50 ± 17
47 ± 12
0.62
53 ± 12
47 ± 14
0.32
SOFA
6 ± 3
6 ± 2
6 ± 3
0.65
6 ± 2
6 ± 3
0.98
CFS
3.1 ± 1.6
4.6 ± 1.2
2.5 ± 1.2
< 0.01
5.7 ± 0.8
2.5 ± 1.0
< 0.01
FP
1.8 ± 1.5
3.7 ± 0.8
1.0 ± 0.8
< 0.01
3.4 ± 1.1
1.5 ± 1.3
< 0.01
Mechanical ventilation duration, days
10 ± 9
8 ± 9
11 ± 10
0.31
10 ± 9
10 ± 10
0.93
Limitation or discontinuance of treatment
10 (25)
3 (25)
7 (25)
1.0†
3 (43)
7 (21)
0.34
Length of stay, days
ICU
14 ± 12
12 ± 11
15 ± 13
0.41
13 ± 8
15 ± 13
0.78
Hospital
33 ± 30
28 ± 24
34 ± 32
0.55
25 ± 19
34 ± 32
0.45
Mortality
ICU
11 (27)
4 (33)
7 (25)
0.70
3 (43)
8 (24)
0.37
Hospital
16 (40)
5 (42)
11 (39)
1.0†
4 (57)
12 (36)
0.41
6-month
16 (40)
5 (42)
11 (39)
1.0†
4 (57)
12 (36)
0.41
† Fisher exact tests and Wilcoxon tests.
29
Online resource 7.
Table 7: Severity, support and outcome for cardiac arrest patients according to the frailty status.
Total
(n=15)
FP ≥ 3
(n = 7)
FP < 3
(n = 8)
p†
CFS ≥ 5
(n= 7)
CFS < 5
(n= 8)
p†
SAPS II
57 ± 27
58 ± 27
57 ± 28
0.94
56 ± 29
58 ± 27
0.14
SOFA
10 ± 5
9 ± 4
11 ± 5
0.44
8 ± 4
11 ± 5
0.27
Surgery, n
6 (40)
3 (43)
3 (37)
1.0
4 (57)
2 (25)
0.31
CFS
4.3 ± 2.1
5.9 ± 1.5
2.9 ± 1.5
< 0.01
6.0 ± 1.3
2.8 ± 1.3
< 0.01
FP
2.2 ± 1.8
4.0 ± 0.6
0.6 ± 0.5
< 0.01
3.6 ± 1.3
1.0 ± 1.3
< 0.01
Dialysis
6 (40)
3 (43)
3 (37)
1.0
3 (43)
3 (37)
1.0
Mechanical ventilation duration, days
14 ± 15
7 ± 4
19 ± 19
0.12
7 ± 5
20 ± 18
0.10
Limitation or discontinuance of treatment
5 (33)
3 (43)
2 (25)
0.61
3 (43)
2 (25)
0.61
Length of stay, days
ICU
16 ± 17
8 ± 5
23 ± 20
0.07
8 ± 5
22 ± 21
0.10
Hospital
27 ± 22
15 ± 5
38 ± 26
0.04
17 ± 5
36 ± 28
0.10
Mortality
ICU
6 (40)
3 (43)
3 (37)
1.0
3 (43)
3 (37)
1.0
Hospital
7 (47)
3 (43)
4 (50)
1.0
3 (43)
4 (50)
1.0
6-month
8 (53)
4 (57)
4 (50)
1.0
4 (57)
4 (50)
1.0
† Fisher exact tests and Wilcoxon tests.
30
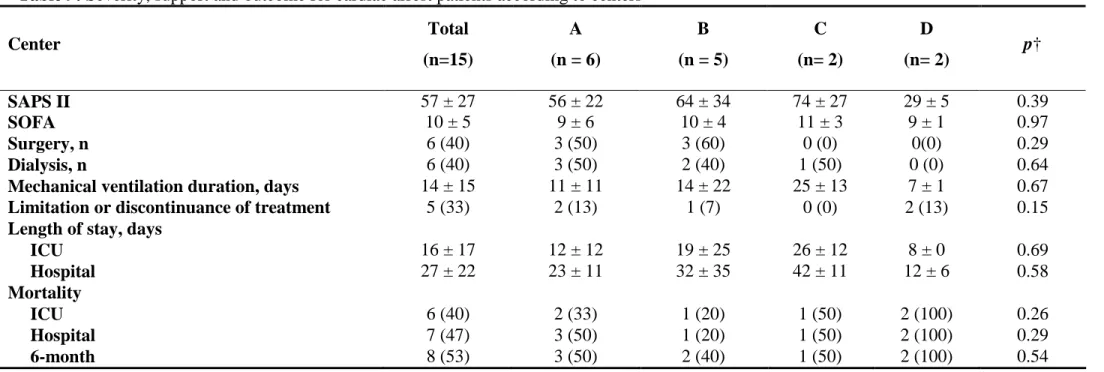
Online resource 8.
Table 8: Severity, support and outcome for brain injury patients according to centers (A=Rennes, B=Nantes, C=Angers, D=Poitiers).
Center
Total
(n=40)
A
(n = 23)
B
(n = 12)
C
(n= 4)
D
(n= 1)
p†
SAPS II
48 ± 13
48 ± 13
50 ± 14
50 ± 3
16.0±0
0,11
SOFA
6 ± 3
5 ± 3
8 ± 2
7 ± 3
5.0±0
0.06
Surgery, n
23 (57)
13 (56)
9 (75)
1 (25)
0 (0)
0.20
Dialysis, n
3 (7)
3 (13)
0 (0)
0 (0)
0 (0)
0.50
Mechanical ventilation duration, days
10 ± 9
6 ± 7
19 ± 9
9 ± 5
8.0±0
< 0.01
Limitation or discontinuance of treatment
10 (25)
3 (13)
5 (42)
2 (50)
0 (0)
0.16
Length of stay, days
ICU
14 ±12
9 ± 9
25 ± 14
11 ± 4
22 ± 0
< 0.01
Hospital
33 ± 30
27 ± 30
47 ± 29
24 ± 24
32 ± 0
0.27
Mortality
ICU
11 (27)
6 (26)
3 (25)
2 (50)
0 (0)
0.69
Hospital
16 (40)
9 (39)
5 (42)
2 (50)
0 (0)
0.84
6-month
16 (40)
9 (39)
5 (42)
2 (50)
0 (0)
0.84
† ANOVA analysis
31
Online resource 9.
Table 9: Severity, support and outcome for cardiac arrest patients according to centers
Center
Total
(n=15)
A
(n = 6)
B
(n = 5)
C
(n= 2)
D
(n= 2)
p†
SAPS II
57 ± 27
56 ± 22
64 ± 34
74 ± 27
29 ± 5
0.39
SOFA
10 ± 5
9 ± 6
10 ± 4
11 ± 3
9 ± 1
0.97
Surgery, n
6 (40)
3 (50)
3 (60)
0 (0)
0(0)
0.29
Dialysis, n
6 (40)
3 (50)
2 (40)
1 (50)
0 (0)
0.64
Mechanical ventilation duration, days
14 ± 15
11 ± 11
14 ± 22
25 ± 13
7 ± 1
0.67
Limitation or discontinuance of treatment
5 (33)
2 (13)
1 (7)
0 (0)
2 (13)
0.15
Length of stay, days
ICU
16 ± 17
12 ± 12
19 ± 25
26 ± 12
8 ± 0
0.69
Hospital
27 ± 22
23 ± 11
32 ± 35
42 ± 11
12 ± 6
0.58
Mortality
ICU
6 (40)
2 (33)
1 (20)
1 (50)
2 (100)
0.26
Hospital
7 (47)
3 (50)
1 (20)
1 (50)
2 (100)
0.29
6-month
8 (53)
3 (50)
2 (40)
1 (50)
2 (100)
0.54
† ANOVA tests
SAPS II: Simplified acute physiologic score II. SOFA: Sequential organ failure assessment. FP: Frailty phenotype. CFS: Clinical frailty score
32
Online resource 10.
Figure 1. Flow chart.
Admissions to ICU (n=961) Patients ≥ 65 years (n=309) - No relatives (n=61) - Missing data (n=43 - Readmission (n=7) - Others (n=2) Patients analyzed (n=196)
Frailty phenotype Clinical frailty score
- Patients < 65 years (n=559) - Length of stay ≤ 24 hours (n=93)

![Table 4: Univariate analysis for ICU mortality . Total (n = 196) Dead (n = 41) Alive (n = 155) p† Age, years 75 [69 - 79] 75 ± 6 75 ± 6 0.70 Sex, male 128 (65) 31 (76) 97 (63) 0.03* BMI, kg.m -2 27.4 [24.0-30.9] 27.9 ± 5.7 28.1 ± 6.5 0.](https://thumb-eu.123doks.com/thumbv2/123doknet/11467714.291546/27.892.84.808.189.1017/table-univariate-analysis-mortality-total-dead-alive-years.webp)
![Table 5: Univariate analysis for 6-month mortality . Total (n = 196) Dead (n = 72) Alive (n = 124) p† Age, years 75 [69 - 79] 75 ± 7 75 ± 6 0.88 Sex, male 128 (65) 50 (69) 78 (63) 0.33 BMI, kg.m -2 27.4 [24.0 - 30.9] 28.0 ± 7.3 28.1 ± 5.](https://thumb-eu.123doks.com/thumbv2/123doknet/11467714.291546/28.892.84.807.187.1020/table-univariate-analysis-month-mortality-total-dead-alive.webp)