HAL Id: hal-01521007
https://hal.archives-ouvertes.fr/hal-01521007
Preprint submitted on 11 May 2017
HAL is a multi-disciplinary open access
archive for the deposit and dissemination of
sci-entific research documents, whether they are
pub-lished or not. The documents may come from
teaching and research institutions in France or
abroad, or from public or private research centers.
L’archive ouverte pluridisciplinaire HAL, est
destinée au dépôt et à la diffusion de documents
scientifiques de niveau recherche, publiés ou non,
émanant des établissements d’enseignement et de
recherche français ou étrangers, des laboratoires
publics ou privés.
Intrusion detection in network systems through hybrid
supervised and unsupervised mining process - a detailed
case study on the ISCX benchmark dataset
-Saeid Soheily-Khah, Pierre-François Marteau, Nicolas Béchet
To cite this version:
Saeid Soheily-Khah, Pierre-François Marteau, Nicolas Béchet. Intrusion detection in network systems
through hybrid supervised and unsupervised mining process - a detailed case study on the ISCX
benchmark dataset -. 2017. �hal-01521007�
Intrusion detection in network systems through hybrid supervised and
unsupervised mining process
a detailed case study on the ISCX benchmark dataset
-Saeid Soheily-Khah∗, Pierre-Franc¸ois Marteau, Nicolas B´echet
IRISA, CNRS, Universit´e Bretagne-Sud, Campus de Tohannic, Vannes, France
Abstract
Data mining techniques play an increasing role in the intrusion detection by analyzing network data and classifying it as ’normal’ or ’intrusion’. In recent years, several data mining techniques such as supervised, semi-supervised and unsupervised learning are widely used to enhance the intrusion detection. This work proposes a hybrid intrusion detection (kM-RF) which outperforms in overall the alternative methods through the accuracy, detection rate and false alarm rate. A benchmark intrusion detection dataset (ISCX) is used to evaluate the efficiency of the kM-RF, and a deep analysis is conducted to study the impact of the importance of each feature defined in the pre-processing step. The results show the benefits of the proposed approach.
Keywords: Anomaly detection, data mining, random forest, k-means clustering, hybrid classification, ISCX dataset
1. Introduction
Due to the proliferation of high-speed Internet access and rapid expansion of the computer networks during the past few years, more and more organizations are be-coming vulnerable to potential cyber attacks, such as network intrusions. In particular, any set of actions that threatens the integrity, confidentiality or availability of a network resource, or any attempt to break into, bypass the security mechanisms or misuse a system is an intru-sion, such as Denial of Service (DoS), worms, viruses, etc.
Intrusion detection has recently attracted great atten-tion in the data mining community [1, 2, 3, 4, 5, 6]. It is the process of monitoring the events occurring in a com-puter system or network and analyzing them for cues of intrusions. Data mining techniques used for intru-sion detection traditionally are classified into two cate-gories: misuse detection and anomaly detection. Misuse always refers to the known attacks and misuse detection compares network activities with the pre-defined signa-tures or patterns which represent a specific attack. A
∗Corresponding author
Email addresses: [email protected] (Saeid Soheily-Khah), [email protected] (Pierre-Franc¸ois Marteau), [email protected] (Nicolas B´echet)
key advantage of misuse detection techniques is their high accuracy in detecting known attacks and their vari-ations. But clearly they can only detect known attacks. Anomaly detection, on the other hand, works by tak-ing the baseline of normal traffic and activities, from which a model of normal behaviors is built. It detects known and previously unknown attacks. However, in many cases, it may fail to detect malicious behaviours or even raise alarms for normal data assuming erroneously that it is an attack. In this way, applying data mining techniques on network traffic data is a promising solu-tion which helps to develop better intrusion detecsolu-tion systems.
In this paper, we discuss data mining and machine learning methods for network intrusion detection and propose a dedicated pre-processing procedure as well as a combination of approaches to detect intrusions in networks more effectively. The remainder of this pa-per is organized as follows. In Section 2, we present the state-of-the-art of machine learning and data mining based intrusion detection approaches. In Section 3, we describe the proposed pre-processing strategy being di-rectly applicable to any other data mining algorithms. We then characterize the suggested hybrid approach in detail. Finally, the conducted experiments and results obtained are discussed in Section 4. The main
contribu-tions of this research paper are as follows:
- Proposition of a pre-processing procedure to build more separated classes (normal vs. attack) from the raw network traffic data as well as converting the categorical features to numerical ones. - Proposal for some new features to consider
pay-loads and to help detecting IP scans and distributed attacks, then we show the importance of these added features in detection of intrusions and at-tacks.
- Proposal for a way of using k-means algorithm to reduce the size of data (i.e. instance set reduction). - Proposal for a hybrid (semi-supervised and
super-vised) intrusion detection method
- Show through a detailed analysis that the proposed hybrid intrusion detection (kM-RF) outperforms alternative methods through (a) the accuracy, (b) the detection rate and (c) the false alarm rate.
2. State of the art in machine learning and data min-ing based intrusion detection systems
Traditional intrusion detection systems are limited and do not provide a proper solution. They search for potential malicious activities on network data and com-puter usage. However, in many cases, they fail to detect new malicious behaviours or they may frequently raise false alarms when nothing is wrong in the network. Ad-ditionally, they require manual processing as well as hu-man expert interaction to tune them.
Many data mining methods can be used in intrusion detection to learn from traffic data, each one with its own specific advantage and drawback. The recent and rapid development in data mining has made a variety of algorithms available, resulting from the fields of statis-tics, machine learning and parallel computing. The dif-ferent types of data mining techniques and applications particularly relevant to anomaly detection are super-vised learning (classification), semi-supersuper-vised learn-ing and unsupervised learnlearn-ing (clusterlearn-ing). They gen-erally refer to the process of extracting patterns, rules and models from the data to solve a decision problem. 2.1. Supervised learning
Classification is a common data mining task, with the foundations of machine learning. Classification-based intrusion detection techniques analyze and classify the network traffic data into two known classes (i.e. normal
or attack). They are used when a set of labeled training data is available to learn a model (or a pattern). This model is utilized to categorize the data. In the literature, a variety of classification techniques such as support vector machine (SVM), nearest neighbor, naive Bayes, decision tree, neural network and random forest have been widely used as data mining techniques for intru-sion detection applications.
The SVM is one of the most successful classification algorithms in the field of data mining, but the training task is time-consuming (computationally expensive) for intrusion detection systems which limits its use. Fur-thermore, the SVM in general treats every feature of data equally, while in real network traffic datasets, many features are redundant or less important. Kernel based approaches to feature selection [7, 8] require also com-plex training process and the so-called weighted kernel that results from the optimization process needs to be regularized prior to its use in an SVM. Moreover the processing of raw features for classification decreases the accuracy of detecting intrusion. Because of the above mentioned shortcomings, the standard SVM can not be used for intrusion detection. However, to address the noticed limitations recently variant of SVM are sug-gested [9, 10, 11].
The nearest neighbor classification is a type of instance-based learning, or lazy learning and it is one of the oldest methods known. These classifiers are fre-quently used in classification tasks due to their simplic-ity and performance. While nearest neighbor algorithm usually performs well in terms of accuracy, comparable to even SVMs, it is slow in the recognition phase and it gets slower as the number of data in the training set increases. This is because the distances (or similarities) between the new data and all the training data need to be computed. There have been attempts to make nearest neighbor method faster, for example by obtaining ap-proximate solutions using centroid-based methods. In this line of research, further work is in progress to inves-tigate the reliability and scaling properties of the nearest neighbor classifier method [12, 13].
Bayesian classifiers are statistical approaches that predict class membership probabilities. Naive Bayesian classifiers works based on the Bayes’ rules, where features are assumed to be conditionally independent. Even if practically the dependency between features may exist, in spite of this assumption, they give satisfy-ing results, are easy to implement, fast to evaluate and need a small number of training data to estimate their parameters. Naive Bayes Classifiers have been used extensively in text mining, where the dimensionality is very high as well as the volume of processed data. But,
the main disadvantage is that the Naive Bayes classi-fiers make a very strong assumption on the shape of data distribution. Indeed, they cannot learn interactions be-tween the features. Additionally, they suffer from zero conditional probability problem (division by zero) [14], where one solution would be to add some virtual exam-ples. Nevertheless, some studies have found that naive Bayesian classifiers, with appropriate pre-processing, can be comparable in performance with other classifi-cation algorithms [15, 16, 17, 18].
One of the main data mining techniques used in intru-sion detection systems is associated with deciintru-sion trees. They can be used to detect intrusions and anomalies in large datasets. A decision tree algorithm generates a tree structure where each internal node stands for a decision on a feature and each leaf node take a class label. There-fore, there is a path from the root node to the labeled leaf node which makes it easy to classify new unlabeled data. Note that choice of a certain branch depends on the result of the test on each internal node. Decision trees have several advantages compared to the other data min-ing based classification approaches, which make them more convenient for intrusion detection. In particular, they have a simply interpretable framework and they are less sensitive to the curse of dimensionality [19].
Neural Networks (NN) are modeled based on same analogy to the human brain working. Neural networks are a kind of artificial intelligence based methods for intrusion detection [20, 21, 22]. They consist of a con-nected set of processing units distributed several layers, namely input, hidden and output layers. Each connec-tion is characterized by a ’synaptic’ weight. The weights determine how the signal will propagate from one unit to the others. Neural networks benefit from their learn-ing algorithms to learn the relationship between inputs and outputs by adjusting the weights. Consequently, they are able to predict correct class label of input data. The main advantage of using neural networks classifiers over statistic ones lies in having a simple manner to sig-nify nonlinear relationships between features. However, they are computationally intensive methods to train and require in general a large set of positive and negative training instances. They are not widely used in intru-sion detection systems.
Random Forests (RF) [23] are a combination of deci-sion tree predictors. In the standard decideci-sion trees, each node is split using the best split among all the features, where in a RF, each node is split among a small subset of randomly selected input features. This strategy yields to perform very well in comparison with many other classifiers such as SVM and NN. Furthermore, it makes them robust against overfitting and an effective tool for
classification and prediction [24]. Random forests run efficiently on large datasets with many features and in addition, they can handle unbalanced data sets [25, 26]. 2.2. Unsupervised learning
Clustering (or unsupervised learning) is a process of grouping unlabeled data into set of clusters such that the similar samples are members of the same cluster and the dissimilar samples belong to the different clus-ters. In clustering, the number of classes and distribu-tion of instances among classes are not known a priori and the aim is to find meaningful and statistical struc-tures. Clustering is important since it is complementary to classification in real life situations. For instance, in [27] clustering is used in the area of dimensionality re-duction as a complementary step for text classification.
The clustering approaches can be classified accord-ing to: i) the type of input data to the algorithm, ii) the clustering criteria defining the similarity or distance between data points, and iii) the theory and fundamen-tal concepts. Consequently many clustering algorithms have been proposed in the literature, each one using a different scientific discipline. Authors in [28] sug-gested to divide the clustering algorithms into two main groups: hierarchical and partitioning. Han and Kam-ber in [29] proposed categorizing them into additional three main categories: density-based, model-based and grid-based methods. Hierarchical approaches make the clusters by recursively partitioning the data points in ei-ther a top-down or bottom-up manner. For example, in agglomerative hierarchical clustering, each data point initially represents a cluster of its own. Then clusters are merged, according to some similarity measure, until the desired cluster structure is obtained. The result of this clustering method is a dendrogram. Density-based methods assume the data points that belong to each clus-ter are drawn from a specific probability distribution [30]. The idea is to continue growing the given cluster as long as the density (or the number of data points) in the neighborhood exceeds some pre-defined threshold. The density-based methods are designed for discover-ing clusters of arbitrary shape which are not necessar-ily convex. Model-based clustering methods attempt to optimize the fit between the given data and some math-ematical models. These methods find characteristic de-scriptions for each group. Grid-based methods partition the space into a finite number of cells that form a grid structure. All of the operations for clustering are per-formed on the grid structure. They have the fastest pro-cessing time that typically depends on the number of the grids instead of the data points [29]. CLIQUE [31] and STING (STatistical INformation Grid approach) [32]
are examples of grid-based clustering algorithms used to cluster spatial databases.
The k-means clustering is among the most popular clustering algorithms, as it provides a good trade-off between quality of the solution obtained and its com-putational complexity [33]. Even though k-means was first proposed over 50 years ago [34, 35], it is still one of the most widely used algorithms for clustering [36, 37, 38, 39]. In practice, k-means is a clustering method that aims to find k centroids, one for each clus-ter, that minimize the sum of distances of each data in-stance from its respective cluster centroid. It finds a sub-optimal solution to the problem, for xi∈ X:
argmin {C1,...,Ck} k X j=1 X xi∈Cj d(xi, cj) (1)
where (C1, ..., Ck) are k clusters, cjis the representative
of cluster Cj, and d is a distance function (e.g. Ed).
The algorithm starts with an initial set of cluster cen-troids, chosen randomly or according to some heuristic procedure, and then uses an iterative refinement tech-nique. The refinement steps are repeated until the cen-troids no longer move. The complexity of each itera-tion of the k-means clustering algorithm performed on Ndata point is O(k × N). This linear complexity is one of the reasons for the popularity of the k-means clus-tering algorithms. Even if the number of data instance is substantially large, this algorithm is computationally attractive. Other reasons for the k-means algorithm’s popularity are simplicity of implementation and speed of convergence. Furthermore, a proof of the finite con-vergence (toward a local minimum) of the k-means al-gorithms is given in [40]. However, it requires to con-vert the categorical data into the numerical ones. 2.3. Semi-supervised learning
Semi-supervised learning is halfway between classi-fication and clustering. They can be applied in a com-bined way to overcome the limitations of each indi-vidual method and build a better classifier. In semi-supervised learning unlabeled data is used with the addi-tional information from the labeled ones. However, the labeled data are costly and time-consuming to achieve and require the efforts of experts. Apart from this con-cern, unlabeled data can easily be obtained in many real world applications. Recently, there is an increasing in-terest in the use of semi-supervised learning methods and these methods have attracted the attention of re-searchers working on machine learning and data mining based intrusion detection systems [41, 42, 43, 44, 45, 46].
So far, various data mining based methods in intru-sion detection has been employed. But the major obsta-cles are high false-alarm rates and lack of accuracy in their detection procedure [47, 48, 49].
3. The approach
In the literature, many studies have examined intru-sion detection in network traffic data. Some methods considered only packet header information and some others focused on packet payloads. In this work, we are interested in the packet payloads as well as the header information. Packet headers generally constitute only a small part of whole network traffic data, while payloads are more complicated. Accordingly, packet payloads analysis seems to be more costly rather than the analy-sis of packet header data, as it needs more computations and pre-processing processes. In this way, considering a proper pre-processing process of network traffic data and an efficient detection method is vital to deal with the network intrusions which are constantly evolving. 3.1. The big data context
Nowadays, the amount of data in networks is con-tinuously increasing. These data include system call or user command sequences, click streams, traffic flows, network packet information and so on, often character-ized in a high-dimensional space, leading to the curse of dimensionality, which challenge many data mining algorithms. Furthermore, in the era of big data, it is very difficult or even impossible for traditional mining approaches to handle such huge datasets. Hence, data cleaning, dimensionality and instance set reduction are crucial when data mining techniques are applied for in-trusion detection.
In general, to analyze the data in order to extract an acceptable knowledge in the scope of a given ap-plication, a process called Knowledge Discovery in Databases (KDD) can be used [50]. The KDD process steps can be summarized as follows:
- Selection: selection of data and a subset of features or samples to be analyzed
- Pre-processing and transformation: data cleaning (e.g. removal of noise and handling of missing data), data reduction, and projection of data - Data mining: choosing the algorithm(s) and
per-forming data mining
- Interpretation: interpreting the results that are ob-tained
Once an understanding of the application scheme and the goal for the process has been reached, a dataset must be created by acquiring the data as well as possibly ex-tracting a subset of suitable features in the data. This step is not a minor task, since acquiring real network traffic data can be difficult due to security concerns for legal reasons [51]. Conversely we can use a public syn-thetic data, however, it will also contain some limita-tions (e.g. the traffic data may not accurately repre-sent a real-world network). In this work, we consider a dynamic, scalable, reproducible and labeled benchmark dataset called ISCX [52], which can be considered as a relatively representative of real network traffic and will be detailed in Section 4.
3.2. The design choices
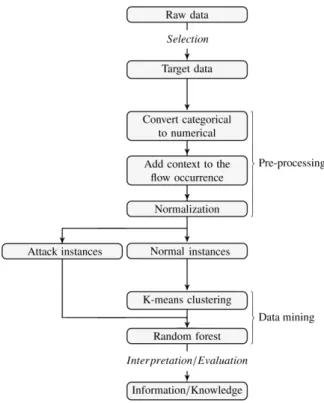
Here we explain in detail the proposed hybrid in-trusion detection (kM-RF). Figure 1 presents briefly the different steps of the suggested KDD process in a schematic view.
Figure 1: KDD process for the proposed kM-RF
3.2.1. Pre-processing: conversion of categorical fea-tures into numerical ones
Data pre-processing, a crucial task in the knowledge discovery process, can be even considered as a
funda-mental building block of data mining. Pre-processing involves cleaning the data and removing redundant and unnecessary entries. It also involves converting the fea-tures of the dataset into numerical data and saving in a machine-readable format. This can be essential because many data mining algorithms such as Support Vector Machines (SVMs), and K-Nearest Neighbors (KNNs) in pattern classification or k-means clustering require data to consist of purely numerical features. However many real world data consist of both numerical and cat-egorical features. Hence, here we suggest an effective method of converting categorical features into entirely numerical ones. When the categorical feature takes its values in some finite set of categories, one typical con-version method is to use a single number to represent a categorical value. For instance, the discrete values {HTTP, SMTP, SSH, IMAP, POP3, FTP} are converted into {1, 2, 3, 4, 5, 6} in order. But this approach de-pends on an arbitrary ordering of values in the categor-ical feature, so it can result in unreliable performances. Alternatively, we can adopt binary number representa-tion where we use m binary numbers to represent a m-category feature. For instance, {HTTP, SMTP, SSH, IMAP, POP3, FTP} is encoded into {000001, 000010, 000100, 001000, 010000, 100000}. However, if the number of categories for each categorical feature is too large, the dimension of input will be greatly increased, but this representation is more stable than the single number representation.
On the other hand, when a categorical feature takes its values in an infinite set of categories, we need to con-sider another conversion approach. To do so, we pro-pose to use histogram of distributions. First, we con-vert the categorical values into integers. Each ASCII1
character is encoded to its integer representation. For instance, the categorical value ’www.irisa.fr’ is con-verted to {87, 87, 87, 46, 73, 82, 73, 83, 65, 46, 70, 82}, or ’http://’ is encoded to {72, 84, 84, 80, 58, 47, 47}. Then, given the number of bins, we evaluate the his-togram of the distribution of numerical values. Figure 2 shows histogram of a sample HTTP payload2. Notice that the number of bins is a meta parameter which can be optimized using the training data and set up empiri-cally according to the application.
1American Standard Code for Information Interchange
2payloadAsBase64: SFRUUC8xLjEgMjAwIE9LDQpDb25uZWN0aW9uO iBjbG9zZQ0KRGF0ZTogU3 VuLCAxMyBKdW4gMjAxMCAwMjo1OQ==
Figure 2: Histogram of HTTP payload sample
3.2.2. Pre-processing: adding context to the flow oc-currence
In most of the cases, attacks are generated by a single host or small number of hosts. But some times attacks would be generated by a very large number of hosts at the same time (see Figure 3). For instance, in DDoS (Distributed Denial of Service), it is quite common to see attacks set up by hundreds of hosts, generating hun-dreds of megabits per second floods. Hence, to iden-tify an attack one can take advantage from the number of source-destination pairs in the network traffic data called ’fan-in/fan-out’. In this way, we add the num-ber of source-destination pairs in a pre-defined window size of flows as a dedicated feature. To do so, for each IP-destination in the flow, we evaluate the number of distinct IP-sources associated to this IP-destination, in the selected window. This added feature helps to detect network and IP scans as well as distributed attacks.
Figure 3: Denial of Service attack
3.2.3. Pre-processing: data normalization
Last, but not least, step prior to any data mining task concerns the normalization of the data. Data normal-ization plays a crucial role in the pre-processing of the data. Without normalization, features with significantly
larger values dominate the features with smaller values. There are different types of normalization such as min-max normalization, decimal scaling and standard devi-ation method. Choosing a good normalizdevi-ation method depends on the application and the algorithm in which the normalized data will be used. Here we use min-max normalization approach, which is a simple normaliza-tion technique in which we fit the data, in a pre-defined range, as it is very common and usually more efficient [53]. To normalize the data in the boundary of [A, B], the min-max normalization is defined as:
xinormalized =
(xi− min(x))
(max(x) − min(x))× (B − A)+ A (2) 3.2.4. K-means for instance set reduction
In this subsection, we present a useful semi-supervised way to reduce the size of the data (i.e. in-stance set) by using the k-means clustering algorithm. Practically, the network traffic data is categorized in two kind of activities: normal and attack. Since real net-work data contains very few attack flows compared to ’normal’ flows, in instance set reduction, we are mainly interested in decreasing the size of normal data.
To do so, k-means clustering is applied on normal data to find k number of clusters, pre-specified by the user (e.g. elbow method, see Figure 4), which are rep-resented by their centroids, by minimizing the distance function in Eq. 1 (Figure 5-(b)). Then, instead of re-moving all the normal data instances and keep just their kcentroids, we remove only the normal data instances in p clusters (p < k and pre-set by the user3), which are farthest from the training attack data (Figure 5-(c)). Lastly, the k centroids are labeled as the normal data (Figure 5-(d)).
Figure 4: The elbow method suggests k=3 cluster solutions
Figure 5: K-means clustering: (a) normal (’o’) and attack (’+’) training data (b) centroids of normal data (c) normal data instance set reduction (d) label estimated centroids as
normal training data
The main idea of the proposed strategy is to remove a huge number of data points that are not important (or at least that are less important) because of their location far away from the decision frontier.
3.2.5. Random Forest classifying the flows
Due to considering both header and payload pack-ets in our intrusion detection experiments, increasing the number of network traffic features is an undesirable condition. Furthermore, as mentioned previously, the real-world network communication data usually con-tains very few attack flows comparatively to normal flows, which build an imbalanced classification prob-lem. To address the above mentioned issues, Random Forest method can be used with great efficiency.
Random Forest [23] is an ensemble of unpruned clas-sification or regression trees, which generates many classification trees such that each tree is constructed from a different bootstrap sample randomly drawn from the original data. After the forest is formed, a new data that needs to be classified is presented to each of the tree in the forest for classification. Each tree gives a vote that signifies the tree’s decision about the class of the object. After a large number of trees is generated, the forest vote for the most popular class label. In addition to its excellence in accuracy comparatively to current data mining algorithms, the main characteristics of the Random Forests are the following:
- They are robust against over-fitting compared to many other classifiers.
- They run efficiently on huge datasets with many features.
- They can handle unbalanced datasets. and lastly,
- They can rank the features according to their rela-tive contributions to the classification decisions. In summary, results of intrusion detection approaches showed that a higher efficiency rate is achieved when a Random Forest is applied [54, 55, 56]. Hence, we build our hybrid intrusion detection method on the basis of a Random Forest classifier. The proposed k-means clustering pre-processing results can be used as input data for a Random Forest classifier trained for detecting the intrusions. We called this hybrid intrusion detection method as kM-RF. It is able to detect network intrusions with high detection rate, lower false alarm and consid-erably lower time consumption. In the next section, to have a closer look at the ability of the proposed hybrid classifier (kM-RF) to detect intrusions, we detailed ex-tensive quantitative and qualitative experiments.
4. Experimentation
In this section, we first describe the dataset used to conduct our experiments, then specify the validation process, prior to present and discuss the results that we obtained.
4.1. The ISCX dataset
The ISCX dataset 2012 [52], which has been pre-pared at the Information Security Centre of Excellence at the University of New Brunswick, is used to perform experiments and evaluate the performance of our pro-posed approach. The entire ISCX labeled dataset com-prises over two million traffic packets which are de-scribed using 20 features. It covers seven days of net-work activities and contains normal and attack traffic data (attack data representing 2% of the whole traffic). Four different attack types, referred to as Brute Force SSH, Infiltrating, HTTP DoS, and DDoS are conducted and logged along with normal traffic on 7 successive days. Despite some minor disadvantages4, ISCX re-mains the most up to date dataset compared to the other commonly explored datasets [57, 58, 52].
As input to the data mining process, we make use of the pre-processed flows. First of all, flows are classi-fied according to their application layers such as HTTP Web, SSH, FTP, ICMP and so on. Because the nor-mal traffic patterns look very different depending on the
Figure 6: MultiDimensional Scaling (MDS): structures underlying ISCX data subsets before the pre-processing (left) and after the proposed pre-processing procedure (right), ’+’ attacks (red) and ’o’ normal data (blue)
application or service and it is more efficient to build an intrusion detector for each of these application lay-ers. In this context, for each application layers class, a flow is defined by 50 features5. Note that, we have
5destination Payload0, destination Payload1, ..., destination Payload9, des-tinationPort, destination TCPflags0, destination TCPflags1, ..., destination TCPflags5, direction0, direction1, ..., direction3, protocolName0, protocol-Name1, ..., protocolName5, source Payload0, source Payload1, ..., source Pay-load9, sourcePort, source TCPFlags0, source TCPFlags1, ..., source TCPFlags5, duration, total destination Bytes, total destination Packets, total source Bytes, total source Packets, # of source-destination IP pairs (’fan-in’/’fan-out’)
removed the IP addresses for the experiments, because the IP addressess can not generalize the behaviour of at-tacks. Nevertheless the IP addresses are accounted into the calculation of the ’fan-in/fan-out’ feature, which has been defined in the pre-porcessing section.
To visualize the underlying structure of ISCX dataset classes, we have performed a multidimensional scaling [59] on Euclidean pairwise distance matrix. Figure 6 shows the structures of various applications of ISCX data in 3-dimensional space before and after the
pro-posed pre-processing procedure. To plot the underlying structure of raw data, the categorical features are first digitized. The representations obtained can be consid-ered as representative images of the underlying struc-tures.
As one can see, the data represented by the proposed numerical feature vector has diverse structures and shapes and the attack (’+’, red) and normal (’o’, blue) classes are poorly separable before the pre-processing procedure, while using the proposed pre-processing method they are relatively much more separated from each other. To validate our claim, we rely on the cluster Silhouette measure, which is based on the comparison between tightness and separation. The Silhouette is cal-culated using the mean intra-cluster distance (a) and the mean of nearest-cluster distance (b) for each data point, and for an instance is equal to (b - a)/ max(a, b). To clarify, b is the distance between a data point and the nearest cluster that the point is not a part of. The crite-rion returns the mean of Silhouette coefficient over all data points and is defined as:
1 N X x (b(x)− a(x)) max(b(x), a(x)) , ∈ [−1, +1]
where x is a data point and N is the total number of instances.
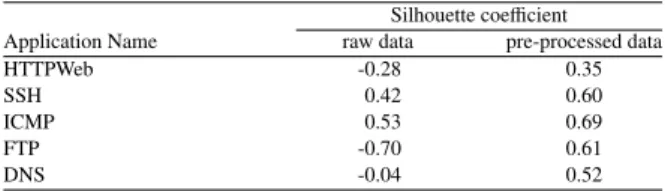
The higher the Silhouette coefficient, the more iso-lated the clusters are. Table 1 presents some different types of network application layer samples contained in the ISCX dataset with their respective Silhouette co-efficient for raw and pre-processed data. As demon-strated, for all tested applications, once the proposed pre-processing procedure has been applied the Silhou-ette coefficient is increased.
Silhouette coefficient Application Name raw data pre-processed data
HTTPWeb -0.28 0.35
SSH 0.42 0.60
ICMP 0.53 0.69
FTP -0.70 0.61
DNS -0.04 0.52
Table 1: Silhouette coefficient for some tested applications
From Table 1, we can verify that the application layer subsets are more separated after the proposed pre-processing rather than the raw data, since the Silhou-ette coefficient increases for all the tested subsets. The more separable classes are the less computationally ex-pensive and complex to train a classifier. The results reveal that the ICMP application subset has the highest Silhouette coefficient, which means there are more sep-arable classes in the pre-processed ICMP subset than
the rest. On the other hand, as can be seen in Table 1, a big increase rate for the Silhouette coefficient crite-rion is obtained for FTP, HTTPWeb and DNS applica-tion layer subsets, which illustrates the vital role of the pre-processing procedure.
4.2. Validation process
Here we compare the proposed intrusion detection al-gorithm (denoted as kM-RF) with the state of the art intrusion detection methods (i.e. SVM, 1-NN, Naive Bayes, Decision Tree, Neural Network and RF).
For our comparisons, we rely on the ’Accuracy’, ’De-tection Rate’ and ’False Alarm Rate’, measures which are commonly used in the literature, to evaluate each method. Table 2 presents the classical confusion matrix in terms of TP (True Positive), FP (False Positive), TN (True Negative) and FN (False Negative) values which are used in the performance metrics6.
Predicted class
Positive class Negative class
Actual
Positive class TP (True Positive) FN (False Negative) Negative class FP (False Positive) TN (True Negative)
Table 2: Confusion matrix
Lastly, the comparison measures ’Accuracy’, ’Detec-tion Rate’ and ’False Alarm Rate’ are defined as:
Accuracy = T P+ T N T P+ FN + FP + T N Detection Rate = T P
T P+ FN False Alarm Rate = FP
FP+ T N
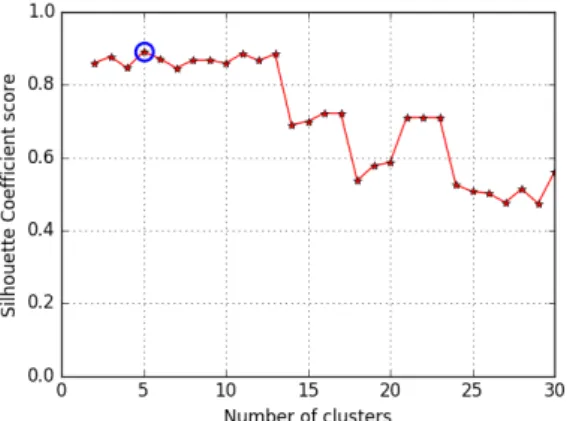
The ’Accuracy’ and ’Detection Rate’ lies in [0, 100] in percentage. The higher index, the better the agree-ment is. In the other side, the lower ’False Alarm Rate’ illustrates the better result. Training and testing sets are formed by k-fold cross validation in the ratio of 80% and 20% of the network traffic, respectively. For all the protocol subsets, the parameter k in k-means clus-tering is estimated using the elbow method process (and Silhouette coefficient [60]). A higher Silhouette coeffi-cient indicates that the data instances are well matched into their own cluster and poorly matched to the neigh-boring clusters. For instance, using the elbow curve, Figure 7 shows that the best number of clusters when
pre-processing (normalization) applied, for SSH proto-col, is k=5. Furthermore, as one can see in Figure 8, k=5 has the highest Silhouette coefficient score for SSH sub-set, which proves that 5 is the optimal value for number of clusters in k-means clustering.
Figure 7: Diagram of Elbow for k-means clustering: SSH application layer
Figure 8: Silhouette coefficient for k-means clustering: SSH application layer
For all the state of the art methods, the parameters are estimated through a standard line/grid search process. For instance, for the Random Forest classifier, 3 param-eters are tuned: maximum number of features, number of trees and minimum sample leaf size. Finally, the re-sults reported hereinafter are averaged after 10 repeti-tions of the corresponding algorithm.
4.3. Experimental results
In the context of intrusion detection, the ’Accuracy’, the ’Detection Rate’ and the ’False Alarm Rate’ for each method, and for the various tested protocols, are re-ported in Tables 3, 4 and 5, respectively. Note that,
for all the detection methods, we have used the pre-processed data. Results in bold correspond to the best assessment values.
appName SVM 1-NN Naive Decision Neural RF kM-RF Bayes Tree Network
HTTPWeb 98.99 99.70 98.04 99.89 99.02 99.88 99.91 SSH 99.47 99.90 99.22 99.87 99.89 99.89 99.98 ICMP 99.83 99.95 99.90 99.99 99.93 99.99 100.0 FTP 99.62 99.95 99.54 99.97 99.94 99.97 99.97 DNS 99.98 99.99 96.18 99.98 99.98 99.99 99.99
Table 3: Comparison of ’Accuracy’ (in %)
appName SVM 1-NN Naive Decision Neural RF kM-RF Bayes Tree Network
HTTPWeb 98.20 97.47 92.74 99.12 98.75 99.38 99.51 SSH 99.78 99.95 99.34 99.92 99.95 99.97 100.0 ICMP 97.44 99.74 100.0 100.0 98.68 100.0 100.0 FTP 87.20 99.36 99.79 99.36 98.52 99.79 99.83 DNS 52.31 86.15 52.31 89.61 18.46 89.23 95.38
Table 4: Comparison of ’Detection Rate’ (in %)
appName SVM 1-NN Naive Decision Neural RF kM-RF Bayes Tree Network
HTTPWeb 0.96 0.16 1.64 0.05 0.96 0.08 0.05 SSH 1.39 0.23 1.11 0.26 0.26 0.33 0.12 ICMP 0.08 0.04 0.10 0.01 0.03 0.01 0.00 FTP 0.18 0.04 0.46 0.02 0.03 0.02 0.02 DNS 0.01 3.81 0.01 0.01 0.01 0.00 0.00
Table 5: Comparison of ’False Alarm Rate’ (in %)
According to the Table 3, one can note that kM-RF method leads to the best accuracy results overall (5 ap-plication out of 5), followed by Random Forest (RF), decision tree and nearest neighbors. Table 4 shows that kM-RF obtains the highest ’Detection Rate’ for all the application layer types. Finally, according to the ’False Alarm Rate’ measure presented in Table 5, kM-RF leads to the best results in overall (5 application out of 5), with the lowest ’False Alarm Rate’, followed by Ran-dom Forest (RF) and decision tree algorithms.
To consolidate the comparative results, we use a Wilcoxon signed rank test , which is a nonparamet-ric statistical hypothesis test to effectively determine whether the proposed kM-RF is significantly better than the other methods. Tables 6 till 8 present the two-sided p-value for the hypothesis test, while the results in bold indicate the significantly different classifiers. The p-value is the probability of observing a test statistic more extreme than the observed value under the null hypoth-esis. The null hypothesis (H0) is strongly rejected while
the p-values are lower than 0.05, meaning that the di ffer-ences between the two tested classifiers are significant and the uniform hypothesis is accepted as p-values are
greater than 0.05. Based on the p-values displayed in Table 6, 7 and 8, we can justify that the proposed kM-RF leads to significantly better results than the others. Note that the difference between the pairs of classifiers results follows a symmetric distribution around zero and to be more precise, the reported p-values are computed from all the individual results of different k-folds of each pro-tocol for the corresponding algorithm.
1-NN Naive Decision Neural RF kM-RF Bayes Tree Network
SVM 0.001 0.06 <0.001 <0.001 <0.001 <0.001 1-NN <0.001 0.02 <0.001 0.01 <0.001 Naive Bayes <0.001 <0.001 <0.001 <0.001 Decision Tree <0.001 0.77 <0.001 Neural Network <0.001 <0.001 RF <0.001
Table 6: P-value: Wilcoxon test (’Accuracy’)
1-NN Naive Decision Neural RF kM-RF Bayes Tree Network
SVM 0.01 0.08 <0.001 0.09 <0.001 <0.001 1-NN 0.003 0.02 0.02 0.002 <0.001 Naive Bayes <0.001 0.21 <0.001 <0.001 Decision Tree 0.03 0.12 0.009 Neural Network 0.002 <0.001 RF 0.002
Table 7: P-value: Wilcoxon test (’Detection Rate’)
1-NN Naive Decision Neural RF kM-RF Bayes Tree Network
SVM 0.002 0.20 <0.001 0.004 <0.001 <0.001 1-NN <0.001 0.002 <0.001 0.05 <0.001 Naive Bayes <0.001 0.06 <0.001 <0.001 Decision Tree <0.001 0.10 0.002 Neural Network <0.001 <0.001 RF 0.002
Table 8: P-value: Wilcoxon test (’False Alarm Rate’)
With regard to the p-values of Wilcoxon test , for all the application layer subsets, the proposed kM-RF brings a significant improvement compared to the other methods. The decision tree and the Random Forest (RF) algorithms perform very comparatively since their pair-wise differences are not significant. Similarly, the Naive Bayes classifier performs comparatively to the SVM.
We experimentally show that for the intrusion detec-tion task, the proposed kM-RF method is performing significantly better than the state of the art approaches. However, generating the trees of the RF is very time consuming especially for large datasets. As mentioned before, to overcome this problem, we used a semi-supervised way to reduce the size of the data by using k-means clustering in kM-RF to support an instance se-lection method. Table 9 shows the impact of the
in-stance set reduction. For inin-stance, the HTTPWeb ap-plication layer subset of ISCX includes 681,151 normal flows, while after the pre-processing it has been reduced to 367,440 flows, with 46% of reduction rate, or the DNS application layer which consists 309,286 normal flows has been reduced to 55,260 flows, with 82% of reduction rate.
Size ([ #Normal , #Attack ] , #Features) appName Raw data Pre-processed data HTTPWeb ([ 681151 , 40351 ] , 20) ([ 367440 , 40351 ] , 50) SSH ([ 2585 , 7305 ] , 20) ([ 1645 , 7305 ] , 50) ICMP ([ 7919 , 295 ] , 20) ([ 1270 , 295 ] , 50) FTP ([ 13181 , 226 ] , 20) ([ 5300 , 226 ] , 50) DNS ([ 309286 , 73 ] , 20) ([ 55260 , 73 ] , 50)
Table 9: Comparison of ’Data Size’ (flows)
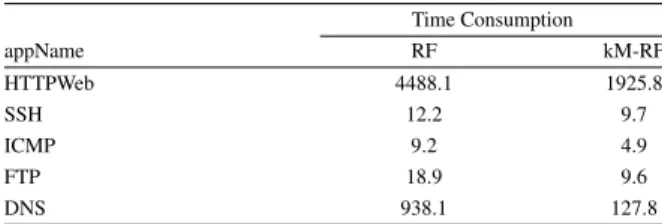
Due to this instance set reduction, an important im-provement of the detection run time is achieved. To sustain our claim, Table 10 illustrates the comparison of time consumption between the standard RF and the proposed kM-RF7. As one can see, when the data size
is large (the case for HTTPWeb with more than 700,000 flows and for DNS with more than 300,000 flows), the reduction ratio of time consumption is very large.
Time Consumption appName RF kM-RF HTTPWeb 4488.1 1925.8 SSH 12.2 9.7 ICMP 9.2 4.9 FTP 18.9 9.6 DNS 938.1 127.8
Table 10: Comparison of ’Time Consumption’ (in seconds)
4.3.1. Visualizing the importance of the features / weights
To have a closer look and compare globally the di ffer-ent patterns between the ’normal’ and the ’attack’ flows, here we visualize the mean with the standard deviation of the flow features for both categories. Figure 9 shows mean of feature flow for HTTPWeb application layer.
According to the Figure 9, for some features such as payloads, TCPFlags, direction and # of source-destination IP pairs, there is an evident difference be-tween their means values in ’normal’ and ’attack’ flows, which helps to distinguish an intrusion from the nor-mal behaviour. Hence, one can identify the role of dif-ferent features in normal and attack traffic behaviour.
dPayload0 dPayload1 dPayload2 dPayload3 dPayload4 dPayload5 dPayload6 dPayload7 dPayload8 dPayload9
dPort
dTCPFlags0 dTCPFlags1 dTCPFlags2 dTCPFlags3 dTCPFlags4 dTCPFlags5 direction0 direction1 direction2 direction3 pName0 pName1 pName2 pName3 pName4 pName5 sPayload0 sPayload1 sPayload2 sPayload3 sPayload4 sPayload5 sPayload6 sPayload7 sPayload8 sPayload9
sPort
sTCPFlags0 sTCPFlags1 sTCPFlags2 sTCPFlags3 sTCPFlags4 sTCPFlags5 duration dBytes dPackets
sBytes
sPackets #pair IPs
0.0
0.2
0.4
0.6
0.8
1.0
1.2
mean attacks
mean normals
Figure 9: Feature means (with standard deviation): HTTPWeb application layer
dPayload0 dPayload1 dPayload2 dPayload3 dPayload4 dPayload5 dPayload6 dPayload7 dPayload8 dPayload9
dPort
dTCPFlags0 dTCPFlags1 dTCPFlags2 dTCPFlags3 dTCPFlags4 dTCPFlags5 direction0 direction1 direction2 direction3 pName0 pName1 pName2 pName3 pName4 pName5 sPayload0 sPayload1 sPayload2 sPayload3 sPayload4 sPayload5 sPayload6 sPayload7 sPayload8 sPayload9
sPort
sTCPFlags0 sTCPFlags1 sTCPFlags2 sTCPFlags3 sTCPFlags4 sTCPFlags5 duration dBytes dPackets
sBytes
sPackets #pair IPs
0.00
0.05
0.10
0.15
0.20
0.25
0.30
feature weights
Figure 10: Feature weights: HTTPWeb application layer
For instance, looking closer to the ’fan-in/fan-out’ (i.e. # pairIPs) feature, we can see that the mean value for the attacks is extremely higher than the mean value for the normal data. This is a signature for HTTP at-tacks, while the number of destination IPs equals one (nDst=1), source IPs (nSrc) should be greater than a threshold value.
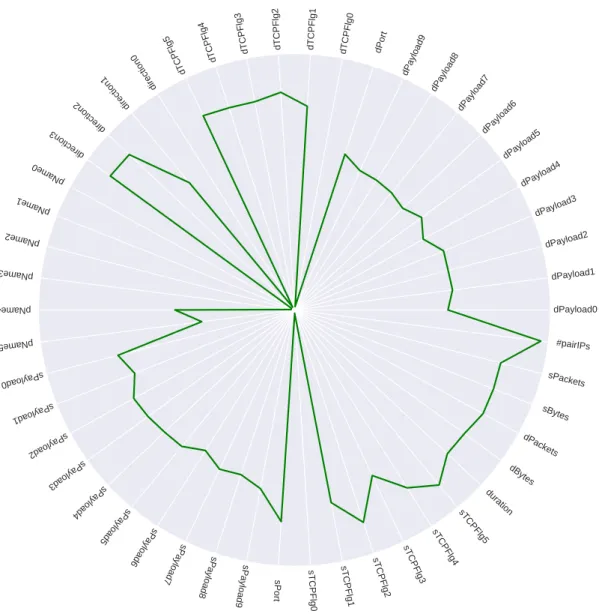
To visualize the importance of each feature, we rely on the RF algorithm. RF has a unique mechanism to cal-culate the importance of the features and select the most relevant and influential features. In first step, permuta-tion importance index is used to rank the features and then in next step, RF is used to select the best subset of features for classification. Figure 10 presents the flows’ feature weights for the HTTPWeb application layer. As one can see, the highest weight belongs to the last fea-ture (# of source-destination IP pairs), the added feafea-ture in pre-processing step, which emphasizes the role of the representation of the ’fan-in’ and ’fan-out’ features in intrusion detection. Lastly, to see the importance of the weights more clearly, Figure 11 shows a ’Radar’ chart
for log of the feature weights for the HTTPWeb applica-tion layer. Radar Charts are a way of comparing multi-ple quantitative features. They are useful for highlight-ing which features have similar values, which features do not matter much, or which features are scoring high (or low) within a dataset. This makes them ideal for displaying feature importance. Each feature is provided with an axis that starts from the center with a specific range that depends on the normalization procedure. The Figure 11 justifies our claim about the importance of the added features such as # of source-destination IP pairs (’fan-in/fan-out’). It also illustrates that some features such as protocolName does not matter very much.
5. Conclusion
This research work introduces a hybrid data mining based intrusion detection. For this, we proposed i) a dedicated pre-processing procedure to convert the cate-gorical features to numerical ones and to build more iso-lated classes from the raw data, ii) some new features to
dPayload0 dPayload1 dPayload2 dPayload3 dPayload4 dPayload5 dPayload6 dPayload7 dPayload8 dPayload9 dPort dTCPFlg0 dTCPFlg1 dTCPFlg2 dTCPFlg3 dTCPFlg4 dTCPFlg5 direction0 direction1 direction2 direction3 pName0 pName1 pName2 pName3 pName4 pName5 sPayload0 sPayload1 sPayload2 sPayload3 sPayload4 sPayload5 sPayload6 sPayload7 sPayload8 sPayload9 sPort sTCPFlg0 sTCPFlg1 sTCPFlg2 sTCPFlg3 sTCPFlg4 sTCPFlg5 duration dBytes dPackets sBytes sPackets #pairIPs
Figure 11: Feature weights (log): HTTPWeb application layer
consider payloads, IP scans and distributed attacks and iii) a combination of k-means and random forest classi-fier to detect intrusion more effectively.
The efficiency of the suggested hybrid approach (kM-RF) is analyzed on a dynamic, scalable and labeled benchmark dataset called as ISCX, which is the most up to date dataset compared to the other commonly ex-plored ones for data intrusion benchmarking. The re-sults show the benefits of the kM-RF, which outper-forms the other state of the art methods through the high accuracy, high detection rate and low false alarm rate, overall. A Wilcoxon signed rank test is used to de-termine that the proposed kM-RF detection approach is significantly better than the other methods. In addition,
the experimentation carried out on some tested proto-cols shows that we can achieve considerable improve-ments in the time consumption thanks to the instance set reduction using k-means clustering, while meantime it may even improve the detection efficiency. Finally, de-tailed analyses of the importance of each feature and the impact of the added features in the pre-processing step are provided. As a perspective, the importance of the features obtained by the RF algorithm can be used for dimensionality reduction. Even, by considering this portance as weights in k-means clustering, one can im-prove the results using more accurate clusters and cen-troids during the pre-processing procedure.
References
[1] S. Agrawal, J. Agrawal, Survey on anomaly detection using data mining techniques, Computer Science 60 (2015) 708 – 713. [2] S. Duque, M. N. bin Omar, Using data mining algorithms for
de-veloping a model for intrusion detection system (ids), Procedia Computer Science 61 (2015) 46 – 51.
[3] W. Feng, Q. Zhang, G. Hu, J. X. Huang, Mining network data for intrusion detection through combining {SVMs} with ant colony networks, Future Generation Computer Systems 37 (2014) 127 – 140.
[4] G. Nadiammai, M. Hemalatha, Effective approach toward intru-sion detection system using data mining techniques, Egyptian Informatics Journal 15 (1) (2014) 37 – 50.
[5] V. G. Priyanka, N. U. Kishori, A. M. Shoeb, D. I. Sagar, A. K. Bhavana, A proposed system for network intrusion detection system using data mining, ICCIA (8) (2012) –.
[6] S.-Y. Wu, E. Yen, Data mining-based intrusion detectors, Expert Systems with Applications 36 (3, Part 1) (2009) 5605 – 5612. [7] G. I. Allen, Automatic feature selection via weighted
kernels and regularization, Journal of Computational and Graphical Statistics 22 (2) (2013) 284–299. doi:10.1080/10618600.2012.681213.
[8] B. Cao, D. Shen, J.-T. Sun, Q. Yang, Z. Chen, Feature selection in a kernel space, in: Proceedings of the 24th International Con-ference on Machine Learning, ICML ’07, ACM, New York, NY, USA, 2007, pp. 121–128.
[9] R.-C. Chen, K.-F. Cheng, Y.-H. Chen, C.-F. Hsieh, Using rough set and support vector machine for network intrusion detection system, in: Proceedings of the 2009 First Asian Conference on Intelligent Information and Database Systems, ACIIDS ’09, IEEE Computer Society, Washington, DC, USA, 2009, pp. 465– 470. doi:10.1109/ACIIDS.2009.59.
[10] A. Das, J. F. C. Joseph, B.-S. Lee, B.-C. Seet, Cross-layer detec-tion of sinking behavior in wireless ad hoc networks using svm and fda, IEEE Transactions on Dependable and Secure Comput-ing 8 (2011) 233–245.
[11] F. E. Heba, A. Darwish, A. E. Hassanien, A. Abraham, Princi-ple components analysis and support vector machine based in-trusion detection system., in: ISDA, IEEE, 2010, pp. 363–367. [12] V. Hautamaki, I. Karkkainen, P. Franti, Outlier detection
us-ing k-nearest neighbour graph, in: Proceedus-ings of the Pattern Recognition, 17th International Conference on (ICPR’04), IEEE Computer Society, Washington, DC, USA, 2004, pp. 430–433. doi:10.1109/ICPR.2004.671.
[13] W. Li, P. Yi, Y. Wu, L. Pan, J. Li, A new intrusion detection system based on knn classification algorithm in wireless sensor network, Journal of Electrical and Computer Engineering. [14] P. Domingos, M. Pazzani, On the optimality of the simple
bayesian classifier under zero-one loss, Machine Learning 29 (2) (1997) 103–130. doi:10.1023/A:1007413511361.
[15] A. Ashari, I. Paryudi, A. M. Tjoa, Performance comparison between na¨ıve bayes, decision tree and k-nearest neighbor in searching alternative design in an energy simulation tool, Inter-national Journal of Advanced Computer Science and Applica-tions(IJACSA) 4 (11).
[16] R. Entezari-Maleki, A. Rezaei, B. Minaei-Bidgoli, Comparison of classification methods based on the type of attributes and sample size., JCIT 4 (3) (2009) 94–102.
[17] M. Kukreja, S. A. Johnston, P. Stafford, Comparative study of classification algorithms for immunosignaturing data., BMC Bioinformatics 13 (2012) 139.
[18] A. C. Lorena, L. F. Jacintho, M. F. Siqueira, R. D. Giovanni, L. G. Lohmann, A. C. de Carvalho, M. Yamamoto, Comparing
machine learning classifiers in potential distribution modelling, Expert Systems with Applications 38 (5) (2011) 5268 – 5275. [19] V. J. Hodge, J. Austin, A survey of outlier detection
method-ologies, Artificial Intelligence Review 22 (2) (2004) 85–126. doi:10.1007/s10462-004-4304-y.
[20] H. Debar, M. Becker, D. Siboni, A neural network component for an intrusion detection system, in: Proceedings 1992 IEEE Computer Society Symposium on Research in Security and Pri-vacy, USENIX Association, Berkeley, CA, USA, 1992, pp. 240– 250.
[21] A. K. Ghosh, A. Schwartzbard, A study in using neural net-works for anomaly and misuse detection, in: Proceedings of the 8th Conference on USENIX Security Symposium - Volume 8, SSYM’99, USENIX Association, Berkeley, CA, USA, 1999, pp. 12–12.
[22] J. Ryan, M.-J. Lin, R. Miikkulainen, Intrusion detection with neural networks, in: M. I. Jordan, M. J. Kearns, S. A. Solla (Eds.), Advances in Neural Information Processing Systems 10, Cambridge, MA: MIT Press, 1998, pp. 943–949.
[23] L. Breiman, Random forests, Machine Learning 45 (1) (2001) 5–32. doi:10.1023/A:1010933404324.
[24] A. Liaw, M. Wiener, Classification and regression by random forest, R News 2 (3) (2002) 18–22.
[25] J. Zhang, M. Zulkernine, Network intrusion detection using ran-dom forests., in: PST, 2005.
[26] J. Zhang, M. Zulkernine, A. Haque, Random-forests-based net-work intrusion detection systems, in: IEEE Transactions on Sys-tems, Man, and Cybernetics, Vol. 8, 2008, pp. 649 – 659. [27] A. Kyriakopoulou, T. Kalamboukis, Combining clustering with
classification for spam detection in social bookmarking systems, 2008.
[28] C. Fraley, A. Raftery, How many clusters? which clustering methods? answers via model-based cluster analysis, Computer Journal 41 (1998) 578–588.
[29] J. Han, M. Kamber, Data mining: Concepts and techniques, Morgan Kaufmann Publishers, USA.
[30] J. D. Banfield, A. E. Raftery, Model-based gaussian and non-gaussian clustering, in: Biometrics, Vol. 49, 1993, pp. 803–821. [31] R. Agrawal, J. Gehrke, D. Gunopulos, P. Raghavan, Auto-matic subspace clustering of high dimensional data for data mining applications, SIGMOD Rec. 27 (2) (1998) 94–105. doi:10.1145/276305.276314.
[32] W. Wang, J. Yang, R. R. Muntz, Sting: A statistical information grid approach to spatial data mining, in: Proceedings of the 23rd International Conference on Very Large Data Bases, VLDB ’97, Morgan Kaufmann Publishers Inc., San Francisco, CA, USA, 1997, pp. 186–195.
[33] D. Arthur, S. Vassilvitskii, K-means++: The advantages of care-ful seeding, Proceedings of the Eighteenth Annual ACM-SIAM Symposium on Discrete Algorithms (2007) 1027–1035. [34] G. Ball, D. Hall, Isodata: A novel method of data analysis and
pattern classification, Tech. rep., Stanford Research Institute, Menlo Park (1965).
[35] J. MacQueen, Some methods for classification and analysis of multivariate observations, in: Proceedings of the Fifth Berkeley Symposium on Mathematical Statistics and Probability, Volume 1: Statistics, University of California Press, Berkeley, Calif., 1967, pp. 281–297.
[36] M. Jianliang, S. Haikun, B. Ling, The application on intru-sion detection based on k-means cluster algorithm, in: Pro-ceedings of the 2009 International Forum on Information Tech-nology and Applications - Volume 01, IFITA ’09, IEEE Com-puter Society, Washington, DC, USA, 2009, pp. 150–152. doi:10.1109/IFITA.2009.34.
ap-proach to analyze nsl-kdd intrusion detection dataset, Interna-tional Journal of Soft Computing and Engineering (IJSCE). [38] Y. Liu, W. Li, Y.-C. Li, Network traffic classification using
k-means clustering, in: Proceedings of the Second International Multi-Symposiums on Computer and Computational Sciences, IMSCCS ’07, IEEE Computer Society, Washington, DC, USA, 2007, pp. 360–365. doi:10.1109/IMSCCS.2007.61.
[39] G. M¨unz, S. Li, G. Carle, Traffic anomaly detection using kmeans clustering, in: In GI/ITG Workshop MMBnet, 2007. [40] S. Z. Selim, M. A. Ismail, K-means-type algorithms: A
general-ized convergence theorem and characterization of local optimal-ity, IEEE Trans. Pattern Anal. Mach. Intell. 6 (1) (1984) 81–87. doi:10.1109/TPAMI.1984.4767478.
[41] B. Agarwal, N. Mittal, Hybrid approach for detection of anomaly network traffic using data mining techniques, Procedia Technology 6 (2012) 996 – 1003.
[42] R. A. R. Ashfaq, X.-Z. Wang, J. Z. Huang, H. Abbas, Y.-L. He, Fuzziness based semi-supervised learning approach for intru-sion detection system, Information Sciences 378 (2017) 484 – 497.
[43] R. M. Elbasiony, E. A. Sallam, T. E. Eltobely, M. M. Fahmy, A hybrid network intrusion detection framework based on random forests and weighted k-means, Ain Shams Engineering Journal 4 (4) (2013) 753 – 762.
[44] A. Purohit, H. Gupta, Hybrid intrusion detection system model using clustering, classification and decision table, IOSR Journal of Computer Engineering 9 (4) (2013) 103 – 107.
[45] C. T. Symons, J. M. Beaver, Nonparametric semi-supervised learning for network intrusion detection: Combining perfor-mance improvements with realistic in-situ training, in: Proceed-ings of the 5th ACM Workshop on Security and Artificial In-telligence, AISec ’12, ACM, New York, NY, USA, 2012, pp. 49–58.
[46] W. Yassin, N. I. Udzir, Z. Muda, M. N. Sulaiman, Anomaly-based intrusion detection through k-means clustering and naives bayes classification, in: 4th International Conference on Com-puting and Informatics (ICOCI), 2013, pp. 298–303.
[47] Abhaya, K. Kumar, R. Jha, S. Afroz, Data mining techniques for intrusion detection: A review, International Journal of Ad-vanced Research in Computer and Communication Engineering 3 (2014) 6938 – 6942.
[48] Z. Dewa, L. A. Maglaras, Data mining and intrusion detection systems, International Journal of Advanced Computer Science and Applications (IJACSA) 7 (1). doi:10.1587/transinf.2015EDP7357.
[49] W. Lee, S. J. Stolfo, Data mining approaches for intrusion detec-tion, in: Proceedings of the 7th Conference on USENIX Secu-rity Symposium - Volume 7, SSYM’98, USENIX Association, Berkeley, CA, USA, 1998, pp. 6–6.
[50] U. M. Fayyad, G. Piatetsky-Shapiro, P. Smyth, Advances in knowledge discovery and data mining, American Association for Artificial Intelligence, Menlo Park, CA, USA, 1996, Ch. From Data Mining to Knowledge Discovery: An Overview, pp. 1–34.
[51] R. Sommer, V. Paxson, Outside the closed world: On using ma-chine learning for network intrusion detection, in: Proceedings of the 2010 IEEE Symposium on Security and Privacy, SP ’10, IEEE Computer Society, Washington, DC, USA, 2010, pp. 305– 316. doi:10.1109/SP.2010.25.
[52] A. Shiravi, H. Shiravi, M. Tavallaee, A. A. Ghorbani, To-ward developing a systematic approach to generate bench-mark datasets for intrusion detection, Computer Security 31 (3) (2012) 357–374. doi:10.1016/j.cose.2011.12.012.
[53] J. Han, Data Mining: Concepts and Techniques, Morgan Kauf-mann Publishers Inc., San Francisco, CA, USA, 2005.
[54] A. R. Statnikov, C. F. Aliferis, Are random forests better than support vector machines for microarray-based cancer classifica-tion?, in: AMIA 2007, American Medical Informatics Associa-tion Annual Symposium, Chicago, IL, USA, November 10-14, 2007, 2007.
[55] M. Fern´andez-Delgado, E. Cernadas, S. Barro, D. Amorim, Do we need hundreds of classifiers to solve real world classification problems?, Journal of Machine Learning Research 15 (2014) 3133–3181.
[56] M. Wainberg, B. Alipanahi, B. J. Frey, Are random forests truly the best classifiers?, Journal of Machine Learning Research 17 (110) (2016) 1–5.
[57] A. Akyol, M. Hacibeyouglu, B. Karlik, Design of mul-tilevel hybrid classifier with variant feature sets for intrusion detection system, IEICE Transactions on In-formation and Systems E99.D (7) (2016) 1810–1821. doi:10.1587/transinf.2015EDP7357.
[58] Y. Lin, P. Lin, S. Wang, I. Chen, Y. Lai, Pcaplib: A system of extracting, classifying, and anonymizing real packet traces, IEEE Systems Journal 10 (2) (2016) 520–531.
[59] T. F. Cox, M. A. A. Cox, Multidimensional scaling, Chapman and Hall.
[60] P. Rousseeuw, Silhouettes: A graphical aid to the interpretation and validation of cluster analysis, J. Comput. Appl. Math. 20 (1) (1987) 53–65. doi:10.1016/0377-0427(87)90125-7.
Saeid Soheily-Khah graduated from the Shahid Beheshti University of Tehran in Computer Engineering in 2001. Then received Master degree in ”Artificial Intelligence & Robotics” from Azad University of Tehran - Iran in 2005. He received his second Master in Information Analysis and Management from Skarbek University in Warsaw, Poland in 2013. In May 2013, he joined to the Laboratoire d’Informatique de Grenoble at Universit´e Grenoble Alpes as a doctoral researcher. He successfully defended his dissertation and got his Ph.D in Oct 2016. In Nov 2016, he joined to the IRISA/Expression at Universit´e Bretagne Sud as a postdoctoral researcher. His research interests are machine learning, data mining, cyber security system, anomaly detection, data analysis and artificial intelligence.
Pierre-Francois Marteau received his master engineering degree in computer science from Ecole Nationale Sup´erieure d’Electronique et d’Informatique de Bordeaux in 1984, and his Ph.D. degree in computer science in 1988 from Institut National Polytechnique de Grenoble (Grenoble INP). He experienced a post doctorate position at University of Geneva in 1989, and at the Institute for Non Linear Sciences at University of Califor-nia San Diego in 1990. He then worked for eight years as an IT consultant in Bertin Technologies, a private company in Paris, before join-ing in 1999 the Computer Science Lab. at Universit´e Bretagne Sud where he his a professor. He joins the Institut de Recherche en Informatique et Syst`emes Al´eatoires (IRISA) in 2012. His current research interests include pattern recog-nition and machine learning with application in sequential (symbolic and digi-tal) data processing and anomaly detection.
Nicolas B´echet is an associate professor of computer sci-ence at the University of South Brittany, France, and a mem-ber of the Institut de Recherche en Informatique et Syst`emes Al´eatoires (IRISA), Rennes, France, since 2013. He received his Ph.D. in Computer Science from the University of Mont-pellier 2, France, in 2009 and his M.Sc. in Computer Science from the University of Tours, France, in 2006. He experienced post doctorate position at Institut National de Recherche en In-formatique et en Automatique (INRIA) in 2010, and at Groupe de Recherche en Informatique, Image, Automatique et Instrumentation de Caen (GREYC) at in 2011. His current research interests are data mining and natural language processing (NLP). His research focuses on combining data mining techniques and NLP. He has authored numerous research papers in the field of NLP and Knowledge extraction.