Role of Inflammation in the Pathogenesis of Insulin Resistance in
Obesity: Specific Role of Reactive Oxygen and Reactive Nitrogen Species
Thèse
Nahla Issa
Doctorat en Médecine Moléculaire
Philosophiae Doctor (Ph.D.)
Québec, Canada
iii
Résumé
L’inflammation chronique associée à l’obésité contribue à la pathogénèse de plusieurs troubles métaboliques dont la résistance à l’insuline. Cette inflammation est associée avec le développement du stress oxydant et est reconnue comme un facteur impliqué dans l’inhibition de la signalisation de l’insuline.
Ainsi, le but de ces études était d’évaluer le rôle du stress oxydant dans le développement de la résistance à l’insuline associée à l’inflammation. En particulier, nous avons cherché à évaluer le rôle de l’ion superoxyde et de radicaux lipidiques qui, associés à l’induction de la forme inductible de la NO synthase (iNOS), pourraient jouer un rôle clé dans la promotion de nitration de tyrosine des protéines impliquées dans la signalisation d’insuline, ainsi que dans la promotion des troubles métaboliques associés à l’obésité.
Dans la première étude, nous avons démontré que le traitement d’adipocytes avec des cytokines induit l’expression de l'isoforme NADPH oxidase 3 (NOX3) de la famille des NADPH oxydases (NOX) et parallèlement augmente la production de l'ion superoxyde. Ce traitement a aussi augmenté la lipolyse et la phosphorylation de la lipase hormono-sensible. Fait intéressant, l’inhibition de l’activité de NOX avec le Diphenyleneiodonium (DPI), a renversé l’effet des cytokines sur la lipolyse, la production de superoxyde et la phosphorylation de la lipase hormono-sensible. De plus, l’inhibition spécifique de l’expression de NOX3 via l'expression d'un siRNA a eu le même effet que le DPI. Cela indique que NOX3 est la source majeure de production de superoxyde induit par l’inflammation et ainsi régule négativement la lipolyse par l’augmentation de l’activité de la lipase hormono-sensible.
Dans la deuxième étude, nous avons identifié un rôle pour NOX3 et l'anion superoxyde dans le mécanisme de nitration de tyrosines sur Akt dans les cellules hépatiques FAO. Aussi, l’expression de NOX3 a augmenté dans les cellules hépatiques primaires traitées avec cytokines en même temps que l’augmentation de 3-nitrotyrosine, une empreinte reconnue de la formation de nitrotyrosine. Nous avons observé qu’une diète riche en lipides a pour effet d’augmenter la nitration sur tyrosine dans les foies de souris ainsi que dans les cellules hépatiques primaires isolées des foies de ces souris. De plus, cette diète a augmenté la nitration de tyrosines sur Akt dans le foie de souris obèses. Finalement, nous avons identifié deux résidus, tyrosine 152 et tyrosine 38, qui sont nitratés sur Akt1, et qui pourraient réguler négativement l’activité d’Akt lorsque nitratés.
Dans la troisième étude, nous avons démontré que le captage des radicaux lipides avec le "spin trap" α -(4-Pyridyl-1-oxide)-N-tert-butylnitrone (POBN) dans les souris nourries avec une diète riche en lipides a diminué la masse adipeuse comparativement avec les souris obèse non traitées. Cet effet a été associé à une amélioration de la tolérance au glucose et de la sensibilité à l’insuline, ainsi que d'une diminution de l’inflammation dans la tissu adipeux. En plus, on a remarqué une amélioration de la fonction mitochondriale dans le muscle et le tissu adipeux. Dans le foie, la traitement avec POBN a empêché l’accumulation des lipides et a amélioré le métabolisme de glucose.
L'ensemble de nos études démontre le rôle de l'anion superoxyde généré par NOX3 dans le mécanisme de nitration de tyrosine dans le foie et la modification de la fonction métabolique dans les adipocytes. Aussi, nous avons identifié deux tyrosines nitratées sur Akt1 qui pourraient être impliquées dans la régulation de son activité. Enfin, nous avons montré que POBN semble d’avoir un effet préventif sur l’obésité qui est associé avec l’amélioration des plusieurs paramètres métaboliques.
v
Abstract
Chronic low-grade inflammation is considered one of the triggers of obesity-associated insulin resistance. Metabolic inflammation goes along with increased oxidative and nitrosative stress, but whether this promotes insulin resistance in obesity remains ill-defined.
Thus, the primary objective of this thesis was to study the role of oxidative and nitrosative stress in the development of inflammation mediated insulin resistance and in particular to highlight the role of superoxide anion production, lipid radical generation, and iNOS induction, in mediating tyrosine nitration of insulin signaling proteins and other metabolic dysfunctions associated with obesity.
In chapter I, we showed for the first time that treatment of adipocytes with cytokines induced NADPH oxidase-3 (NOX3) expression along with increasing superoxide production. Cytokine treatment also increased lipolysis as indicated by measuring free glycerol release and caused increase in the phosphorylation of hormone sensitive lipase. Interestingly, pharmacological inhibition of NOX activity by Diphenyleneiodonium (DPI) reversed the effect of cytokines on lipolysis and on the phosphorylation of HSL in line with decreasing superoxide production. Specific knockdown of NOX3 gene expression in adipocytes displayed the same effects as those exerted by DPI. These results indicate that NOX3 is the major NOX involved in superoxide production in 3T3L1 adipocytes and a regulator of lipolysis in inflammatory settings.
In chapter II, we identified a new role of NOX3 and superoxide production in mediating tyrosine nitration on Akt in FAO hepatic cells. NOX3 expression was increased in primary hepatocytes after cytokine treatment together with an increase in 3-nitrotyrosine.
Interestingly, primary hepatocytes isolated from high fat (HF) fed mice displayed more tyrosine nitration when compared to primary hepatocytes isolated from mice on chow diet. Also, we showed for the first time a tendency for high fat feeding to increase tyrosine nitration specifically on Akt. More importantly, two novel tyrosine nitrated sites on Akt1 were identified: tyrosine 152 and tyrosine 38, which seem to play a role in negatively regulating Akt activity when tyrosine nitrated.
In chapter III, scavenging lipid radicals by α -(4-Pyridyl-1-oxide)-N-tert-butylnitrone (POBN) reversed the metabolic disorders caused by HF feeding in mice. POBN treated mice exhibited decrease in fat mass when compared to their HF counterparts. This effect was associated with enhanced glucose tolerance and insulin sensitivity. Also, adipose tissue inflammation was alleviated and mitochondrial function was ameliorated, insulin signaling in skeletal muscle was restored and mitochondrial oxidative metabolism was also enhanced. In the liver, POBN treatment prevented fat accumulation and enhanced lipid and glucose metabolism.
Together these results highlight the important role of NOX3 generated superoxide in mediating tyrosine nitration in liver and in altering metabolic dysfunction in adipocytes. Also, two important tyrosine nitrated sites on Akt were identified that may possibly be involved in regulating its activity. Finally, the lipid radical scavenger, POBN, displayed anti-obesity effects in HF fed mice and this effect was associated with amelioration of several metabolic parameters.
v
Table of Contents
Résumé ... iii Abstract... v List of Figures... ix Abbreviations ... xi Acknowledgments ...xvii Forward ... xix Introduction ... 11. Obesity and its Implications ... 1
2. Glucose homeostasis ... 1
3. Insulin Resistance: Definition ... 3
4. Insulin Signaling Network ... 3
4.1 Insulin receptor ... 4
4.2 Insulin receptor substrates ... 4
4.3 Phosphatidyl Inositol 3 kinase (PI 3K) ... 5
4.4 Protein Kinase B (PKB/Akt) ... 6
4.5 Negative Regulation of Insulin Signaling ... 6
5. Insulin Action in Metabolic Tissues ... 7
5.1 Skeletal Muscle ... 7
5.2 Liver ... 9
5.3 Adipose Tissue ... 10
6. Development of Insulin Resistance in Obesity ... 11
6.1 Free Fatty Acids (FFA) ... 11
6.2 Adipokines ... 12
6.3 Inflammation-mediated insulin resistance ... 14
7. Mechanisms linking inflammation to insulin resistance ... 17
7.1 Lipid mediators ... 17
7.2 MAP kinases... 18
7.4 Janus Activated Kinase ... 20
7.5 The NFκB pathway ... 20
7.6 Suppressors of cytokine signaling (SOCS) ... 21
8. Oxidative stress/Nitrosative stress in Insulin Resistance State ... 21
8.1 Reactive Oxygen and Reactive Nitrogen Species ... 22
8.2 Stimuli for ROS/RNS generation ... 22
8.3 Sources of ROS/RNS ... 23
9. Mechanisms for Impaired Insulin Action Induced by ROS/RNS ... 33
9.1 S-Nitrosylation and Tyrosine Nitration ... 33
9.2 Lipid Peroxidation ... 36 10. Objectives ... 38 Chapter I ... 39 Résumé ... 40 Abstract ... 41 Introduction... 42 Methods ... 43 Results ... 46 Discussion ... 49 Acknowledgments ... 52 References ... 53 Figure Legends ... 57 Chapter II ... 67 Résumé ... 68 Abstract ... 70 Introduction... 71 Methods ... 72 Results ... 77 Discussion ... 80 Acknowledgments ... 85 Figure Legends ... 89 Chapter III ... 99
vii Résumé ... 100 Abstract ... 101 Introduction ... 102 Methods ... 103 Results ... 105 Discussion ... 108 References ... 111 Figure Legends ... 117 Conclusion ... 125 Bibliography ... 135
ix
List of Figures
Introduction
Figure 1. Activation of insulin receptor ... 4
Figure 2. Insulin signaling through PI(3)K ... 7
Figure 3. Insulin action in adipocytes ... 10
Figure 4. Stages of macrophage infiltration in the adipose tissue in obesity ... 16
Figure 5. Activation of NADPH oxidase isoforms. Despite their similar structure and enzymatic function, NOX family enzymes differ in their mechanism of activation. .... 24
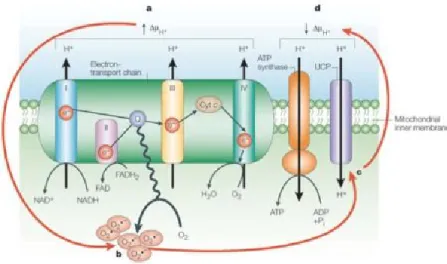
Figure 6. Superoxide activation of UCP: a feedback loop ... 27
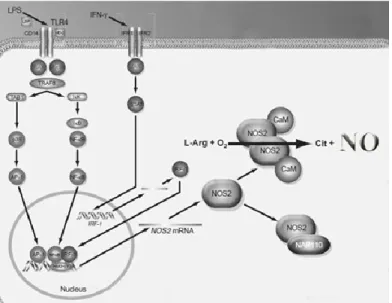
Figure 7. Induction of iNOS by cytokines and lipopolysaccharide (LPS) ... 32
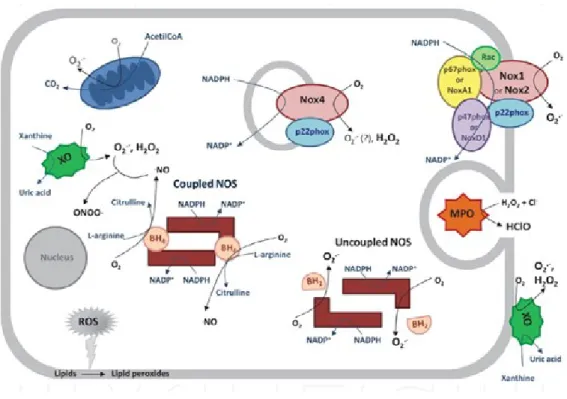
Figure 8. Major sources of ROS and RNS... 33
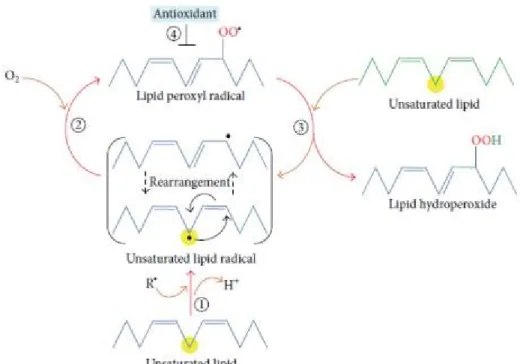
Figure 9. Chain reactions generated during lipid peroxidation (1-4) ... 37
Chapter I Figure 1. Effect of different ROS inhibitors on cytokine induced superoxide production in 3T3 L1 adipocytes………...61
Figure 2. NOX3 and NOX4 protein expression in 3T3 L1 cells treated with cytokines………...62
Figure 3. Effect of DPI on lipolysis, PPAR activity and glucose uptake in cytokine treated adipocytes………63
Figure 4. NOX3 knockdown by siRNA and its effect on superoxide production .64 Figure 5. Effect of NOX3 knockdown on lipolysis and phosphorylation of HSL on serine 563 in cytokines treated adipocytes…………...………65
ChapterII Figure 1. Effect of DPI and 1400W on superoxide production in FAO cells treated with cytokines………...………..93
Figure 2. iNOS and NOX3 expression in FAO cells treated with cytokines and tyrosine nitration of Akt……….94
Figure 3. Superoxide production, NOX3 and iNOS expression and tyrosine
nitration in primary hepatocytes and liver tissue………95 Figure 4. Detection of two tyrosine nitration sites on Akt1: Tyrosine
152 and tyrosine 38………..96 Figure 5. Effect of mutating Y152 and Y38 on Akt phosphorylation and
translocation………97 Chapter III
Figure 1. Body weight and body weight composition……….119
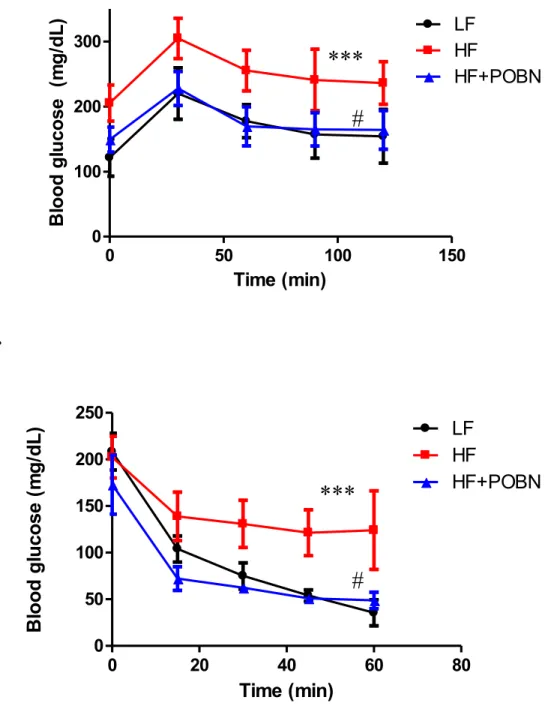
Figure 2. Impact of POBN treatment on glucose homeostasis………..120 Figure 3. Effect of POBN on insulin signaling and oxidative phosphorylation
in skeletal muscle……… ………...121 Figure 4. Effect of POBN on glucose and lipid metabolism in the liver………...122 Figure 5. Effect of POBN on adipose tissue metabolism and inflammation……123
xi
Abbreviations
AMPK Adenosine Monophosphate Protein Kinase AGE Advanced Glycation End Products
AgRP Agouti Related Peptide aPKC Atypical Protein Kinase C
APS Adaptor Protein containing PH and SH-2
ARC Arcuate Nucleus
ATF Activating Transcription Factor ATP Adenosine Triphosphate
BH4 Tetra Hydrobiopterin
BMI Body Mass Index
cAMP Cyclic Adenosine Monophosphate CBP CREBP binding protein
CCL C-C Motif Ligand
CREB cAMP Response Element Binding
DAG Diacylglycerol
DUOX Dual Oxidase
DMPO 5,5-Dimethyl-1-Pyrroline-N-Oxide
DPI Diphenyleneiodonium
eNOS Endothelium Nitric Oxide Synthase ERK Extracellular Signal Activated Kinase ERO Endoplasmic Reticulum Oxireductin ERS Endoplasmic Reticulum Stress FAD Flavin Adenine Dinucleotide FADH Flavin Adenine Dinucleotide FBase Fructose 1-6-Biphosphatase
FFA Free Fatty Acids
FMN Flavin Mononucleotide
FOXO1 Forkhead BOX class-O winged helix transcription factor 1 Gab1 Grb2-Associated Binding Protein 1
Glc-6-P Glucose 6 Phosphate GLUT Glucose Transporters GSK3 Glycogen Synthase Kinase GST Glutathione S-Transferase
HF High Fat
HNE Hydroxynonenal
HOCL Hypochlorous Acid
HSL Hormone Sensitive Lipase
IFN Interferon
IL Interleukin
iNOS Inducible Nitric Oxide Synthase
IR Insulin Receptor
IRE Inositol Requiring Enzyme IRS Insulin Receptor Substrate
JAK Janus kinase
JNK c-Jun N terminus kinase LPL Lipoprotein Lipase LPS Lipopolysaccharide
MAPK Mitogen Activated Protein Kinase MCP Monocyte Chemotactic Protein
MDA Melondialdehyde
MIP Macrophage Inflammatory Protein
MPO Myeloperoxidase
mTOR Mammalian Target of Rapamycin
mTORC2 Mammalian Target of Rapamycin Complex 2 NBT Nitroblue Tetrazolium
NADPH Nicotine Adenine Diphosphonucleotide NF κB Nuclear Factor Kappa B
nNOS Neural Nitric Oxide Synthase
NOX NADPH Oxidase
NOXO NADPH Oxidase Organizer
NPY Nuero peptide 1
NT 3-Nitrotyrosine
PDE3B Phosphodiesterase-3B PDI Protein Disulfide Isomerase
PDK1 Phosphoinositide-Dependant Kinase-1 PEPCK Phosphoenolpyruvate Carboxykinase PERK PRK like ER Regulating Kinase
PKA Protein Kinase A
PKB Protein Kinase B
PKC Protein Kinase C
PI3K Phosphatidyl Inositol 3 Kinase
PIP3 Phosphatidylinositol 3,4,5 Triphosphate
PGC1 Peroxisome Proliferator-Activated Receptor-γ Co-activator-1 POBN α-(4-Pyridyl-1-oxide)-N-tert-Butylnitrone
POMC Pro-opiomelanocortin
PPARγ Peroxisome Proliferator Activated Receptor Gamma PTN Protein Tyrosine Nitration
PTP Protein Tyrosine Phosphatases PTEN Phosphatase and Tensin Homologue PUFA Polyunsaturated Fatty Acids
RAGE Receptors of AGE
ROS Reactive Oxygen Species RNS Reactive Nitrogen Species
SHIP2 SH2-containing Inositol 5’-Phosphatase-2 SIK2 Salt Induced Kinase 2
SIRP Signal Regulatory Protein
SOCS Suppressors of Cytokines Signaling SOD Superoxide Dismutase
xiii TORC2 Transducer of Regulated CREB Activity-2
TXR Thieredoxin
TZD Thiazolidinedione
UCP Uncoupling Protein
UPR Unfolded Protein Response
XO Xanthine Oxidase
xv To my parents and loving husband
xvii
Acknowledgments
First, I would like to thank my thesis supervisor Dr. André Marette for giving me the opportunity to be part of his research team. I will always value the opportunities I have been given to grow as a scientist including attending international conferences and participating in continuous scientific discussions.
Second, I would like to thank my lab supervisor Kerstin Bellmann who helped me throughout my PhD program and who was always ready to answer any question I had at any time.
I also thank Dr. Krisztian Stadler for highly contributing to the work presented in this thesis and for his continuous positive input.
I would like to thank Bruno Marcotte who continuously assists the lab members and ensures that things are running smoothly in the lab.
I also thank Dr. Charles Lavigne for his support and care throughout my PhD program.
I also acknowledge the CIHR for providing the finances that made these studies possible.
To the members of the Jury, thank you all for taking the time to read and evaluate my work. Your feedback and insight is very much appreciated.
I would like to thank my friend and colleague Carolina Centeno-Baez for her continuous encouragement and moral support. Her sincere friendship and care helped me out throughout this journey.
To my loving parents who have always encouraged me to pursue my studies and who gave me the strength and patience to continue my path, thank you for your endless and unconditional love and support.
Last but not least, I would like to thank my loving husband for his endless support and caring and for giving me the strength when I needed it the most, I couldn’t have done this without him.
xix
Forward
The work presented in Chapter I is ready for submission to a scientific journal. I was involved with Drs. Bellmann and Marette in the planning of the study. I was responsible for conducting all the experiments and generating the figures presented in this work. I was responsible for writing the first draft of the manuscript. Drs Bellmann and Marette revised the manuscript.
Chapter II contains a manuscript in preparation. I was involved with Drs. Bellmann and Marette in the planning of the study. I was responsible for conducting most of the experiments and was responsible for writing the manuscript. The mass spectrometry analysis was conducted by Ming Zhang. The site directed mutagenesis was performed by Rémy Cabana with the help of Michael Schwab. Kerstin Bellmann helped with the immuno-fluorescent experiments. I was responsible for writing the first draft of the manuscript. Drs Bellmann and Marette revised the manuscript.
Chapter III also comprises a manuscript in preparation. This study was conducted in collaboration with Dr. Krisztian Stadler, assistant professor at Pennington Biomedical Research Center in Baton Rouge, Louisiana. Dr. Stadler and I were responsible for conducting the animal protocols and generating most of the figures presented in this work. Claudia Kuger conducted the gene expression analysis of the different genes presented in this work. I was responsible for writing the first draft of the manuscript. Drs Bellmann and Marette revised the manuscript
1
Introduction
1. Obesity and its Implications
Obesity is now considered a pandemic disease due to its high prevalence and its association with a number of life threatening diseases. A large number of adults are considered obese and this number is expected to increase to more than 700 million in 2015 (1). Obesity has become a threat for the public health since individuals with a high body mass index (BMI>35) have a significant reduction in life span (2). The increase in mortality rate linked to it is due to its associated co-morbidities, including type 2 diabetes, cardiovascular disease, hypertension, and dyslipidemia (3).
The co-existence of several metabolic abnormalities associated with obesity is together referred to as the metabolic syndrome. These metabolic disorders include glucose intolerance (type 2 diabetes, impaired glucose tolerance, or impaired fasting glycaemia), insulin resistance, central obesity, dyslipidemia, and hypertension (4). Substantial evidence now indicates that the metabolic syndrome is an outgrowth of obesity associated insulin resistance which is a major risk factor for the development of chronic diseases especially type 2 diabetes (5, 6). In fact, several epidemiological studies have reported obesity as the major risk factor for the development of type 2 diabetes and that it plays a direct role in the pathogenesis of diabetes (7-10). Thus, understanding the mechanisms underlying insulin resistance is necessary to prevent the development of obesity-associated disorders.
2. Glucose homeostasis
D-glucose is the major primary source of energy for the brain and the red blood cells, and it is a crucial fuel for other cell types such as cardiac muscle and skeletal muscle (11, 12). Blood glucose levels are tightly regulated at all time by a complex system involving
hormonal regulation of different body organs and tissues. Glucose concentration in the blood is determined by the rate of its appearance in the circulation and the rate of its clearance from the circulation. During the fed state, the rate of glucose appearance depends on gastric emptying in contrast to the fasting state where its presence in the blood depends on glycogenolysis, breakdown of glycogen to glucose, and gluconeogenesis which is the formation of glucose from lactate and amino acids in the liver. These processes are regulated by glucagon, a hormone produced by the α-cells of the pancreas (13). Glucagon is the major glucoregulatory hormone responsible for glucose appearance in the blood upon stimulating hepatic glucose production. On the other hand, insulin, secreted by the β-cells of the pancreas, is responsible for glucose clearance from the blood. For example, in the postprandial state, when glucose concentrations exceed the normal range, insulin is responsible for bringing it back to normal (14, 15). It does so by increasing glucose uptake in the adipose tissue and skeletal muscle and suppressing glucose production in the liver (13). Insulin also inhibits free fatty acid (FFA) release from adipose tissue by inhibiting lipolysis, the breakdown of triglycerides into FFA. It is important to mention that the levels of FFA in the circulation can also play a role in regulating glucose metabolism. Randle et al. (16) proposed that when FFA levels are high, skeletal muscle preferentially utilize FFA over glucose, thus increasing fatty acid uptake and metabolism. As a result, glucose oxidation is decreased leading to inhibition of glycolysis and this is independent of hormonal control. Thus an increase in FFA concentrations stimulates fatty acid oxidation while inhibiting carbohydrate oxidation (17).
Glucose transport into various tissues is mediated by either Na+ dependent glucose transporters present in the small intestine and is not regulated by insulin, or by facilitative glucose transporters accomplished by five known glucose transporters (GLUT1-5) (18-20). GLUT1 and GLUT3 are present in the brain, GLUT1 is also present in red blood cells and both transporters are independent of insulin stimulation. GLUT2 is strictly present in the liver, kidney, intestine and β-cells of the pancreas. GLUT2 is responsible for the release of glucose into circulation except in the pancreas (18-20). GLUT 5 is primarily expressed in the small intestine (19). Finally, GLUT4 is the only glucose transporter, which is regulated by insulin and is expressed in skeletal muscle, cardiac muscle, and adipose tissue (21). In
3 the absence of insulin, GLUT4 is present in intracellular vesicular pool. Insulin causes rapid translocation of GLUT4 to the plasma membrane increasing the rate of glucose uptake by 5-20 folds (22). Upon its entry glucose is converted to glucose-6-phosphate (Glc-6-P) to prevent its diffusion outside the cell. Glc-6-P can be utilized for glycogen synthesis or for glycolysis (23). In addition to maintaining glucose homeostasis, insulin promotes other cellular events such as cell growth and differentiation and the transcription of genes important in lipid metabolism (24).
The following sections will be dedicated to understanding the mechanisms of insulin action and the causes that underlie the development of insulin resistance in obesity.
3. Insulin Resistance: Definition
Insulin acts on various tissues including, brain, liver, adipose tissue, skeletal muscle and the vasculature (15, 25). Insulin resistance is a disorder characterized by the inability of the body to respond properly to insulin action. In an insulin resistant state muscle, fat and liver cells do not respond to insulin action (26, 27) and this is possibly due to defects at different levels of the insulin signaling pathway such as insulin receptor kinase activity, concentration and phosphorylation of IRS-1 and 2, PI3 kinase activity, glucose transporter translocation, and the activity of intracellular enzymes (28). This signaling pathway will be discussed more in detail in the following section with highlighting the findings that relate alterations in this pathway to obesity-associated insulin resistance.
4. Insulin Signaling Network
The insulin signaling pathway is a very complex pathway that implicates the activation of several enzymatic pathways that mediate different actions of this hormone. In this section the pathway which is mainly involved in lipid and glucose metabolism will be discussed.
4.1 Insulin receptor
The insulin signaling pathway starts at the insulin receptor (IR) located on the plasma membrane. IR belongs to a subfamily of receptor tyrosine kinases constituting two α subunits that serves to bind insulin and two β subunits that possess the kinase activity. The binding of insulin to the α-subunit induces the transphosphorylation of one β subunit by another on specific tyrosine residues in an activation loop fashion eventually increasing its kinase activity (29). (Figure 1). Mutations in the insulin receptor inhibiting its kinase activity are reported to be associated with severe insulin resistance (31, 32).
Figure 1. Activation of insulin receptor. Insulin binds to the α subunit of the insulin receptor inducing it’s autophosphorylation (Modified from reference 30).
4.2 Insulin receptor substrates
The tyrosine kinase activity of the insulin receptor mediates insulin signaling through the tyrosine phosphorylation of several cellular substrates, especially the insulin receptor substrates (IRS) (33). Six insulin receptor substrates are identified (IRS1-4), IRS5/DOK4, IRS6/DOK5 (34, 35). Other intracellular substrates include GRB-2 associated binding protein 1 (Gab-1), cannabinoid receptor type 1 (Cbl), APS and SHC-transforming protein 1 (Shc) isoforms, and signal regulatory protein (SIRP) family members (34, 35). IRS-1 and IRS-2 are mostly implicated in liver, muscle, and adipose tissue insulin signaling (36). IRS
5 proteins have multiple tyrosine phosphorylation sites. In the insulin stimulated state, IRS is tyrosine phosphorylated and acts as a docking site for other proteins containing the src homology 2 (SH2) domain such as the p85 regulatory subunit of PI3K and Grb2 or CrKII which activates small G proteins (Figure 2) (24). In the basal state, IRS1 is phosphorylated on its serine sites and to a lesser extent on its threonine residues. Increase in serine phosphorylation of IRS1 is known to inhibit its tyrosine phosphorylation and therefore repress insulin signaling (37, 38).
Knockout studies have revealed that IRS proteins can complement each other rather than play similar roles regardless of their strong homology. IRS1-/- mice exhibited insulin
resistance in peripheral tissues and growth retardation but did not develop type 2 diabetes (39). IRS2-/- mice are insulin resistant in both peripheral tissues and liver, in addition to
developing type 2 diabetes and β cell failure (40). On the other hand, IRS-3 and IRS-4 knockout mice exhibited normal growth and metabolism (41).
4.3 Phosphatidyl Inositol 3 kinase (PI 3K)
Insulin signaling through the PI3 kinase pathway stimulates glucose uptake (35). The PI3 kinase protein has a p85 regulatory subunit and p110 catalytic subunit. Tyrosine phosphorylated IRS interacts with the p85 subunit leading to PI3 kinase activation and recruitment to the plasma membrane where it phosphorylates phosphoinositides on the 3-position generating phosphatidylinositol 3,4,5 trisphosphate (PIP3) (42, 43) which in turn regulates different signaling molecules (Figure 2) (43). One well characterized serine kinase regulated by PIP3 is phosphoinositide dependent kinase (PDK1) which phosphorylates and activates the serine/threonine kinase AKT/PKB (44).
4.4 Protein Kinase B (PKB/Akt)
AKT is a serine/threonine kinase that mediates signaling through PI3 kinase. It constitutes three isoforms (AKT1-3) (45). AKT is recruited to the plasma membrane after its interaction with PIP3 thorough its PH domain. Catalytic activation of AKT implicates its phosphorylation on the serine residue 473 and threonine residue 308. Also, it has been shown that even tyrosine phosphorylation of AKT is necessary for its full activation (46). AKT transmits the insulin signal by promoting GLUT 4 translocation to the membrane, phosphorylating downstream enzymes such as glycogen synthase kinase (GSK3), fork head transcription factor, and cAMP response element binding proteins (47, 48). Knockout studies have revealed more insights into the function of the different AKT isoform. AKT2
-/-mice exhibited insulin resistance in muscle and liver. Also, cells derived from these -/-mice showed impaired glucose uptake (49, 50). This indicates a central role for AKT2 in glucose homeostasis. However, full understanding of the distinct roles of the different isoforms in different tissues and under different conditions is not achieved yet.
4.5 Negative Regulation of Insulin Signaling
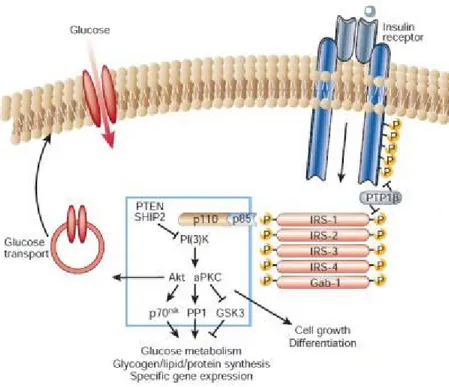
The insulin signaling pathway is tightly regulated, whereby unrestricted activation leads to severe metabolic disorders. Protein tyrosine phosphatases (PTPs) are known to negatively regulate tyrosine phosphorylation such as on the insulin receptor (51). PTP1B, one of the most well studied phosphatases, can interact with the insulin receptor by dephosphorylating important tyrosine residues and therefore reducing its activity (Figure 2). Inhibition of insulin signaling can occur at the level of PI3K by phospholipid phosphatases and tensin homologue (PTEN) and SH2-containing inositol 5′-phosphatase-2 (SHIP2) which dephosphorylate PIP3 causing its inactivation (Figure 2). PTEN deletion in vivo improves insulin sensitivity (52) where as SHIP2 knockout protects mice against obesity-induced insulin resistance (53).
7 Figure 2. Insulin signaling through PI(3)K.The insulin receptor is a tyrosine kinase that undergoes autophosphorylation, and catalyses the phosphorylation of cellular proteins such as members of the IRS family, Shc and Cbl. Upon tyrosine phosphorylation, these proteins interact with signalling molecules through their SH2 domains, resulting in a diverse series of signalling pathways, including activation of PI(3)K and downstream PtdIns(3,4,5)P3-dependent protein kinases (modified from reference 24).
5. Insulin Action in Metabolic Tissues
It is fundamental to review insulin action in major insulin target metabolic tissues (skeletal muscle, liver, and adipose tissue) in order to understand the mechanisms underlying the development of insulin resistance in obesity.
5.1 Skeletal Muscle
The skeletal muscle is responsible for approximately 80% of insulin stimulated glucose uptake (54). When glucose levels increase in the blood > 7mM, insulin is secreted by the beta cells of the pancreas (24, 55). It binds to the alpha subunit of its receptor located on the skeletal muscle sarcolemma. As described previously, the binding of insulin to its receptor
causes trans-autophosphorylation of its tyrosine sites that provides docking sites for various intracellular SH-2-domain containing proteins. These include IRS1/2/3/4 proteins, as well as GAB-1, She, APS, p60, SIRPs, and c-CBL (55, 56). Signaling downstream of the insulin receptor substrates is responsible for mediating insulin action as glucose uptake, glycogen synthesis, protein synthesis, and transcriptional regulation of target genes.
The role of insulin receptor substrates varies from one insulin target tissue to another. Genetic deletion of IRS-1 in mice was found to be associated with impaired insulin action in skeletal muscle but not liver where expression of IRS-2 was found to be more abundant (57). Moreover, combined heterozygous mutation of the insulin receptor with IRS-1 led to severe skeletal muscle insulin resistance and mild hepatic insulin resistance whereas combined heterozygous mutation of the insulin receptor with IRS-2 resulted in mild skeletal muscle insulin resistance alongside with severe impairment of hepatic insulin signaling (58). These data suggest that IRS-1 plays a major role in peripheral insulin target tissues whereas the role of IRS-2 appears to be more important in liver.
Phosphorylation of IRS1 on tyrosine residues leads to the binding of the SH-2 domain containing p85 subunit of PI3-K. This in turn leads to the phosphorylation of AKT and stimulation of its catalytic activity. Membrane bound PDK1/2 also activates atypical protein C (aPKC) and p70S6-kinase (59, 60). Activated AKT and aPKC then stimulate GLUT-4 glucose transporter translocation from intracellular vesicles to the sarcolemma facilitating glucose entry into the cell (61). AKT also stimulates glycogen synthesis by inhibiting GSK-3 activity and activates the mammalian target of rapamycin (mTOR) which exerts feedback inhibition of insulin signaling (62).
9 5.2 Liver
The liver plays a major role in lipid and glucose metabolism. It is responsible for maintaining normal glucose levels in the blood where it stores excess glucose as glycogen (glycogenesis) after a meal, in contrast to the fasting state where it breaks down stored glycogen into glucose (glycogenolysis), in addition to its ability to produce glucose from endogenous sources through a process known as gluconeogenesis (63). Glucose output and storage are tightly regulated by the two glucoregulatory hormones, insulin and glucagon.
After meal consumption, glucose levels in the blood increase. Insulin secreted by the beta cells in the pancreas stimulates glucose storage as lipid and glycogen while inhibiting glucose synthesis and release. This is accomplished by a series of signaling cascades and regulation of several enzyme synthesis and activity. Insulin binds to its insulin receptor on the surface of hepatocytes and stimulates a similar signaling cascade as in skeletal muscle. Insulin induces the nuclear extrusion of the CREB co-factor CBP via a phosphorylation dependent mechanism (64). Moreover, insulin signaling through IRS/AKT in liver also induces the nuclear extrusion of the transcription factor FOXO1 and thereby inhibits the actions of FOXO1 and its transcriptional co-activator PGC1 that induce the expression of gluconeogenic and glycogenolytic enzymes as glucose-6-phosphatase (G6Pase), phosphoenolpyruvate carboxykinase (PEPCK), and fructose-1-6-biphosphatase (FBP 1,6-ase) (65, 66). This insulin cascade in the liver leads to the inhibition of gluconeogenesis, glucose production and stimulation of glycogen and lipid synthesis.
In case of insulin resistance, in the fed state, insulin can no more stimulate glycogen synthesis, most glucose is stored as triglyceride increasing lipid accumulation, there is an increase in de novo lipogenesis which contributes to increased circulating fat, and absence of insulin control leads to increased gluconeogenesis and uncontrolled hepatic glucose production (67).
5.3 Adipose Tissue
The primary role that was attributed to the white adipose tissue is storage of excess energy as triglycerides and the release of fatty acids when fuel is required. However, it has been shown that the white adipose tissue is also an endocrine organ secreting signaling molecules termed adipokines. These help in regulating energy homeostasis not only by affecting the adipose tissue itself but by exerting a similar effect on other metabolic tissues such as liver, muscle, and brain (68-71). In the state of elevated energy demands such as exercise or starvation, hormonal (eg. catecholamines, glucagon) and neural signals (eg. sympathetic nervous system) work together to enhance lipolysis, the breakdown of triglycerides into fatty acids and glycerol, via cAMP/PKA dependent mechanisms leading to the activation of hormone sensitive lipase (HSL) (72, 73). In contrast, in case of energy excess insulin acts on adipose tissue to promote carbohydrate and lipid storage by inducing GLUT4 mediated glucose uptake and increase lipoprotein lipase (LPL) which hydrolyzes triglycerides in lipoproteins such as very low density lipoprotein (VLDL) to fatty acids and mono-acyl-glycerides and promote cellular fatty acid uptake (74).
Figure 3. Insulin action in adipocytes. In small adipocytes (lean condition), insulin promotes free fatty acid (FFA) esterification into triglycerides through stimulation of glucose transporter type-4 (GLUT4)-mediated glucose uptake. Glucose can be converted toα-glycerol phosphate, the main source of the glycerol backbone of TG. Peroxisome proliferator-activated receptor-λ (PPARλ) activates lipoprotein lipase (LPL) expression and the TG biosynthetic pathway. Secreted LPL hydrolyses TG from circulating very low density lipoprotein (VLDL), releasing FFAs to be re-esterified.(Reference 75)
11 Insulin also promotes the phosphorylation of phosphodiesterase-3B (PDE-3B), which inhibits cAMP/PKA dependant activation of HSL and thus prevents free fatty acid efflux from adipose tissue (Figure 3 modified from reference (75)). This consequently results in increased free fatty acid uptake from the plasma (76, 77). Moreover, insulin increases the expression of peroxisome proliferator activated receptor gamma (PPAR), which regulates adipogenesis, adipocyte differentiation, fatty acid storage and the expression of several adipokines (78-80).
6. Development of Insulin Resistance in Obesity
Several factors are proposed to link obesity and insulin resistance of which I will discuss free fatty acids (FFA), adipokines and inflammatory mediators (27, 81) while focusing on inflammation associated insulin resistance.
6.1 Free Fatty Acids (FFA)
Free fatty acids are transported in the plasma bound to plasma albumin. They are the means by which triglycerides stored in adipose tissue reach its utilization sites mainly in liver and muscle (82-84). Obesity is associated with the expansion of adipose tissue and the increase in visceral depot leading eventually to adipocyte hypertrophy and death (85). As a result, lipolysis is no more susceptible to insulin action; fat break down and free fatty acid release in the plasma are increased leading eventually to insulin resistance in skeletal muscle and liver (86-89). FFAs released from visceral adipose tissue normally serve as primary oxidative fuel for muscle and liver. When energy is needed, adipose tissue lipolysis is stimulated thus increasing FFA availability and preserving glucose as fuel for the brain (90).
In the obese state FFA supply and glucose concentrations are high and thus there is a competition between these two energy sources for oxidative metabolism in metabolic
tissues (16). In skeletal muscle, the decrease in glucose uptake and the high availability of FFAs lead to an increase in fat oxidation and consequently generation of intermediate metabolites such as acyl-CoAs, ceramides and diacylglycerols (91). These can serve as signaling molecules activating protein kinases such as protein kinase C (PKC), c Jun N-terminal kinase (JNK), and the inhibitor of nuclear factor-B (NF-B) kinase-β (IKK-β). These pathways have shown to inhibit insulin signaling by increasing the phosphorylation of insulin receptor substrates (IRS) on serine residues (37, 91). In the liver, FFA flux from the visceral adipose depot through the portal vein increases gluconeogenesis and eventually contributes to increase in hepatic glucose production and decrease in insulin clearance (92-94). FFA flux between the visceral adipose depot, skeletal muscle, and liver is a major factor contributing to the development of systemic insulin resistance in the obese state.
6.2 Adipokines
In addition to regulating fat mass, the adipose tissue is an active endocrine organ secreting a number of bioactive mediators known as adipokines that signal to the brain, liver, skeletal muscle, and the immune system thereby modulating homeostasis, inflammation, blood pressure as well as lipid and glucose metabolism (68, 95). These adipose tissue derived hormones include adiponectin, chemerin, leptin, omentin, resistin, retinol binding protein 4, TNF-α, interleukin-6, vaspin, and visfatin (96), of which I will discuss: adiponectin, leptin, IL6, and TNF- α.
Adiponectin is the most abundant protein secreted by adipose tissue and circulating in the plasma at high concentrations (2-10 μg/ml). Adiponectin levels are reduced in animal models of obesity and insulin resistance (97-99). It has been shown that this protein modulates lipid and glucose metabolism in metabolic tissues whereby it increases glucose uptake and fat oxidation in muscle and reduces hepatic glucose production in liver by upregulating the AMP-activated protein kinase pathway (AMPK) (97, 100-102). In addition to affecting whole body insulin sensitivity, adiponectin promotes pancreatic insulin
13 secretion (103) and regulates food intake and energy expenditure through its effects on the central nervous system (104).
Another adipose derived hormone which plays a critical role in regulating feeding behaviour as well as energy storage and expenditure is leptin (105). This peptide hormone is the product of the ob gene in fat cells that promotes anorexic effects on energy balance mediated by the central nervous system. It has been established that a decrease in leptin signaling leads to hyperphagia (excessive feeding) and obesity whereby this effect was reversed upon administration of leptin to leptin deficient mice (ob/ob mice) (106, 107). Leptin mediates its action by binding to its receptors in the arcuate nucleus (ARC) signalling via Janus kinase (JAK)-signal transducers and activators of transcription (STAT) and IRS/phosphoinositide-3 kinase (PI3K) repressing orexigenic pathways involving neuropeptide Y (NPY) and agouti-related peptide (AgRP) and inducing anorexigenic pathways such as those involving pro-opiomelanocortin (POMC) (108).
Another important role of Leptin is its action on the immune system. Leptin acts as a pro-inflammatory cytokine promoting the secretion of acute phase reactants such as interleukin-1 and TNF-(interleukin-109)It also promotes the differentiation of helper T cells into pro-inflammatory helper T cells (TH1) triggering an immune response when needed (110).
Tumor necrosis factor- (TNF-is another widely studied pro-inflammatory cytokine secreted by the adipose tissue reported to be a contributor to the development of insulin resistance. It has been shown that deletion of TNF-r its receptor improves insulin sensitivity in a mouse model of obesity (111, 112). A link between TNF-and insulin resistance was first established when obese mice lacking TNF-exhibited protection from insulin resistance (113, 114). It has been reported that TNF-promotes lipolysis and fatty acid release by inhibiting insulin action through increasing serine phosphorylation on IRS1 (115) and decreasing fatty acid uptake by inhibiting LPL (116). It also contributes to inhibition of adipogenesis by down regulating peroxisome proliferator activated receptor (PPARγ) (79) and reducing lipogenesis from glucose (114). This leads to dysfunctional
lipid storage and release contributing to high circulating levels of FFAs in the plasma, which will eventually elicit insulin resistance in other metabolic tissues (117). It is noteworthy that immune cells, especially macrophages, infiltrating the adipose tissue in the obese state are the main contributors to TNF-productionrather than the adipocyte itself.
Another important adipokine secreted by the adipose tissue is IL-6, a pro-inflammatory cytokine. The white adipose tissue is responsible for 10-30% of circulating IL-6 (118). IL-6 can exert paracrine and endocrine effects by reducing glucose uptake in adipocytes and insulin dependent hepatic glycogen synthesis while its effect on hepatic glucose production remains controversial (119, 120). Overall, IL-6 levels are increased in obese and insulin resistant subjects contributing to the development of systemic inflammation (121-123).
6.3 Inflammation-mediated insulin resistance
The following section will highlight some of the triggers of inflammation in obesity that led to its characterization as a chronic low-grade inflammatory disorder.
6.3.1 Obesity: a chronic low grade inflammatory disorder
It is now established that obesity is a chronic inflammatory disorder (124). The chronic inflammatory state observed in obesity is associated with increased adiposity, high levels of pro-inflammatory cytokines in the plasma (IL-6 and TNF-α) and overexpression of TNF-α, IL-1β and interferon (IFN)-γ in adipose tissue of obese humans and animals (125, 126). The original cause of inflammation in obesity is poorly understood but it is suspected to originate in fat cells where metabolic and immune pathways are interrelated (127). Many molecules once thought to play a sole role in immunity are now considered as key modulators of energy metabolism in metabolic tissues (128). Also, some adipokines such as adiponectin, leptin and resistin have been shown to modulate inflammation and metabolism
15 through complex signal transduction mechanisms (129-131). Clearly, there is a cross talk between the immune system and metabolic pathways which is worth investigating.
6.3.2 Macrophage infiltration in adipose tissue
It was shown that immune cells such as macrophages and T-lymphocytes reside in the adipose tissue. These immune cells can mediate an inflammatory response, which can promote insulin resistance (132-135). The presence of macrophages in adipose tissue was first reported in 2000 (136). Consequently, studies have shown how macrophage recruitment and infiltration in adipose tissue were increased concomitantly with the augmentation of adiposity in mouse models of obesity and that these immune cells where bone marrow derived (137-140).
It was reported that the expression of inflammatory cytokines such as TNF-α and macrophage inflammatory protein (MIP)-1α in the adipose tissue was solely derived from macrophages preceding elevations in insulin plasma levels (133, 141); subsequently contributing to local inflammation and insulin resistance in adipose tissue. TNF-α can affect major physiological functions and insulin signaling in the adipose tissue leading to an increase in fatty acid flux from adipose tissue which will further exacerbate the inflammatory phenotype of macrophages creating a vicious cycle of inflammation and insulin resistance (142).
It is believed now that there are two populations of macrophages residing in the adipose tissue, M1 (classically activated) and M2 (alternatively activated) populations. The M1 macrophages are induced by pro-inflammatory cytokines while the M2 macrophages are induced by exposure to anti-inflammatory cytokines such as IL-4 and IL-13 that plays a crucial role in resolving inflammation (143, 144). In diet-induced obesity models macrophages infiltrating the adipose tissue are mostly of the M1 population as compared to their lean counterparts where the M2 population prevails (145).
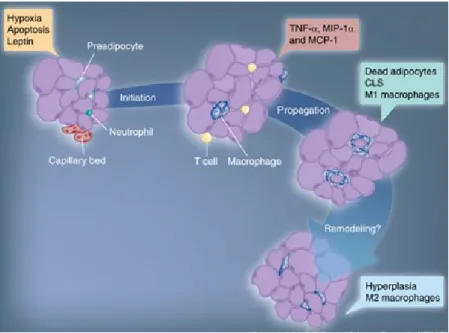
Chemokines such as chemokine (C-C) motif ligand 2/monocyte chemotactic protein-1 (CCL2/MCP-1) and osteopontin are crucial for the recruitment of macrophages to adipose tissue (138, 146). Leptin, whose secretion is increased in obesity, is believed to contribute to macrophage recruitment by increasing adhesion molecule expression on endothelial cells or by acting as a chemoattractant (147, 148). A marker for macrophages infiltration in the adipose tissue is the formation of crown like structure aggregates around dead or dying adipocytes (149). Figure 4 summarizes the process of macrophage infiltration in adipose tissue in the obese state (150).
In addition to macrophages, other immune cells reside in the endothelial region of visceral adipose tissue including mast cells, T cells, natural killer cells, eosinophils and B-cells contributing to the immune response and the inflammatory state of the adipose tissue in obesity (151-155). The question whether inflammation in the adipose tissue is a cause of insulin resistance and metabolic disorder associated with obesity or a consequence to its development remains unresolved.
Figure 4. Stages of macrophage infiltration in the adipose tissue in obesity (Reference 150).
17 6.3.3 Inflammation in other metabolic tissues
The low-grade local inflammation in adipose tissue during obesity will eventually lead to inflammation in other metabolic tissues that will contribute to a systemic inflammatory response. Elevated numbers of macrophages/Kupffer cells, neutrophils, T cells, and B cells have been reported in the obese fatty liver (156-158). It is noteworthy that IL-6, which is secreted by the adipose tissue, can stimulate the production of C-reactive protein by the liver (159). The C-reactive protein level in plasma is an important marker of systemic inflammation and has been correlated with overweight and cardiovascular diseases (160-162). Macrophages have also been detected between skeletal muscle fibers of obese humans (163). Unlike the adipose tissue, little is known about the mechanisms that lead to immune cell recruitment in the liver and the skeletal muscle.
7. Mechanisms linking inflammation to insulin resistance
It is clear now that a crosstalk between immune and metabolic pathways exists. Pro-inflammatory cytokines in addition to acute Pro-inflammatory stimuli such as lipopolysaccharide (LPS) (164), whose levels have been reported to increase in obese subjects, contribute to the development of insulin resistance in obesity. They elicit their action by activating intracellular pathways in insulin target tissues that interfere in the insulin signaling pathway. The inflammation-mediated pathways contributing to insulin resistance will be discussed briefly in the following sections while focusing on the role of reactive oxygen and reactive nitrogen species in mediating insulin resistance.
7.1 Lipid mediators
Some intracellular lipid mediators whose formation is triggered by inflammatory cytokines are known to alter the insulin signaling pathway (165). Cytokines such as TNF-α, IL1-β, and IFNγ can trigger stress signaling leading to the activation of sphingomylenase, which cleaves the membrane incorporated phospholipid sphingomyelin leading to the formation of
ceramides (166-168). Ceramides have been reported to alter the insulin signaling pathway by increasing serine phosphorylation of IRS1 and impairing the insulin receptor kinase. It can also act downstream of IRS1 mediating insulin resistance by preventing Akt/PKB recruitment to the plasma membrane (169, 170) upon stimulation of protein phosphatase 2A-induced dephosphorylation of Akt (171, 172) or by inhibiting the expression of GLUT4 glucose transporter (173, 174).
Another lipid mediator that promotes the effect of cytokines on insulin sensitivity is ganglioside which is distributed within the lipid membrane in lipid rafts (175). High levels of gangliosides have been reported in adipose tissue of obese models. Notably, TNF-α has been shown to increase the expression of ganglioside GM3 synthase leading to an increase in ganglioside content and promoting the insulin desensitizing action of this cytokine (176, 177). Little is known about the exact molecular mechanisms by which gangliosides mediate inflammatory induced insulin resistance.
7.2 MAP kinases
It is established that pro-inflammatory cytokines can activate MAP kinases in different cell types. The MAP kinase pathways include ERK-1/2, p38, and the c-jun N-terminal kinase (JNK) (178, 179). The role of JNK in mediating insulin resistance has been extensively studied. It has been reported that TNF-α can activate JNK-1, which in turn increases phosphorylation of IRS-1 on serine 307 (180, 181). As a result, insulin stimulation of downstream effectors such as PI3-kinase is reduced (181). It has been reported that JNK expression is increased in liver, muscle and adipose tissue of obese models contributing to insulin resistance. Moreover, genetic deletion of JNK enhances insulin signaling (182). Also, pharmacological inhibition of JNK improved insulin sensitivity and glucose tolerance in diabetic mice (183) while the hepatic expression of dominant negative JNK decreased the expression of gluconeogenic enzymes and reduced hepatic glucose production (184).
19 The other members of the MAP kinase family have also been reported to play a role in mediating inflammation induced insulin resistance. It has been reported that inhibiting the upstream activator (MEK) of ERK1/2 MAP kinase blocked TNF-α induced insulin resistance (180, 185). Moreover, activation of p38 pathway upon exposure to TNF-α and IL-1 downregulated the expression of glucose transporter 4 (GLUT-4) (179), thus, the MAP kinase family plays a noticeable role in inflammation mediated insulin resistance.
7.3 Mammalian target of rapamycin (mTOR)
The mammalian target of rapamycin (mTOR) was first identified as a target for the immunosuppressive drug rapamycin (186). It is a serine-threonine kinase that can sense cellular nutrition and energy status. It integrates signals from nutrients and growth factors by activating the PI3-kinase pathway and the phosphorylation of mTOR by PKB/AKT (62). It has been reported that mTOR exerts a negative feedback on the insulin-signaling pathway upon activation by insulin (187). Activation of the mTOR pathway increased serine phosphorylation of IRS1 on several residues thus inhibiting PI3-kinase activity. During high circulating levels of insulin, mTOR is activated leading to the phosphorylation of the downstream kinase p70S6K, which was reported to participate in the degradation of IRS-1 (187-190). mTOR has also been suspected to mediate the insulin resistant effects of TNF-α. It has been shown that rapamycin, a pharmacologic inhibitor of mTOR, blocked the effect of TNF-α on tyrosine phosphorylation of IRS-1 (191). Also, it has been reported that mTOR increases the phosphosphorylation of IRS-1 on serine 636 and 639 decreasing its tyrosine activity (191). Another study has shown that infusion of TNF-α in healthy individuals induced insulin resistance in skeletal muscle, which was in line with activating S6K and increasing serine phosphorylation of IRS-1 (192). These findings back up the involvement of mTOR in inflammation mediated insulin resistance.
7.4 Janus Activated Kinase
The Janus Kinase (JAK) family is a non-receptor tyrosine kinase constituting of four members, Jak1, Jak2, Jak3, and Tyrosine kinase 2 (Tyk2). They can mediate signal transduction when activated by a variety of polypeptides including leptin, TNF-α, most interleukins, and IFN-γ (193, 194). Activated JAKs then phosphorylate receptors on target tyrosine sites which can in turn serve as docking sites that allow the binding of other SH2-domain containing signaling molecules such as STATs, Src-kinases, protein phosphatases and other adaptor signaling proteins such as Shc, Grb2 and Cbl (195-197). Highly expressed Jak2 has been reported in obese insulin resistant animals, which can impair insulin signaling by decreasing the phosphorylation of AKT on serine 473 in muscle cells (198, 199). This promotes JAK kinases as mediators of inflammation induced insulin resistance.
7.5 The NFκB pathway
Nuclear factor-κB is a group of inducible dimeric transcription factors of the Rel family of DNA binding proteins present in all types of cells responsible for activating a number of genes in response to inflammation and stress (200). In the inactive form, NFκB is retained in the cytosol by a family of inhibitory proteins, IκBs which bind NFκB and prevent its translocation to the nucleus. Under inflammatory settings, cytokines can trigger intracellular signaling that lead to the phosphorylation, ubiquitination, and proteolytic degradation of IκB promoting the translocation of NFκB into the nucleus where it regulates the transcription of genes involved in exacerbating an inflammatory response (201, 202). The role of IKK in mediating inflammation-induced insulin resistance has been studied (203). Pharmacological inhibition of IKKβ or its heterozygous deletion was shown to improve insulin sensitivity in obese mice (204). Also, activation of IKKβ promoted insulin resistance in cultured cells. Moreover, insulin resistance caused by lipid infusion in vivo was prevented by pre-treatment with salicylate, an IKK inhibitor, or when introduced to
21 IKKβ+/- mice (205). Clearly, IKK is another inflammatory pathway involved in mediating
insulin resistance.
7.6 Suppressors of cytokine signaling (SOCS)
The role of SOCS family protein is to exert a negative feedback control on cytokine activated pathways (206). SOCS expression is increased in response to cytokines (TNFα, IL-13, IL-6, and IFNγ) and also adipokines (leptin, resistin) to ensure a feedback on the inflammatory response (207). Activation of SOCS3 by TNF-α was reported in adipose tissue of obese mice, in skeletal muscle of diabetic patients, and in peripheral tissues in models of LPS-induced insulin resistance (208, 209). At least three members of the SOCS family, SOCS 1,3 and 6 have been implicated in mediating insulin resistance by interacting with the insulin receptor altering tyrosine phosphorylation of IRS-1 (210-213), reducing association with p85 subunit of PI3kinase and impairing insulin mediated activation of AKT (211, 213). Interestingly, Emmanuelli et al. (211) showed that SOCS3 was highly expressed in adipose tissue but not in muscle and liver of genetically obese mice or mice treated with TNF-α in vivo. Moreover, ob/ob mice lacking TNF-α receptors exhibited a decrease in SOCS3 expression in white adipose tissue when compared to wildtype ob/ob mice. These mice also showed better insulin sensitivity, clearly linking SOCS3 to TNF-α mediated insulin resistance.
8. Oxidative stress/Nitrosative stress in Insulin Resistance State
Important mediators of cytokine induced insulin resistance were discussed in the previous section. However, other potential intermediates involved in mediating insulin resistance are reactive oxygen and reactive nitrogen species, which were found to be increased in obesity (7,214). The term oxidative stress arises from the over production of these species and the inability of the antioxidant systems to neutralize their toxic effects (214).
The following sections will be dedicated to discussing the major sources of these reactive molecules in the cell and their role in mediating insulin resistance in obesity.
8.1 Reactive Oxygen and Reactive Nitrogen Species
Reactive oxygen species are highly reactive free radical metabolites generated from partially reduced O2. The widely known reactive oxygen species are the superoxide anion
(O2.-), hydrogen peroxide (H2O2) and hydroxyl radical (OH.) which is generated by the
Fenton and Haber-Weiss reaction (215-217). The common reactive nitrogen species are nitric oxide (NO) and peroxynitrite (ONOO-) (218). Oxidants are normally balanced by
antioxidants to maintain a redox homeostasis under normal physiological conditions. For example, in most biological systems, O2.- is reduced to H2O2 under the enzymatic action of
superoxide dismutase (SOD), the only molecule that is capable of competing with SOD when present at high concentrations is nitric oxide (NO.) which generates toxic nitrogen
species that can be harmful to the cell (219-222).
Most physiological reactions occur under aerobic conditions accompanied by continuous generation of ROS/RNS. They are considered important intermediates in certain signaling pathways such as the insulin signaling pathway. However, disturbances in the redox balance under pathophysiological conditions such as obesity and diabetes can render these species detrimental to many cellular processes (219, 223).
8.2 Stimuli for ROS/RNS generation
A variety of stimuli can trigger the generation of ROS/RNS which include hormones and growth factors, pro-inflammatory cytokines such as TNF-α which signal through plasma membrane receptors, and environmental factors like ultra violet irradiation (224-227). Also, intracellular factors can promote the generation of reactive species such as metabolic reactions and inflammatory pathways (228, 229). Oxidants can react with different cellular
23 components (protein, lipids and nucleic acids) eliciting reversible or irreversible oxidative modifications. They can also activate pathways involved in stress mediated signaling such as the MAP kinase, JNK, and p38 MAP kinase pathways (230, 231). Under normal physiological conditions, reactive species generation is tightly regulated resulting in reversible modifications, however, in a disease state most oxidative modifications triggered by reactive species are irreversible (229). Accumulation of these irreversible modified biomolecules is what actually contributes to what is known as oxidative and nitrosative stress.
8.3 Sources of ROS/RNS
In the context of obesity mediated insulin resistance extreme generation of ROS/RNS results from oversupply of FFA and glucose, inflammation, and dysregulated secretion of hormones and growth factors. These depend on the main cellular sources of ROS/RNS generation, which include NADPH oxidases, mitochondrial respiration, the endoplasmic reticulum, and nitric oxide synthases (232), which will be discussed in more detail in the following sections.
8.3.1 NADPH Oxidase Family (NOX)
The NADPH oxidase family members are membrane embedded enzymes that catalyze the formation of the superoxide anion by transferring electrons from cytosolic NADPH to molecular oxygen. Superoxide is generated extracellularly or within organelles depending on the cellular localization of the enzyme (233-235).
The first NOX enzyme identified was the gp91phox also known as NOX2 whose role was restricted to ROS production in phagocytic cells for host defense (236). Recently homologues of the cytochrome subunit of gp91phox were identified (NOX1-5 and DUOX1-2) which were found to be expressed in different cell types (233). In humans,
NOX1 has been shown to be induced in the colon and vascular smooth muscle (237, 238), NOX2 is mainly expressed in phagocytes (239), NOX3 is expressed in fetal kidney (240), NOX4 has a widespread distribution including kidney (241), osteoclasts, ovary and eye, NOX5 is mainly expressed in spleen (242, 243), memory glands, cerebrum and DUOX1 and DUOX2 are mainly expressed in the thyroid (242).
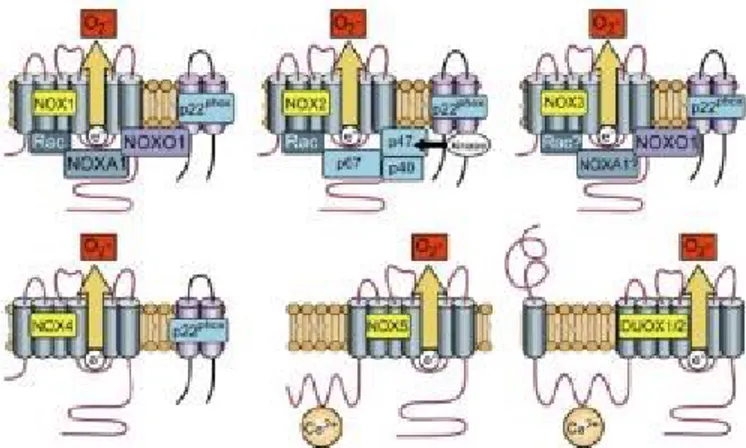
The activation of the gp91phox subunit requires the assembly of regulatory subunits, which are either membrane bound (p22phox) or cytosolic (p47phox, p67phox, and p40phox, RAC2 and or RAC1) (233). However, not all NOX’s are regulated in a similar manner (Figure 5). In the following section I will focus on discussing NOX3 and NOX4 as they pertain to the study presented later in this work.
NOX4 is constitutively producing superoxide and its activation requires only the membrane bound p22phox (241, 244, 245), while NOX3 activation requires NOXO1 (a homologue of p47phox), p67phox and p22 phox (246, 247).
The role of NOX generated ROS in physiology and signaling is still not fully investigated. Interestingly, NOX4 was shown to be required for insulin stimulated ROS in adipocytes and to be important for cell proliferation and differentiation (248, 249). An interesting study has shown that NOX4 generated ROS stimulates macrophage recruitment to adipocytes by increasing monocyte chemotactic factor genes in cultured adipocytes (250).
Figure 5. Activation of NADPH oxidase isoforms. Despite their similar structure and enzymatic function, NOX family enzymes differ in their mechanism of activation
25 However, it is not yet confirmed whether in vivo, ROS can contribute to macrophage infiltration in adipose tissue in obesity. Interestingly, another study has shown that genetic ablation of NOX4 predisposed mice on high fat diet to early onset of insulin resistance and increased adiposity when compared to wild type animals on high fat diet, describing NOX4 as a protector against the development of diet induced obesity and insulin resistance (251). NOX4 was reported to be increased in adipose tissue of obese mice as was NOX2, p22 phox and other of its regulators (252). Increased ROS production in 3T3-L1 adipocytes was induced by FFA or mediated by hyperglycemic conditions and prevented by chemical inhibitors of NADPH oxidases (252, 253). Moreover, mice on high fat diet exhibited an increase in ROS production in adipocytes, which was prevented by NOX inhibitors as well as by protein kinase C (PKC)-indicating PKC-as an upstream regulator of NADPH generated ROS in adipocytes (254). However, the exact mechanism by which NOX generates ROS in adipose tissue in obesity is still not clear, and whether NOX expression is restricted to immune cells infiltrating adipose tissue is still under investigation (255).
It is worth mentioning that ROS generated by NOX4 is mainly hydrogen peroxide whereby most superoxide is generated extracellularly and has to be reduced to hydrogen peroxide in order to diffuse back into the cell and mediate its effect on intracellular signaling pathways (256).
Recently, a new role for NOX3 generated superoxide has been implicated in insulin resistance. NOX3 expression was known to be restricted to the inner ear in mice (257) but it has been demonstrated that NOX3 expression was increased in the liver of ob/ob and
db/db mice. In vitro, palmitate treatment of hepatic HEPG2 cells induced insulin resistance
by activating JNK and p38 MAPK pathways through NOX3 generated ROS (258). Also, Lanflang et al. (259) have shown that treatment of HEPG2 with TNF-α increased ROS production by NOX3 which in turn activated JNK pathways and caused decrease in hepatic glycogen levels. These findings emphasized ROS generated NOX3 as a mediator of insulin resistance in the liver.