iii
Numerical, Experimental, and
Stochastic Modelling
of Volcanic Processes and
Volcanic Hazards
Editors
Paolo Papale,
Editor-in-ChiefIstituto Nazionale di Geofisica e Vulcanologia, Via Della Faggiola 32, 56126 Pisa, Italy
Hideo Aochi
Bureau de Recherches Geologiques et Minieres, Avenue Claude Guillemin 3, 45060 Orleans, France
Christopher J. Bean
Dublin Institute for Advanced Studies, 10 Burlington Road, D04 C932 Dublin, Ireland
Costanza Bonadonna
Department of Mineralogy, University of Geneve, Rue des Maraichers 13, 1205 Geneve, Switzerland
Arnau Folch
Barcelona Supercomputing Center, Jordi Girona 29, 08034 Barcelona, Spain
Alessandro Fornaciai
Istituto Nazionale di Geofisica e Vulcanologia, Via Della Faggiola 32, 56126 Pisa, Italy
Magnus Tumi Gudmundsson
Institute of Earth Sciences, Haskoli Islands University, Sturlugata 7, 101 Reykjavik, Iceland
Stephen J. Lane
Lancaster Environment Center, University of Lancaster, LA1 4YQ Lancaster, United Kingdom
Raffaela Pignolo
Istituto Nazionale di Geofisica e Vulcanologia, Via Della Faggiola 32, 56126 Pisa, Italy
Alison Rust
Center for Environmental and Geophysical Flows, University of Bristol, Wills Memorial Building Queen's Road, BS8 1RJ Bristol, United Kingdom
Gilberto Saccorotti
Istituto Nazionale di Geofisica e Vulcanologia, Via Della Faggiola 32, 56126 Pisa, Italy
Bettina Scheu
Department of Earth and Environmental Sciences, University of Munich, Theresienstrasse 41, 80333 Munich, Germany
iv
Via Della Faggiola 32 - 56126 Pisa, Italy
© Copyright
Re-use of the material in this book is subject to written authorization by the author and tutors of each specific book chapter
This book has been realized in the frame of the European Union Seventh Framework Programme (FP7/2007-2013), Project NEMOH, Grant Agreement n. 289976.
Citation:
Book: Papale, P. et al (2018). Numerical, Experimental, and Stochastic Modelling of Volcanic Processes and Volcanic Hazards. Pacini Editore, Pisa, Italy.
Chapter: Author (2018), Chapter Title. In. Papale, P. et al. (Editors), Numerical, Experimental, and Stochastic Modelling of Volcanic Processes and Volcanic Hazards. Pacini Editore, Pisa, Italy.
Cover picture: 2001 eruption of Mount Etna. Photo courtesy: M. Stoppato.
ISBN: 978-88-6995-428-3 •
Realizzazione editoriale
Via A. Gherardesca 56121 Ospedaletto (Pisa)
Fotolito e Stampa
vii
Contents
Introduction xi
Chapter 1 Detecting displacement steps with seismometers: 1
From laboratory constraints to volcano seismic applications
Johannes Thun, Germany (Self-Description) 23
Chapter 2 Quantifying uncertainties in location and source mechanism for 25
Long-Period events at Mt Etna, Italy
Léna Cauchie, Belgium (Self-Description) 39
Chapter 3 Link between pressure variation and Moment Tensor (MT) 41
in seismic isotropic sources: a comparison with the Mogi Problem
Claudio Trovato, Italy (Self-Description) 55
Chapter 4 Werner Wittmann, Germany (Self-Description) 57
Chapter 5 Seismic propagation effects in the upper volcanic edifice 59
Beatriz Martínez Montesinos, Spain (Self-Description) 73
Chapter 6 Methods for estimating the nature of ice-covered geothermal areas and 75 other subglacial heat sources
Hannah Iona Reynolds, United Kingdom (Self-Description) 89
Chapter 7 Gas transport and flow regimes in crystal-bearing magmas 91
Julie Oppenheimer, France (Self-Description) 109
Chapter 8 Explosivity of steam-driven eruptions in volcanic systems 111
Cristian Montanaro, Italy (Self-Description) 129
Chapter 9 Investigation on the degassing behaviour of analogue volatile- and 131 crystal-bearing magmas upon slow decompression and
implication for basaltic system
viii
Chapter 11 Thevariety of strombolian activity observed and interpreted by 171 high-speed imaging
Damien Gaudin, France (Self-Description) 191
Chapter 12 Aquifers in volcanic regions: Monitoring capabilities and hazards 193
Karen Strehlow, Germany (Self-Description) 217
Chapter 13 Numerical model for the dynamics of a fluid in deformable domains, 219 with application to magma chamber dynamics
Deepak Garg, India (Self-Description) 239
Chapter 14 A spectral-based numerical method for Kolmogorov equations 241
associated with stochastic differential equations
Francisco Javier Delgado-Vences, Mexico (Self-Description) 263
Chapter 15 Application of one-dimensional numerical models for investigation of 265 coignimbrite plume formation
Samantha Engwell, United Kingdom (Self-Description) 277
Chapter 16 Field and theoretical investigations of volcanic ash aggregation: 279 the case of the eruption of 3rd of August 2013 at
Sakurajima Volcano (Japan)
Eduardo Rossi, Italy, (Self-Description) 303
Chapter 17 Volcanic ash modeling with the on-line NMMB-MONARCH-ASH model: model 305 description, applications, and quantification of off-line modeling errors
Alejandro Marti, Spain (Self-Description) 331
Chapter 18 Energy Cone to simulate Pyroclastic Density Currents for probabilistic 333 volcanic hazard: model validation and uncertainty quantification at
Somma-Vesuvius (Italy)
xi
Introduction
Volcanic eruptions are among the most complex of natural processes, with physical and chemical controls occurring over spatial scales from the tens of kilometers of the magmatic system to the sub-millimeter scale of gas and crystal phase nucleation and growth. Time scales range from the multi-millennia of volcanic system evolution, through the seconds (and less) of earthquake generation and magma foam disruption into pyroclastic materials, to microsecond interactions between airborne volcanic ash particles. Volcanic systems display multi-phase, multi-component dynamics, behaviours and properties that are among the most extreme on Earth. Volcanic eruptions are also the source of large to extreme risks for human settlements and challenge engineering resilience (e.g., air traffic), and can exert severe impacts from the local to the global scale, including affecting the Earth climate. Over the last few decades disciplines such as thermodynamics, fluid dynamics, structural mechanics, advanced experiments and computation, have been incorporated within volcano science in order to properly face the great challenge of understanding volcanic processes and volcanic eruptions, and formalized treatment of uncertainties has become a prominent means of volcanic hazard evaluation. However, critically, such developments have not been accompanied by a comparable evolution in the curricula of students and young scientists undertaking a career in volcanology.
Under these circumstances a consortium formed by thirteen European partners has gathered into the FP7 Marie Curie Initial Training Network, GA 289976, “NEMOH – Numerical, Experimental and Stochastic Modelling of Volcanic Processes and Hazard”, with the objective of supporting the growth of the next generation of European volcanologists, capable of extending further the knowledge and understanding of volcano dynamics and the methods and paradigms for volcanic hazard evaluation. Nine Full Network Partners plus four Associated Partners including two SMEs and one Governmental Civil Protection Department comprised the NEMOH consortium. NEMOH gave an opportunity of advanced training and research to eighteen young scientists from eight different countries, six from Europe (France, Belgium, Spain, United Kingdom, Germany, and Italy), and two from outside Europe (Mexico and India), who were recruited for a total of 528 research months.
This volume represents an overview of some of the scientific activities and results obtained by the young scientists trained under NEMOH. To date (August 2017), they have published in total nearly 70 ISI papers, a testament to the success of NEMOH and making this volume necessarily a limited description of their achievements. The original papers collected here illustrate the scientific quality of the NEMOH young scientists and the trans-disciplinary approach of the project, representing in many respects the state-of-the-art for volcanology in the second decade of the third millennium. Experimental, numerical and stochastic analysis and investigation of volcanic processes and volcanic hazards are developed to illuminate further the complexities of volcanic phenomena, from recharge of magma chambers and convection-mixing dynamics inside them, to rock dynamics, rock deformation and propagation of seismic waves, roles of aquifers and ice caps, dynamics of magma
xii
developments in mathematical treatments and numerical approaches, experimental volcanology, and multi-disciplinary and inter-disciplinary applications. Although interactions and cooperation between the fellows (and between their tutors) have been one major component throughout the project, this book is organized into separate chapters by individual young scientists, so to best illustrate their individual contributions. With the purpose of maximizing their exposure, each chapter is followed by a one-page self-description by the corresponding author, illustrating their background, scientific interests, and current career developments.
NEMOH has been a major opportunity of multi-disciplinary training and research for eighteen young volcano scientists in Europe and beyond. Simultaneously, NEMOH extended its training, collaboration, and exchange opportunities to nearly 300 additional young scientists who participated in training and dissemination activities, coming from all over the world and greatly extending the impact of the network. NEMOH organized six one-week long Network Schools, namely: Experimental Volcanology (Munich), Numerical Modelling and Simulations (Bristol), Volcano Monitoring and Surveillance (Stromboli), Volcano Deformation and Tectonics (Iceland), Volcanic Signal Analysis and Processing (Dublin), and Volcanic Hazard Evaluations and Forecasts (Etna). Each one delivered expert lectures, seminars and practical group activities, and included as a fundamental component training on additional skills such as poster and oral presentation, group discussion and extraction of group opinions, abstract writing, and project writing. In addition the following were also delivered: a 5-day course on parallel programming with applications in volcanology (Barcelona), a 3-days course on thermo-fluid dynamics and computational volcanology (Pisa), two NEMOH sessions and two NEMOH short courses on different aspects of quantitative volcanological research held at the EGU General Assemblies in Wien in 2014 and 2015, four NEMOH – Marie Curie Open Days aimed at introducing school students and the public to volcano research with an estimated global attendance above 500 people, and a Final Conference also attended by selected international volcano scientists and representatives from the geothermal industry.
Detailed information on NEMOH activities, and much more regarding the life of the network, is illustrated by the NEMOH website www.nemoh-itn.eu, which includes individual pages dedicated to each one of the eighteen NEMOH young scientists. Today, nearly all of them are continuing their career in science; a few of them have already attained permanent positions as scientists. But maybe the greatest success of NEMOH is that it created a community of multi-disciplinary scientists who understand each other, know what others can provide with their complementary approaches, and how their results can best fit into a multi-disciplinary approach with a global vision of volcano science and volcanic hazards forecasts. Even more significantly, they respect each other and continue to grow as a group of friends; their “NEMOH family”. This family is alive and evolving, inspiring confidence in a successful future for the science of volcanoes.
1
Chapter 1
Detecting displacement steps with seismometers: From laboratory
constraints to volcano seismic applications
Johannes Thun
School of Earth Sciences, University College Dublin, Dublin, Ireland
Tutorship: Christopher J. Bean
1,2,
Ivan Lokmer
11School of Earth Sciences, University College Dublin, Dublin, Ireland 2Geophysics Section, Dublin Institute for Advanced Studies, Dublin, Ireland
Abstract
In seismology, seismic events are analysed and interpreted based on the waveforms recorded with seismo-meters at the surface. On volcanoes, the distances between sources and receivers can in some cases be as short as tens to hundreds of meters, which gives us the chance to record seismograms within the near-field of the sources, where ramp-like ground displacements or tilts can form part of the signal. Such ground motions can add valuable information to our analysis of the source process, but seismometers are not originally designed to measure these step-like signals. Our lab experiments with seismometers on step tables show that steps of the order of a few micrometres can be recovered from broadband seismograms, if we estimate and remove long-period noise using median filters. Applying this method to data recorded near the summit of Turrialba volcano, we observe a step-like ground deformation associated with long-period (LP) events, revealing a previously un-observed static component in the source time history of LP events. In a second application to data recorded above the 2014 Bárðarbunga dyke intrusion in Iceland, we discover repeating micrometre-scale deformation steps. This suggests that the rifting process happens at least partially in small, discrete steps, to our knowledge the first such observation.
Keywords: Volcano seismology, instrumental seismology, deformation, time series analysis
1.
1
- Introduction
The investigation of seismic events on volcanoes plays a major role in enhancing our understand-ing of volcanic systems, as they carry information on the dynamics of the volcanic edifice and its plumbing system. Different kinds of seismic events, such as long-period (LP), very-long-period (VLP) or volcano tectonic events have been observed on many volcanoes (e.g. Chouet, 2003; McNutt, 2005) and associated with various processes. However, the waveforms recorded by seismometers at the surface are strongly influenced by the medium through which the seismic waves have propagat-ed - often a dominant effect in the heterogeneous structures of volcanic propagat-edifices. Additionally, the signals are always contaminated by varying amounts of noise of seismic (e.g. oceanic microseisms,
2
wind, tremor, machinery) and instrumental origin. As a consequence, the information on the source process is masked by multiple processes and thus not straightforward to recover.
While in classical earthquake seismology, the source-receiver distances are often very long, high density networks on volcanoes offer the chance to record signals very close to the source (≤ 1 − 2 km). At such short distances, near-field (NF) and intermediate-field (IF) terms can contribute signifi-cantly to recorded waveforms (e.g. Lokmer and Bean, 2010). The medium through which the seismic waves travel acts as a filter on the waveforms, altering the information sent by the source (the source-time function 𝑀𝑀0(𝑡𝑡)). For example, if there is a static deformation at the source (i.e. a step in
𝑀𝑀0(𝑡𝑡)), this will not appear as a step when observed at a distance, as the far-field (FF) terms are
proportional to the time-derivative 𝑀𝑀̇0(𝑡𝑡). This kind of information is only carried directly in the NF
and IF terms. If we manage to record such information, it can help to gain a better insight into the displacement history at the source and thus into the source process. However, broadband seismo-meters are not originally designed to record this kind of ramp signal and act as an additional filter on the waveforms. We thus carried out laboratory experiments with seismometers on step tables to expose the instrument to actual displacement steps. The recorded data were then used to design a processing routine that enables us to recover displacement steps from the seismograms.
Here we present this routine, followed by applications to two different sets of field data. The first one reveals a displacement step at the summit stations associated with LP events at Turrialba volca-no, Costa Rica, not predicted by the classical resonating source models for these events (e.g. Chouet (1986), Neuberg et al., (2000)). The second dataset was recorded in direct vicinity of an active graben formation associated with an underlying dyke intrusion in Iceland. Our analysis of the local seismic events brings to light details of the deformation process in the area at the time of the experiment. The latter application shows that a careful approach to data analysis can help bridge the gap be-tween seismology and deformation studies.
1.
2
-
Methodology: Using seismometers as deformation sensors?
(modified after Thun et al., 2015)
Our recent near-field observations (≤ 1 − 2 km from estimated source locations) indicate that the frequency content of small volcano seismic events (e.g. LP events) may in some cases extend all the way down to zero frequency, namely corresponding to a displacement step. However, as seismome-ters are not originally designed to measure such signals, here we quantify step displacement recov-ery from broadband seismic data using step table laboratory experiments.
In strong-motion seismology, static displacements associated with earthquakes are recovered from accelerometer data (e.g. Graizer, 2005; Chanerley et al., 2013), although it is a difficult task and displace- ments are often not entirely recoverable. The signal-to-noise ratio (SNR) in these scenarios is typically much higher than for the waveforms associated with volcanic LP events. An important dif-ference between accelerometers and the broadband seismometers used in this study is their fre-quency response. While accelerometers have a finite response at zero frefre-quency (DC), which always forms part of a step signal, broadband instruments are insensitive to DC signals - a direct technical consequence of their high sensitivity over broad frequency bands. Although for this reason
seismo-3
meters might not be ideal for a step recovery, they offer great sensitivity, so that potentially very small steps in the order of micrometers can be obtained.
If we seek to recover ground displacement steps from seismograms, we need to address long-period dynamic noise as well as other long-long-period signals (e.g. from tilt) contaminating the records. The influence of tilt motions on horizontal components of inertial seismometers has been known for a long time (e.g. Rodgers, 1968; Graizer, 2005; Pillet and Virieux, 2007). For small signals and neglect-ing the terms for angular acceleration and cross-axis sensitivity, the differential equation describneglect-ing a horizontal pendulum is:
𝑦𝑦̈1+ 2𝜔𝜔1𝐷𝐷1𝑦𝑦̇1+ 𝜔𝜔12𝑦𝑦1= −𝑥𝑥̈1+ 𝑔𝑔𝜓𝜓2 (1)
where 𝑥𝑥1 and 𝑦𝑦1 are ground displacement and the pendulum response, respectively; 𝜔𝜔1 and 𝐷𝐷1 the
natural frequency and critical damping of the pendulum, respectively; 𝑔𝑔 is the gravitational accelera-tion and 𝛹𝛹1 the ground rotation around the second horizontal axis, i.e. tilt in 𝑥𝑥1-direction (for details
see Graizer, 2005). Here we see that tilt has a first order effect on the horizontal pendulum, which can in fact become dominant at long periods (e.g. above 10 s). Currently available tilt meters on the other hand, are also susceptible to translational motion in the LP (e.g. 0.5 – 5 Hz) frequency range (Fournier et al., 2011). Hence with current instrumentation we cannot fully distinguish tilt motion from translational motion. Until real rotational sensors that can be deployed in a field setting are de-veloped (e.g. Schreiber et al., 2006), other ways of dealing with tilt have to be adopted.
The equation for the vertical response looks similar to Equation 1, but the last (rotational) term can be neglected, which means the vertical component seismograms are not sensitive to small tilts. Wielandt and Forbriger (1999) used this difference between vertical and horizontal components to separate translational and rotational contributions on horizontal seismograms in the near-field of an assumed isotropic source. In general, this property makes a displacement step recovery from vertical recordings a lot more straightforward and less ambiguous than from horizontal components.
1.
2.1
- Laboratory experiments
As broadband seismometers measure the ground velocity, their output can be numerically inte-grated (e.g. with the cumulative trapezoidal method) to obtain displacement information. However, a seismometer’s response filters true ground motion - by design seismometers lose sensitivity in the limit of zero frequency. Consequently, instrument noise starts to dominate for longer periods. Dis-placement steps (i.e. one-sided positive or negative velocity pulses) have a broad spectrum, includ-ing static (or zero) frequencies. Here we assess the degree to which displacement steps can be re-covered from broadband seismometer data. We carried out laboratory experiments in which we ex-posed seismometers to well-defined steps, using a Lennartz CT-EW1 step table, which can achieve vertical steps as small as ∼90 μm with high precision. The displacement time history varies between 0.5 s and 2.5 s, depending on table setting and load. In addition, we designed and built a simple cus-tomized step table (Figure 1C), which does not have the same precision as the calibration table, but allows for an arbitrary displacement time history. The displacement is driven by manual operation of
4
a micrometer screw and its value can be read directly from the screw’s scale, with a resolution of 10 μm. It is directed at a 45° angle with respect to the ground, resulting in equivalent displacements in upwards and horizontal directions. Tilting of the table with angles of the order of about 10 microradians cannot be avoided in this setup and has to be kept in mind especially when analys-ing horizontal recordanalys-ings. However, in comparison to tilt steps measured on volcanoes (typically a few orders of magnitude smaller), these signals are large and serve as an upper limit for tilt contami-nation of field data.
1.
2.1.1
- Vertical component
Figure 1A shows the integrated vertical seismograms, i.e. displacements, of a 94 μm upward step (black: ramp time 0.6 s; red: 1.8 s ramp with added noise, see below), recorded by a Guralp 3ESPCD (60 s) instrument on the Lennartz table. The uppermost plot shows unprocessed, integrated seismo-grams, which is approximately the instruments’ impulse response, acting as a causal high-pass filter. In the second panel, the instrument response was removed without additional filters. The step is now clearly visible in the data, but amplified (very) long period noise is also present. During the de-convolution of the instrument response, high-pass filters are routinely applied in order to deal with this noise. Hence, the third plot shows the effect of an acausal high-pass filter (a zero-phase butter-worth filter that conserves the waveform better; may lead to precursory signals, thus called ”acaus-al”) with the corner frequency of 0.01 Hz. Whilst it reduces long period noise, it also alters the step waveform significantly by removing its low-frequency portion. For higher filter frequencies (note that the typical lower LP filter corner of 0.3 Hz is about 5 octaves above 0.01 Hz) the step waveform is completely masked by the filter and cannot be distinguished from a dynamic motion. We assessed other filtering methods and found moving median filters suitable for the task of step recovery. Simi-lar to moving average filters, we take the median of a window of width 𝑀𝑀 around each data point 𝑥𝑥𝑛𝑛:
𝑥𝑥
𝑛𝑛𝑀𝑀= Median �𝑥𝑥
𝑛𝑛−𝑀𝑀2𝑓𝑓s
, … , 𝑥𝑥
𝑛𝑛+𝑀𝑀2𝑓𝑓s�
(2)where 𝑓𝑓s is the sampling frequency and 𝑀𝑀 is given in seconds. The filter is used to estimate the
long-period noise of the velocity record and is insensitive to transient signals with durations significantly shorter than half the window length. As high frequency noise, tremor or other signal components can impede noise estimation with the (non-linear) moving median filter, a low-pass filter is applied to the instrument corrected data. A corner frequency of 𝑓𝑓c= 5/𝑀𝑀 was found suitable. The noise
es-timate is then subtracted from the original unfiltered, instrument corrected velocities and the result integrated to get displacements. The outcome for the previous lab example, using a moving median filter with 𝑀𝑀 = 30 s is shown in the lowermost panel of Figure 1A, where the step waveform is suc-cessfully recovered from the seismogram. The misfit of the step estimation is:
𝛥𝛥step =𝑢𝑢measured𝑢𝑢 −𝑢𝑢real
real =
102 µm−94 µm
5
i.e. the amplitude of the step is overestimated by 8.5 %. In comparison to field observations, the SNR in the experiment is very high and the rise time of the step is quite short (0.6 s). We thus used the recording of a slower step (i.e. a smaller velocity pulse) from the same table (1.8 s rise time) and added noise recorded on Turrialba summit station CIMA (red lines in Figure 1A). The noise was am-plified in order to match SNRs observed on Turrialba (see Section 3). The resulting displacements show that for SNRs similar to our Turrialba field data, the step is still well recovered with a misfit of 𝛥𝛥 = 0.053, i.e. overestimated by about 5 %. Comparing different noise levels added to step table da-ta, we estimate that the method’s detection threshold for steps lies at about 1 μm for a 3ESPCD in-strument. This corresponds to approximately 5 times the root-mean-square amplitude of the dis-placement noise below 2 Hz.
Figure 1. A. Recovery of a vertical 94 μm step recorded on a Lennartz step table. Black: 0.6 s ramp time; red: 1.8 s ramp time
and added field data noise. The step is masked by the bandpass filter, moving median filters can reduce noise without masking the step. B: Recovery of vertical steps with varying ramp lengths and median filter windows, recorded on customized step
table. Grey area indicates the actual displacement including errors. C: Customized step table, allowing for ramps of varying
amplitudes and rise times; the arrow marks the micrometer screw used to control the displacement. D: Recovery of a
horizon-tal step contaminated with tilt. In the upper panel, velocities are shown, exhibiting the very long period tilt response on the uncorrected horizontal component. This tilt signal can be reduced following Wielandt and Forbriger (1999). The lower panel shows the displacements after additionally applying the median filter method. Here the horizontal step aligns well with the identical vertical step (as seismometer displacements in horizontal and vertical directions are equal), meaning it is well recov-ered on both components (Figure modified after Thun et al., 2015).
As the Lennartz table is restricted to vertical motion and limited step rise times, we tested the performance of the processing on different ramp lengths using our customized step table. We ex-posed the same instrument to steps of about 100 μm (about 70 μm in vertical and north directions of the instrument), altering ramp times between 0.6 s and 20 s. We applied the processing described above, with varying median filter windows to recordings of different ramps (Figure 1B). The grey ar-ea shows the actual displacement, including an assumed error of about ±10 % (based on rar-eading
6
precision at the micrometer screw). The results shown in Figure 1B confirm that stable results are achieved as long as the filter window 𝑀𝑀 is chosen accordingly. We recommend a window length of about three times the ramp time. As in practice the ramp time is unknown, the signal length inferred from raw displacements can be a good starting point. If the length of the filter window is not suffi-cient for a given signal, it can strongly affect the recovered step. On the other hand, if the step is re-al, the recovered value is stable over a wide range of 𝑀𝑀 (Figure 1B). Hence, we explore different windows 𝑀𝑀, starting at 3 times the signal length and gradually increasing 𝑀𝑀 by 5 s each time until we achieve a robust solution with satisfactory noise removal. For now, this manual process is necessary to ensure stability and robustness of the results. There is no upper limit for the choice of 𝑀𝑀, but as filter windows get longer, less noise can be removed. Consequently, the method is limited by the SNR.
1.
2.1.2
- Horizontal component
Our customized table displaces the instrument horizontally to the same extent as vertically due to its 45° angle of translation with respect to the ground. During the displacements, driven by turn-ing the micrometer screw, the table surface is tilted uncontrollably, a problem that cannot be avoid-ed when creating horizontal displacements with this setup. This tilt leads to a long period transient dominating the horizontal seismograms (see dashed line in Figure 1D), but negligible on the vertical component. Associated with the displacements, we measure steps of about 1 to 20 · 10−6 g in
in-strument corrected and differentiated (i.e. acceleration) seismograms. According to the tilt term in Equation 1 this corresponds to tilt steps of about 1 to 20 μrad. Tilts this strong make it difficult to ex-tract displacement steps from the horizontal seismograms, but do not interfere with recovery on the vertical component, as shown above. However, the tilts observed in our field experiments on volca-noes, where there are any, are several orders of magnitude smaller and thus do not create signifi-cant transients. A tilt step of the order of a few microradians would be directly visible particularly as a major waveform difference between vertical and horizontal components (see above and Figure 1D).
As the instrument in our experiment sits directly on the source and the tilt signal is negligible on the vertical component, the assumptions underlying the tilt separation method of Wielandt and For-briger (1999) are fulfilled. We thus applied this method to the data for the fastest step (0.6 s with 𝑢𝑢𝑥𝑥 = 𝑢𝑢𝑧𝑧≈ 70 µm), where a tilt of about 14 μrad affected the north component, while the
displace-ment in this direction was identical to the upward motion. The horizontal raw velocity seismogram (Figure 1D, dashed red line) shows a long-period transient, the seismometer’s response to a tilt/acceleration step (for details see Kinoshita, 2008). The tilt separation method was carried out be-tween 0.005 Hz and 1 Hz, which exceeds the band suggested by Wielandt and Forbriger (1999) (0.005 Hz – 0.05 Hz), but works well here due to the high SNR. The solid line shows the resulting seismograms, in which the estimated tilt has been removed. Although the method’s fit for this ex-treme (large tilt) example is not ideal (energy of the residual is about 8 % of the original trace), it re-duces the tilt transient significantly and thus exposes the velocity pulse. The lower panel in Figure 1D shows the displacement seismograms after application of the median filter method. Whilst without
7
tilt reduction, the step is not retrieved on the horizontal component (dashed line), it is successfully recovered when tilt was reduced before median filter application. Both vertical and horizontal dis-placements show a step of about 77 μm, which is in good agreement with the known displacement (70 μm) in the presence of such large tilt contamination.
1.
2.1.3
- Summary
In conclusion, we demonstrate that static displacement steps can be recovered from seismome-ters when long-period noise is carefully addressed. Moving median filseismome-ters are a suitable tool to re-duce this noise adequately, although strong tilt contamination on horizontal components may have to be dealt with separately. Although we did not test this for instruments other than the aforemen-tioned Guralp 3ESPCD (60 s; 2 x 3000 V/(m/s)) and a Guralp 6TD (30 s; 2 x 1200 V/(m/s)), in principle any broadband seismometer should be suitable for step recovery, as long as the response is well known and can be removed accurately. In our tests, the (shorter period and less sensitive) 6TD in-strument showed a lower SNR at long periods than the 3ESPCD type, posing a problem for small sig-nals. Low instrumental noise at long periods is thus desirable. In the following we apply the con-straints found in this section to field observations on volcanoes.
1.
3
-
Applications to field data: Long-Period Event on Turrialba
(modified after Thun et al., 2015)
As the occurrence of Long-period (LP) seismic events is often thought to be directly associated with magmatic or hydrothermal processes (e.g. Chouet, 2003, and references therein) they can give information on the volcanic plumbing systems and changes in volcanic activity. According to the clas-sification of LP events given by Chouet (2003) typical LP events contain frequencies between 0.5 Hz and 5 Hz, although McNutt (2005) pointed out significant changes with time and between different volcanoes. In the data recorded on Mt Etna, Sicily (Lokmer et al., 2008) and Turrialba, Costa Rica (Eyre et al., 2013), we observed additional low energy spectral content well below these typical fre-quencies. This observation can have significant implications for our understanding of the nature of source time functions (STFs).
STFs from LP source inversions are often explained by fluid-filled cavity models proposed e.g. by Chouet (1986) and Neuberg et al. (2000). In these models, slow waves travel at the fluid-solid inter-face and their interference can cause sustained resonance observed at the surinter-face (Chouet, 1986; Ferrazzini and Aki, 1987). Full waveform inversions of LP events have been implemented in studies on several volcanoes, with results often interpreted within the scope of such models (e.g. Legrand et al., 2000; Kumagai, 2002; Nakano et al., 2003; Kumagai et al., 2005; Lokmer et al., 2007; Cusano et al., 2008; De Barros et al., 2011; Eyre et al., 2013). It is important to note that the waveforms used in these inversions were band-pass filtered. Recent observations in the summit region (e.g. Fig. 2b in Lokmer et al., 2007; Bean et al., 2014; Eyre et al., 2015) show impulsive waveforms associated with LP events. Bean et al. (2014) and Eyre et al. (2015) demonstrated that resonance observed on seis-mograms can be a consequence of wave propagation in poorly consolidated materials for stations more than about 1 km from the source. Consequently, Bean et al. (2014) proposed an alternative
8
model, where shallow LP events are a consequence of slow rupture within the volcanic edifice. Eyre et al. (2015) showed that this source model can explain LP event waveforms recorded on Turrialba volcano.
The current processing practice of filtering LP events within the most energetic frequency band prior to inversions means that most of the LP sources interpreted in the literature are band-pass fil-tered representations of the true source-time histories. In our unfilfil-tered integrated field data, we recently observed small apparent displacement steps in the near-field of individual LP events. If this observation is real, it could significantly contribute to our understanding of LP sources. In the follow-ing, we show how the constraints gathered in the previous section can shed new light on the true ground motion caused by some LP events.
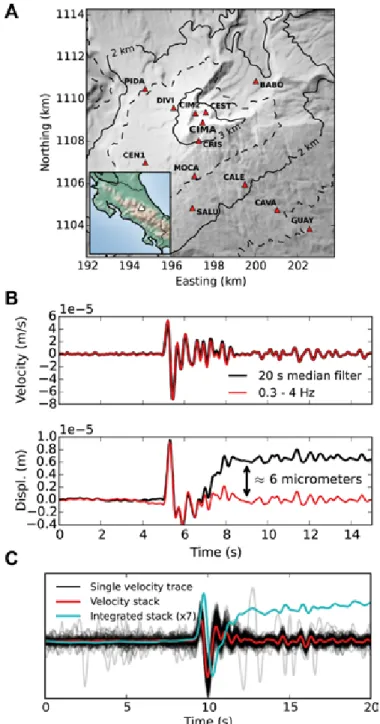
Figure 2B shows the vertical seismogram of an LP event recorded on Turrialba in 2009 by the summit station CIMA (map in Figure 2A), using the same instrument type that we used in the labora-tory (Guralp 3ESPCD 60 s). Here we compare the classical LP band pass filtered trace to the one pro-cessed with the median filter. In both cases, a low pass filter with a corner frequency of 4 Hz was ap-plied in advance. While the velocity seismograms do not show a significant difference, the displace-ments show a clear step when processed with the median filter; this displacement step cannot be seen when data are filtered with the bandpass filter, as is common practice. As the rise time of the step, starting at about 6.5 s, is no longer than about 2 s, the 20 s median filter window applied in Fig-ure 2B is in accordance with the results from the laboratory experiments.
This step behaviour is not singular to this LP event, but can be observed for multiple events in the 2009 catalogue. Figure 2C shows seismograms of a family of 183 events (from family 2 in Eyre et al. (2013)) and a stack of these. Here the data were corrected for instrument response and trend, but no further filters were applied. The data were normalised to match the peak-to-peak amplitudes be-tween events. Although (due to strong long-period noise) only some single events show a clear static displacement like in Figure 2B, the integrated stack of this family shows a pronounced step, even without applying a median filter. This shows that this step-like behaviour is coherent across LP events and can be detected when recorded in the near field at the summit of Turrialba. The same behaviour was observed at a second summit station CIM2 (Figure 2A), using the same instrumenta-tion. Shorter period instrumentation and greater distances from the summit lead to sparse observa-tion of such steps at other locaobserva-tions during the same field experiment.
The data demonstrate that both single event recordings and stacks of numerous repeating events show step-like displacement waveforms, which present as wave “pulses” in velocity seismograms. Low cut filtering traditionally applied prior to waveform inversion does not preserve these displace-ment signals, compromising our assessdisplace-ment of the broadband source-time history. These step-like displacement signals are only seen in the near-field region from the source, consistent with theoreti-cal displacement fields for dislocations (e.g. Okada, 1992). The near- and intermediate-field terms, containing static deformation signals, decay much faster with the source-receiver distance than the purely dynamic far-field term (Lokmer and Bean, 2010). As a consequence, the step signal can rapidly fall under the detection threshold (around 1 μm on 3ESPCD instruments) within a distance of approx-imately 1–2 km from the source.
9
Figure 2. A. Station locations on Turrialba volcano in 2009. Inset shows the location of the volcano within Costa Rica. B: Top:
Vertical LP event seismogram from Turrialba, recorded on Turrialba station CIMA in 2009, processed with median filter (20 s) or bandpass filter (0.3 – 4 Hz); Bottom: corresponding displacements; median filter processed data shows a step masked by the bandpass filter. C: Stack of 183 unfiltered, instrument corrected and normalised LP events from a family at station CIMA.
Due to the high S/N ratio in the stack, a step similar to the single event in B is visible in the unprocessed integrated stack. (Fig-ure reproduced from Thun et al., 2015).
10
A more detailed analysis of these new observations, including source inversions, is beyond the scope of this study. Hence we do not attempt to relate the surface waveforms directly to source models here. However, our results show that we are missing important information on LP sources if we analyse only the most energetic part of the recordings. These new observations pave the path for a more detailed analysis of LP sources from existing and future datasets.
1.
4
- Applications to field data: Deformation at Bárðarbunga, Iceland
(modified after Thun et al., 2016)
Ground deformation caused by magma migration and tectonic processes can often be observed in volcanic environments with ground- and satellite-based methods such as GPS and InSAR (e.g. Ofeigsson et al., 2011; Geirsson et al., 2012; Sturkell et al., 2013; Sigmundsson et al., 2015). The technical restrictions of these methods limit the smallest observable deformations to a few millime-tres at best, with actual resolutions typically in the centimetre range (Sigmundsson et al., 2015; Bürgmann et al., 2000). For InSAR, the temporal resolution is further limited to several days. As a consequence, neither method currently allows us to investigate the micrometre scale nature of near-surface deformation processes. Instead we observe accumulated deformations that smooth out the underlying details of the ground deformation process. Hence the details regarding precisely how the Earth’s surface rifts at small spatio-temporal scales in volcanic environments are unclear.
An exceptional opportunity to investigate such deformation processes was posed by the 2014– 2015 rifting episode and eruption at Bárðarbunga in Iceland, where we acquired data in the immedi-ate vicinity of active surface rifting. Starting in August 2014, a limmedi-ateral dyke propagimmedi-ated below the face for over 45 km (Fig. 3A), indicated by the temporal and spatial evolution of seismicity and sur-face deformation patterns (Sigmundsson et al., 2015; Gudmundsson et al., 2016). Interestingly, de-spite the high level of observed seismicity below a depth of about 3 km, there was a lack of shallow (< 3km deep) earthquakes associated with such a large rifting event (Sigmundsson et al., 2015; Ágústsdóttir et al., 2016; Ruch et al., 2016). The dyke eventually fed an eruption at the Holuhraun eruptive fissure, the southernmost tip of which was located approximately 5 km north of the Vatnajökull glacier rim. The effusive activity lasted for 4 h on 29 August 2014 and later continued for 6 months from 31 August 2014. In the area not covered by the glacier, divergent rifting (total surface opening ~2.5m between mid-August and mid-September; Sigmundsson et al. (2015); Hjartardóttir et al. (2016)) was observed at the surface, accompanied by substantial graben subsidence (2.5 m to 5.5 m) directly above the inferred dyke (Sigmundsson et al., 2015; Hjartardóttir et al., 2016; Ruch et al., 2016). The graben formation caused large surface fractures along its borders, revealed by satellite, aerial and field observations (Hjartardóttir et al., 2016; Ruch et al., 2016) and the dip of the associat-ed normal faults was estimatassociat-ed to be ~75°, basassociat-ed on the measurassociat-ed surface deformation (Hjartardót-tir et al., 2016). In the northernmost region of the glacier, the graben formation caused an elongated dent in the relatively thin ice sheet (Rossi et al., 2016).
The details of the 2014–2015 Bárðarbunga volcano-tectonic episode have been addressed in nu-merous studies, e.g. Sigmundsson et al. (2015); Gudmundsson et al., (2016); Ágústsdóttir et al., (2016); Hjartardóttir et al., (2016); Rossi et al., (2016); Ruch et al., (2016); Gudmundsson et al.,
11
(2014). It was one of the largest rifting events and the largest effusive lava eruption in Iceland since the 1783–84 Laki eruption (Thordarson and Self, 1993) and offered an unprecedented opportunity to study rifting processes in detail.
1.
4
.1 - Experiment and Data Analysis
In the afternoon of 30 August 2014, we installed a small profile of three 3-component broadband seismometers (Guralp 6TD 30 s) perpendicular to the graben and inferred dyke (Fig. 3A), with the closest station (DY3) directly at the western shoulder of one of the large graben boundary faults and the other two stations approximately 1 km (DY1) and 2 km (DY2) from DY3. The surrounding area was characterised by several metres of poorly consolidated volcanic ash and sand on top of partially fractured basaltic lava flows (Sigurgeirsson et al., 2015), a strongly scattering environment for seis-mic waves. As strong ground shaking could be felt during the experiment, the operation had to be aborted for safety reasons, resulting in ~26 minutes of synchronous data on all stations. On 5 Sep-tember 2014, a new fissure opened approximately 600 m east of DY3 and effused lava for 2 days.
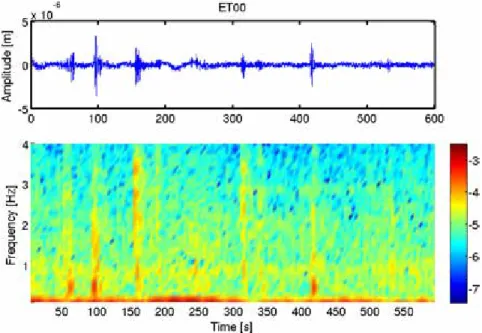
The unprocessed vertical velocity seismograms (Fig. 3B) show coherent activity on all three sta-tions. However, the focus of this study lies in five high amplitude signals on station DY3 (red arrows in Fig. 3B), which are not registered by the other stations DY1 and DY2, suggesting that the causative events are relatively small and local to DY3. The velocity seismograms and the corresponding scalo-grams of these events (event number 3 shown in Fig. 4A,B) show impulsive waveforms with a main frequency peak between 3 and 8 Hz and a secondary peak above 25 Hz. As high-frequency waves are attenuated strongly when travelling through the ground, such high frequencies thus indicate a frac-turing process close to the station.
In Figure 4C–E, we applied the median filter method presented in Section 2 (see also Thun et al., 2015) and observe displacement steps on all three (orthogonal) components of the instrument, i.e. the station was displaced by approximately 125 μm in a northwest, slightly upward direction. This represents a motion away from the centre of the graben and the underlying dyke. Applying this pro-cedure to the full-length records on this station reveals similar amplitudes and ratios between differ-ent displacemdiffer-ent compondiffer-ents for all five evdiffer-ents (Fig. 4F), suggesting a repetitive process with similar source locations and an apparent average inter-event time of about 4.5 minutes. As horizontal com-ponents of seismometers are also susceptible to ground rotation (Rodgers, 1968; Graizer, 2005; Pillet and Virieux, 2007), possible tilts can be estimated from the data using the tilt transfer function (Ao-yama and Oshima, 2008; Genco and Ripepe, 2010; Lyons and Waite, 2011); this involves a simple in-tegration of raw data and multiplication with a factor depending on well-known instrument proper-ties. The resulting traces (Fig. 4G) show tilt steps of 1.3 – 4 μrad oriented in a northwest direction as-sociated with each of the five events. The tilt step directions coincide with the direction of the dis-placement steps (Fig. 4H) and support a repeating source process generating the events, with rough-ly consistent amplitudes and locations.
12
Figure 3. Overview of the seismic experiment and recorded data. A, Map of stations DY1, DY2 and DY3 (Guralp 6TD
seismome-ters) installed north of the Vatnajökull glacier (white) on 30 August 2014 immediately adjacent to several large surface frac-tures; fractures (yellow) and eruptive fissures (red) mapped by Hjartardóttir et al. (2016); dyke location (red dashed) inferred by Sigmundsson et al. (2015); elevation data from National Land Survey of Iceland. Inset map shows the location within Ice-land (plotted with Matplotlib Basemap Toolkit (Whitaker, 2014) using the ETOPO1 model (Amante and Eakins, 2009)). B,
Unfil-tered vertical recordings on all three stations. Arrows mark the step events on DY3 investigated in this study. These events are not visible on stations DY1 and DY2. (Figure modified after Thun et al., 2016).
13
Figure 4. Individual step event (A-E) and processed full-length seismograms showing ground deformation (F-H) at station DY3. A, Vertical velocity waveform (instrument corrected). B, Scalogram illustrating relative frequency content – the main
frequen-cy peak lies between 3 Hz and 8 Hz, with an additional peak above 25 Hz. C-E, Vertical, North and East displacements,
respec-tively; processed with the median filter method (Thun et al., 2015). The resulting displacement step is about 17 μm upward and 123 μm in a northwest direction. F, Median filter processed seismogram for step recovery (black: Vertical, red: North,
cyan: East), showing a consistency of step direction for the individual events. Note that between events 3 and 4, a longer peri-od event impedes the filter performance, leading to a slight artificial step. G, Tilt record retrieved from seismograms using the
tilt transfer function (Aoyama and Oshima, 2008). While the long-period trend is not interpreted here, each of the 5 events shows a clear tilt step on both horizontal components. H, Directions and amplitudes of horizontal deformations of the 5 steps
seen in F and G. (Figure modified after Thun et al., 2016).
1.
4
.2 - Source location
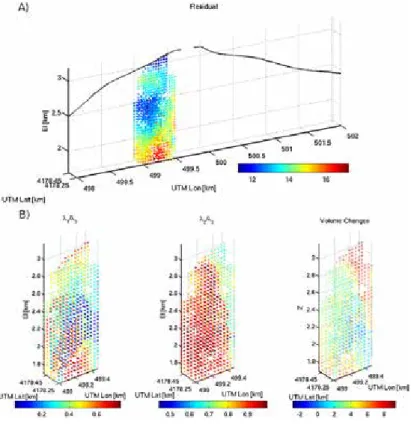
Although one station is not sufficient to fully invert for source locations and mechanisms, we use the observed static deformations from DY3 to explore potential sources with a forward modelling approach. We estimate the source location and magnitude by (i) assuming a plausible source mech-anism and (ii) performing a search over a 200 x 200 x 100 m3 grid around the station (as discussed
above, the source has to be a lot closer to DY3 than to DY1 at a distance of 1 km, thus we assume a distance of less than 100 m), where we match the observed ratios between different deformation components with the theoretical values for a homogeneous, elastic medium (Okada, 1992). The rati-os are defined as 𝑟𝑟1= 𝑢𝑢𝑢𝑢Z N, 𝑟𝑟2= 𝑢𝑢Z 𝑢𝑢E, 𝑟𝑟3= 𝑢𝑢Z 𝑡𝑡N, 𝑟𝑟4= 𝑢𝑢Z 𝑡𝑡E (4)
14
where uZ, uN and uE are displacements and tN and tE are tilts. Subscripts Z, N and E denote a vertical,
north and east direction, respectively. These ratios are used to compute two misfits, Rd
(displace-ments only) and Rdt (both displacements and tilt), defined as:
𝑅𝑅d= �𝑟𝑟1,calc𝑟𝑟− 𝑟𝑟1,obs 1,obs � 2 + �𝑟𝑟2,calc𝑟𝑟− 𝑟𝑟2,obs 2,obs � 2 , 𝑅𝑅dt= 𝑅𝑅d+ �𝑟𝑟3,calc𝑟𝑟− 𝑟𝑟3,obs 3,obs � 2 + �𝑟𝑟4,calc𝑟𝑟− 𝑟𝑟4,obs 4,obs � 2 . (5)
The minimum misfits indicate the best location for the chosen source mechanism and the corre-sponding seismic moment M0 can be found by a simple least squares inversion.
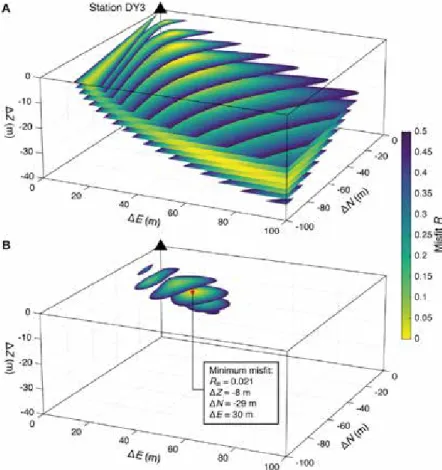
As the station is located in direct proximity to the faults associated with the graben formation, we suspect that the local events are part of the faulting process. Consequently, we assume a 75° dip-slip mechanism parallel to the N25°E striking boundary fault (see Hjartardóttir et al., 2016) as the source mechanism. Figure 5 shows the misfits for this normal fault mechanism, where the observed tilt and displacement values of the third step (Fig. 4F,G) are used. Here we assume a medium P-wave velocity of VP = 500 m/s and Poisson’s ratio of n = 0.3, consistent with values obtained for
unconsoli-dated upper geological layers at various volcanoes (Ferrazzini et al., 1991; DeLuca et al., 1997; Met-axian et al., 1997; Chouet et al., 1998; Cauchie and Saccorotti, 2013) (further discussion in supple-mentary information). For clarity, only misfit values below 0.5 are displayed and all remaining misfits are located in the quadrant south-east of the source. As the displacement-only misfit Rd (Fig. 5A)
does not converge around a single minimum, it can only indicate the approximate direction of the source with respect to DY3. When tilts are introduced (Fig. 5B), a sharp minimum misfit Rdt is found
approximately 40 m southeast of DY3 at a depth of 8 m. The best-fitting source moment at this loca-tion is M0 = 1.5 x 10⁸ Nm (moment magnitude MW = 0.6). When we change VP to 1000 m/s, the
source location remains unchanged, with the source moment increasing to M0 = 7.1 x 10⁸ Nm
(MW = 0.2). The same grid search with different medium parameters leads to similar source-receiver
distances and source moments (Table 1). The source moments are small enough to justify the use of the point-source assumption in our forward modelling approach.
Static displacements such as those observed at DY3 are near- and intermediate-field effects and can only be observed within a fraction of a wavelength from the seismic source (Lokmer and Bean, 2010). The sources inferred above would theoretically cause total static displacements smaller than 1 μm at the next closest station, DY1. Sub-micrometre steps are not detectable with our instruments and methods (Thun et al., 2015). The fact that the events are not visible at the other stations also implies that the dynamic seismic signals, i.e. all near-, intermediate- and far-field components, fall under the noise level at these locations, likely due to strong wave attenuation in the unconsolidated surface materials (Sigurgeirsson et al., 2015).
15
Figure 5. Misfits between field observations and displacements and tilts calculated using analytical solutions (Okada, 1992) for
a 75° dip-slip (normal fault) source. A, Misfit Rd using only displacement ratios. B, Misfit Rdt using both displacement and tilt ratios, showing a single confined minimum at DZ = 8m, DN = 29 m, DE = 30 m. Misfits are displayed in horizontal slices of 2m spacing and values above R = 0.5 are not shown. Material parameters for both A and B: VP = 500 m/s and n = 0.3. (Figure mod-ified after Thun et al., 2016).
1.
4
.3 - Source dimensions
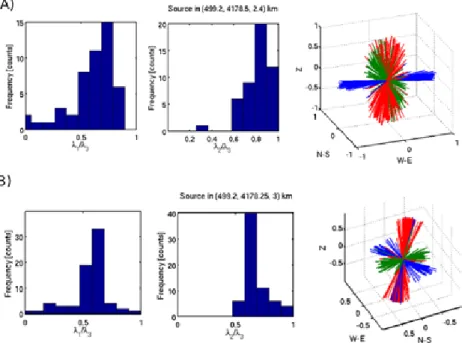
For the source location found above, we determine source parameters (size and slip) by remov-ing path effects through deconvolvremov-ing modelled deformation and seismic radiation (Green’s func-tion) from the recorded seismogram shown in Figure 4C. Here we use the linear relationship be-tween the ground displacement spectrum U(w) and the source moment spectrum M(w) (Lokmer and Bean, 2010):
𝑈𝑈(𝜔𝜔) = 𝑀𝑀(𝜔𝜔) ⋅ 𝐺𝐺(𝜔𝜔, 𝒓𝒓, 𝑉𝑉P, 𝜈𝜈, 𝜌𝜌, 𝑅𝑅𝑅𝑅, 𝑄𝑄) (6)
where the Green’s functions G depend on the receiver position r relative to the source, the elastic properties of the medium VP and n, the density r, the radiation pattern RP for a specific source
16
for each frequency. The resulting source moment spectrum M(w) is subsequently fit with a w2 source
model (Brune, 1970) in order to determine the corner frequency. We calculate G(w) for the inferred normal fault source with the expressions given by Aki and Richards (2002) and modified by Lokmer and Bean (2010), using the same parameters as above (VP = 500m/s, n = 0.3). Q is varied until we
ob-tain the best fit to the w2-model (Q = 20). The source-time history M(t) resulting from this
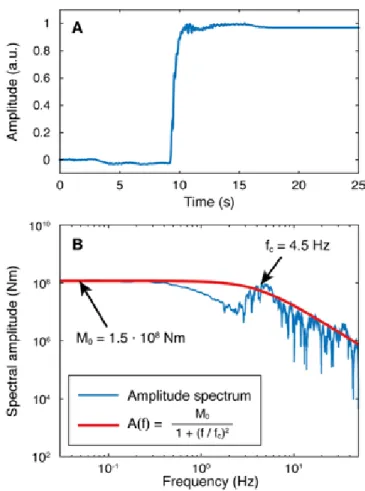
deconvo-lution is shown in Figure 6A. Its spectrum and the w2-model fit are shown in Figure 6B, resulting in a
corner frequency of 4.5 Hz. Mechanism n VP (m/s) ΔZ (m) ΔN (m) ΔE(m) M0 (Nm) Rdt Dip-slip 0.25 500 -8 -31 26 1.8 · 10 8 0.018 q = 25° 1000 ″ ″ ″ 8.3 · 108 ″ d = 75° 0.3 500 -8 -30 29 1.5 · 10 8 0.021 1000 ″ ″ ″ 7.1 · 108 ″ 0.35 500 -7 -28 28 1.1 · 10 8 0.023 1000 ″ ″ ″ 5.2 · 108 ″ Tensile 0.25 500 -7 -33 16 8.9 · 10 7 0.006 q = 25° 1000 ″ ″ ″ 4.2 · 108 ″ d = 90° 0.3 500 -8 -27 24 5.2 · 10 7 0.03 1000 ″ ″ ″ 2.5 · 108 ″ 0.35 500 -7 -25 24 3.6 · 10 7 0.036 1000 ″ ″ ″ 1.7 · 108 ″
Table 1. Minimum misfit solutions from the Okada grid search for different source mechanisms and medium parameters. q
indicates the strike angle (from north) and d the dip angle (from horizontal) of the crack/fault plane for the dip-slip and tensile crack mechanisms. The locations ΔZ, ΔN and ΔE are relative to station DY3.
This frequency is used to determine the source size (and subsequently the slip D using M0 = mAD,
with the shear modulus m and the source area A): approximating the source as a slipping circular patch (Sato and Hirasawa, 1973; Madariaga, 1976) gives a source radius of approximately 10 m to 20 m with an average slip of 1 mm to 4 mm. As the actual source mechanism cannot be inferred from our data and a tensile component could potentially form part of the source process, we addi-tionally performed the location grid search and source slip analysis for a tensile crack (Table 1). If a purely tensile source mechanism is considered, the slip displacement on the same patch is reduced by a factor of 2, showing the results are robust for a deviation from the pure normal faulting source.
17
Both results are in agreement with Liu-Zeng et al. (2005), who model the slip-to-length ratio and ob-tain equivalent values for small faults with rough fault surfaces.
Figure 6. Source time-function and its amplitude spectrum. A, Normalised source-time history (slip on the fault). B,
Moment-rate spectrum fit with a w2-source model (Brune, 1970). The flat part of the spectrum (left arrow) corresponds to the seismic moment M0, while the corner frequency fc (right arrow) is related to the source size. The results shown are calculated for VP = 500 m/s and n = 0.3 and the source location from Figure 5b. Note that varying n between 0.25 and 0.35 does not affect the corner frequency to a large extent (fc = 4.2 – 5.6 Hz). (Figure modified after Thun et al., 2016).
We estimate stress drops of Ds = 0.008 – 0.07 MPa using Ds = 7 M0 / 16 r3 according to Eshelby
(1957). These values are 2 – 3 orders of magnitude smaller than expected for tectonic seismicity (stress drops typically > 1 MPa; Kanamori and Anderson (1975)) and point to a very weak uppermost crust. They are consistent with the lack of shallow ”standard” earthquakes associated with such a large rifting event. Such small stress drops are in striking agreement with the value of Ds = 0.01 MPa obtained for shallow long period seismicity on Mt Etna, Italy (Bean et al., 2014), attributed to the presence of exceptionally weak near surface volcanic material that could not sustain high shear or tensile stresses and hence also failed at exceptionally low earthquakes magnitudes.
18
1.
4
.4 - Discussion
Our data reveal new information about the rifting process, suggesting that it is at least partially discrete, occurring in micrometre scale steps. This raises questions about how these displacements compare to the observed long-term deformation in the area. Combining the time-history of the clos-est GPS stations with the total graben opening measured from satellite data (see supplementary in-formation), the deformation rate for 30 August 2014 is estimated to be roughly 5 cm/day. Assuming a repeating process with average displacement steps of 133 μm and average inter-event times of 267 s, observed at DY3, we extrapolate our data and obtain an approximate deformation rate of 4.3 cm/day. Furthermore, accumulating normal fault slip estimates at the source of 1mm to 4mm yields a horizontal deformation rate of 7 – 27 cm/day. Although the modelled slip values are approximate, both of our displacement measures are in good agreement with the GPS estimates. The similarity suggests that the satellite and GPS-derived long-term surface deformation associated with Earth sur-face rifting is a consequence of displacement accumulated through very low magnitude discrete brit-tle failure at the millimetre scale. The detection of such steps is limited to distances within a few hundred metres from the source, highlighting the rarity of such observations. The similarity also sug-gests that any aseismic component is small at the spatial and temporal scales captured in this study; it also indicates that fracturing of the weak uppermost crust is limited to microseismic events, con-sistent with the lack of observed shallow seismicity (Sigmundsson et al., 2015; Ágústsdóttir et al., 2016).
We conclude that at its smallest temporal and spatial scales, rifting in the uppermost Earth’s crust is not a steady state process but rather exhibits transient staccato-like behaviour that yields definable spreading rates only when viewed over longer time scales. Stress drop analysis on the dis-crete micro-events reveals that the uppermost crust is exceptionally weak in the rift zone
1.
5
-
Conclusions
Our work shows that the analysis of seismic events can significantly benefit from data recorded in the near- and intermediate-field of their sources. The information contained in the waveforms at short source-receiver distances may in some cases completely change our interpretation of the source process. Furthermore, a careful analysis of broadband seismometer data can help bridge the current gap between seismology and deformation studies, as common methods of displacement de-tection, such as GPS or InSAR do not offer the resolution needed to resolve steps of such small mag-nitude (order of 1-10 μm in our experiments) and short time history. The results from our laboratory experiments show that the detection of static displacements with seismometers is possible - moving median filters can reduce long-period noise on broadband data whilst retaining displacement steps. The performance of this method is limited by the size of the step signal in relation to the long-period noise, but is applied successfully to signals comparable to real-world examples.
Applying our method to data recorded on the summit of Turrialba volcano, Costa Rica, we recov-ered steps associated with LP events; stacks of many events show that this is coherent across many similar events. This shows that even in relatively noisy volcanic environments we can access subtle
19
information, which might fundamentally change our interpretation of underlying source processes. A second application to the seismic events recorded in the immediate vicinity of the graben faults as-sociated with the 2014 Bárðarbunga dyke in Iceland reveals their step-like nature and suggests that these signals are part of the shallow deformation process. We used these steps, together with the tilt steps also observed on the seismograms, to locate the source in a forward modelling approach and found small (𝑀𝑀𝑊𝑊< 0), local sources approximately 30–40 m south-east of the station. The
anal-ysis shows that the uppermost crust in the rift zone is exceptionally weak, with stress drops 2 – 3 or-der of magnitude smaller than expected for tectonic seismicity.
Both field applications highlight how close instruments have to be to the seismic sources in order to detect possible static displacement (and in the case of Bárðarbunga, tilt) steps. As these signals can vastly improve our understanding of source processes, this fact should be taken into considera-tion when designing future seismic experiments on volcanoes.
Acknowledgements
The research presented in this study has received funding from the European Union’s Seventh Programme under Grant No. 289976 (Project NEMOH) and Grant No. 308377 (Project FUTUREVOLC). The field work in Iceland received support from the Geological Survey of Ireland (GSI). Although this paper was compiled by J.T., I.L. and C.J.B., the work on the Bárðarbunga dyke received contributions by E.P.S. Eibl, B.H. Bergsson and A. Braiden, the co-authors of the cited manuscript to be submitted. We would like to thank F. Martini, M. Mora, J. Pacheco (field experiment on Turrialba), T. Ferreira, A. Garcia, F. Heffernan and M. Möllhoff (laboratory experiments) for their support and K. Vogfjörd for input on the Bárðarbunga experiment. We thank B. G. Ofeigsson, who helped estimate the defor-mation rate from the GPS data. Thanks to F. Sigmundsson for the helpful review. Data processing was aided by ObsPy toolbox (Beyreuther et al., 2010).
References
Ágústsdóttir, T. et al. (2016). Strike-slip faulting during the 2014 Bardarbunga-Holuhraun dike intrusion, central Iceland, Geophysical Research Letters 43: 1495–1503, doi: 10.1002/2014GL060519
Aki, K. and Richards, P. G. (2002). Quantitative Seismology, University Science Books.
Amante, C. and Eakins, B.W. (2009). ETOPO1 1 Arc-Minute Global Relief Model: Procedures, Data Sources and Analysis. (report). National Geophysical Data Center, NOAA.
Aoyama, H. and Oshima, H. (2008). Tilt change recorded by broadband seismometer prior to small phreatic ex-plosion of Meakan-dake volcano, Hokkaido, Japan. Geophysical Research Letters 35: L06307, doi: 10.1029/2007GL032988.
Bean, C. J. et al. (2014). Long-period seismicity in the shallow volcanic edifice formed from slow-rupture earth-quakes. Nature Geoscience 7(1): 71–75, doi: 10.1038/ngeo2027.
Brune, J. N. (1970). Tectonic stress and the spectra of seismic shear waves from earthquakes. Journal of Geo-physical Research 75(26): 4997, doi: 10.1029/JB075i026p04997.
Bürgmann, R., Rosen, P. A. and Fielding, E. J. (2000). Synthetic Aperture Radar Interferometry to Measure Earth’s Surface Topography and Its Deformation. Annu Rev Earth Planet Sci 28: 169–209.
Cauchie, L. and Saccorotti, G. (2013). Probabilistic inversion of Rayleigh-wave dispersion data: An application to Mt. Etna, Italy. Journal of Seismology 17(2): 335–346, doi: 10.1007/s10950-012-9323-6.
20
Chanerley, A. A. et al. (2013). Concerning Baseline Errors in the Form of Acceleration Transients When Recover-ing Displacements from Strong Motion Records UsRecover-ing the Undecimated Wavelet Transform. Bulletin of the Seismological Society of America 103(1): 283–295, doi: 10.1785/0120110352.
Chouet, B. (1986). Dynamics of a fluid-driven crack in three dimensions by the finite difference method. Journal of Geophysical Research 91: 13967, doi: 10.1029/JB091iB14p13967.
Chouet, B. (2003). Volcano Seismology. Pure and Applied Geophysics 160(3): 739–788, doi: 10.1007/PL00012556.
Chouet, B. et al. (1998). Shallow velocity structure of Stromboli Volcano, Italy, derived from small-aperture array measurements of Strombolian tremor. Bulletin of the Seismological Society of America 88(3): 653–666. Cusano, P., Petrosino, S. and Saccorotti, G. (2008). Hydrothermal origin for sustained Long-Period (LP) activity at
Campi Flegrei Volcanic Complex, Italy. Journal of Volcanology and Geothermal Research 177(4): 1035– 1044, doi: 10.1016/j.jvolgeores.2008.07.019.
De Barros, L. et al. (2011). Source mechanism of long-period events recorded by a high-density seismic network during the 2008 eruption on Mount Etna. Journal of Geophysical Research 116(B1): B01304, doi: 10.1029/2010JB007629.
DeLuca, G. et al. (1997). Shallow structure of Mt Vesuvius volcano, Italy, from seismic array analysis. Geophysi-cal Research Letters 24(4): 481–484, doi: 10.1029/97GL00169.
Eshelby, J. D. (1957). The Determination of the Elastic Field of an Ellipsoidal Inclusion, and Related Problems. Proceedings of the Royal Society of London A: Mathematical, Physical and Engineering Sciences 241(1226): 376–396.
Eyre, T. S. et al. (2013). Moment tensor inversion for the source location and mechanism of long period (LP) seismic events from 2009 at Turrialba volcano, Costa Rica. Journal of Volcanology and Geothermal Re-search 258: 215–223, doi: 10.1016/j.jvolgeores.2013.04.016.
Eyre, T. S. et al. (2015). A brittle failure model for long-period seismic events recorded at Turrialba Volcano, Cos-ta Rica. Journal of Geophysical Research B: Solid Earth 120(3): 1452–1472, doi: 10.1002/2014JB011108. Ferrazzini, V. and Aki, K. (1987). Slow waves trapped in a fluid-filled infinite crack: Implication for volcanic
trem-or. Journal of Geophysical Research 92(2): 9215, doi: 10.1029/JB092iB09p09215.
Ferrazzini, V., Aki, K. and Chouet, B. (1991). Characteristics of seismic waves composing Hawaiian volcanic trem-or and gas-piston events observed by a near-source array. Journal of Geophysical Research 96(B4): 6199–6209, doi: 10.1029/90JB02781.
Fournier, N., Jolly, A. D. and Miller, C. (2011). Ghost tilt signal during transient ground surface deformation events: Insights from the September 3, 2010 Mw7.1 Darfield earthquake, New Zealand. Geophysical Re-search Letters 38(16): 1–5, doi: 10.1029/2011GL048136.
Geirsson, H. et al. (2012). Volcano deformation at active plate boundaries: Deep magma accumulation at Hekla volcano and plate boundary deformation in south Iceland. Journal of Geophysical Research B: Solid Earth 117(11): 1–18, doi: 10.1029/2012JB009400.
Genco, R. and Ripepe, M. (2010). Inflation-deflation cycles revealed by tilt and seismic records at Stromboli vol-cano. Geophysical Research Letters, 37(12): 1–5, doi: 10.1029/2010GL042925.
Graizer, V. M. (2005). Effect of tilt on strong motion data processing. Soil Dynamics and Earthquake Engineering 25(3): 197–204, doi: 10.1016/j.soildyn.2004.10.008.
Gudmundsson, A. et al. (2014). Dike emplacement at Bardarbunga, Iceland, induces unusual stress changes, cal-dera deformation, and earthquakes. Bulletin of Volcanology 76(10): 1–7, doi: 10.1007/s00445-014-0869-8.
Gudmundsson, M. T. et al. (2016). Gradual caldera collapse at Bárdarbunga volcano, Iceland, regulated by lat-eral magma outflow. Science 353(6296), doi: 10.1126/science.aaf8988.sciencemag.org.