Catalysts 2020, 10, 1184; doi:10.3390/catal10101184 www.mdpi.com/journal/catalysts
Article
Activation Treatments and SiO
2
/Pd Modification of
Sol–Gel TiO
2
Photocatalysts for Enhanced
Photoactivity under UV Radiation
Julien G. Mahy 1,2,*, Valériane Sotrez 2, Ludivine Tasseroul 2, Sophie Hermans 1 and Stéphanie D. Lambert 2
1 Institute of Condensed Matter and Nanosciences (IMCN), Université catholique de Louvain, Place Louis
Pasteur 1, 1348 Louvain-la-Neuve, Belgium; sophie.hermans@uclouvain.be
2 Department of Chemical Engineering—Nanomaterials, Catalysis & Electrochemistry, University of Liège,
B6a, Quartier Agora, Allée du six Août 11, 4000 Liège, Belgium; valeriane.sotrez@gmail.com (V.S.); ludivine.tasseroul@gmail.com (L.T.); stephanie.lambert@uliege.be (S.D.L.)
* Correspondence: julien.mahy@uclouvain.be; Tel.: +32-4-3664771
Received: 3 September 2020; Accepted: 13 October 2020; Published: 14 October 2020
Abstract: The objective of this work is to improve the efficiency of TiO2 photocatalysts by activation
treatments and by modification with palladium nanoparticles and doping with SiO2. The influence
of the additive loading was explored, and two activation treatments were performed: UV exposition and H2 reduction. TiO2/SiO2/Pd photocatalysts were synthesized by an original cogelation method:
a modified silicon alkoxide, i.e., [3-(2-aminoethyl)aminopropyl]trimethoxysilane (EDAS), was used to complex the palladium ions, thanks to the ethylenediamine group, while the alkoxide groups reacted with TiO2 precursors. Pure TiO2 was also synthesized by the sol–gel process for comparison.
X-ray diffraction evidenced that the crystallographic structure of TiO2 was anatase and that Pd was
present, either in its oxidized form after calcination, or in its reduced form after reduction. The specific surface area of the samples varied from 5 to 145 m2 g-1. Transmission electron microscopy
allowed us to observe the homogeneous dispersion and nanometric size of Pd particles in the reduced samples. The width of the band gap for pure TiO2 sample, measured by UV/Visible diffuse
reflectance spectroscopy at approximately 3.2 eV, corresponded to that of anatase. The band gap for the TiO2/SiO2/Pd composite samples could not be calculated, due to their high absorption in visible
range. The photocatalytic activity of the various catalysts was evaluated by the degradation of a methylene blue solution under UV radiation. The results showed that the photocatalytic activity of the catalysts was inversely proportional to the content of silica present in the matrix. A small amount of silica improved the photocatalytic activity, as compared to the pure TiO2 sample. By contrast, a
high amount of silica delayed the crystallization of TiO2 in its anatase form. The activation treatment
under UV had little influence on photocatalytic efficiency. The introduction of Pd species increased the photocatalytic activity of the samples because it allowed for a decrease in the rate of electron– hole recombinations in TiO2. The reduction treatment improved the activity of photocatalysts,
whatever the palladium content, thanks to the reduction of Ti4+ into Ti3+, and the formation of defects
in the crystallographic structure of anatase.
Keywords: TiO2; sol–gel process; SiO2; Pd-modification; activation treatments; photocatalysis
1. Introduction
For decades, different processes have been developed to reduce the current pollution in water, air and soil [1,2]. Among these various methods, photocatalysis had emerged as a potential technique
to degrade organic pollutants [3,4]. Its principle lies on the use of a semiconductor as photocatalyst, which is activated by light illumination. Its activation produces a series of redox reactions leading to radicals’ formation. These radicals can attack organic pollutants and degrade them in CO2 and H2O
if the degradation is complete [3,4].
The most used photocatalyst is TiO2 [5–7]. This material is activated under UV light due to its
band gap around 3.2 eV for the anatase phase [4]. TiO2 presents the advantage of being easily
available, inexpensive and non-toxic. The use of TiO2 as photocatalyst has two main limitations [4]:
(i) the fast charge recombination and (ii) the large band gap value. Indeed, if the recombination of the photo-generated species (electrons, e-, and holes, h+) is fast, the production of radicals is low and the
degradation is less effective. Furthermore, if the band gap is large, the energy required for the electron transfer is high and only UV radiation can be used. This study focused on the improvement of the charge recombination phenomenon.
Regarding the improvement of the recombination time, the major modification of TiO2 materials
is the addition of metallic nanoparticles such as Ag [8–11], Au [12], Pt [12,13] or Pd [8,14]. In this case, the metallic nanoparticle plays the role of electron trap, allowing us to increase the recombination time [9]. Combination with other semiconductors has also been investigated to increase the recombination time [4]. In this case, synergetic effects can be observed leading to a better charge separation or an increased photostability. Different combinations of semiconductors were tested, such as TiO2/ZnO [15], TiO2/CdS [4] or TiO2/ZrO2 [16]. The introduction of SiO2 in the TiO2 matrix can
also enhance the photoactivity due to surface acidity modification, the introduction of defects or increased surface area [9,17]. In order to optimize the modification efficiency, the additive needs to be highly dispersed in the TiO2 matrix. Previous works have reported that a high dispersion of
metallic nanoparticles into a SiO2 and TiO2 matrix can be achieved through the use of a complexing
agent, e.g., ethylenediamine [9,18,19]. Indeed, by using modified silicon alkoxide, small amounts of Ag, Cu or Ni nanoparticles are dispersed in either TiO2 or SiO2. The use of this silicon alkoxide
introduces a SiO2 doping in the TiO2 matrix, and this doping is referenced as effective to increase the
photoactivity [9,17,20].
In this study, TiO2 photocatalyst was modified with Pd species, in order to increase the
photocatalytic property under UV light for the degradation of organic dye. To finely disperse these Pd species, a modified silicon alkoxide (3-(2-aminoethyl) aminopropyl]trimethoxysilane, EDAS) was cogelled with Ti alkoxide. Indeed, this silicon alkoxide possesses an ethylenediamine function able to complex metallic ions; SiO2 was also introduced into the materials. Different amounts were added
to study the influence of SiO2 addition on TiO2 properties. This original preparation method allows
the modification in one step. Four different samples were prepared with four Pd loadings; one pure TiO2 and one TiO2/SiO2 were also prepared for comparison. To further increase the photoefficiency,
two activation treatments were applied to the sample: UV activation and H2 reduction. The
physicochemical properties of the resulting materials were determined thanks to nitrogen adsorption–desorption, X-ray diffraction, inductively coupled plasma optical emission spectroscopy, diffuse reflectance and transmission electron microscopy. The photocatalytic activity was followed on the degradation of methylene blue (MB), under UV-A illumination, during 6 h of reaction. 2. Results and Discussion
Six samples were prepared: one pure titania (named TiO2), one titania doped with silica (named
TiO2/SiO2) and four titania samples doped with silica and modified with Pd named TiO2/SiO2/PdX,
where X corresponds to the theoretical wt.% of Pd and can vary between 1, 5, 12 and 22 wt.% of Pd. Table 1 summarizes the amounts of reactants for each sample. The weight amount of SiO2 is in the
same range as Pd. The UV-treated samples are denoted with “- UV”, while those reduced under H2
are denoted with “-H2”.
2.1. Colors and Compositions of Photocatalytic Samples
The pure and TiO2/SiO2 samples had a white color, characteristic of TiO2 and SiO2 materials. The
increased. The brown color is characteristic of PdO material. The samples, after UV activation, kept their initial coloration, while after H2 reduction, the Pd-modified ones became black, which is
characteristic of metallic palladium. The pictures of the samples are shown in Supplementary Materials Figure S1.
The actual loading (measured by ICP) is given in Table 1 and was close to the theoretical one, calculated on the basis of the engaged amounts. In each composite sample, the amount of SiO2 is
similar to the amount of Pd, as expected.
Table 1. Synthesis operating variables and additive loadings determined by ICP. Sample nSolvent (mmol) nPd (mmol) nEDAS (mmol) nTIPT (mmol) nWater (mmol) Gelification time (min) Theoretical loading SiO2/Pd (wt.%) Actual loading SiO2/Pd (wt.%) Pure TiO2 1830 - - 91.5 183 9 - - TiO2/SiO2 1830 - 6.88 84.6 180 8 5.8/0 4.9/0 TiO2/SiO2/Pd1 1830 0.69 1.38 90.1 182 > 60 0.98/1 1.2/1.1 TiO2/SiO2/Pd5 1830 3.44 6.88 84.6 180 40 4.9/5 4.7/4.2 TiO2/SiO2/Pd12 1830 8.60 17.20 74.3 174 > 60 11.76/12 12.9/12.2 TiO2/SiO2/Pd22 1830 17.4 34.90 56.6 166 > 60 21.56/22 24.6/21.8
nSolvent = amount of 2-methoxyethanol; nPd = amount of palladium acetylacetate; nEDAS = amount of
EDAS; nTIPT = amount of TIPT; nWater = amount of water.
2.2. Crystallinity
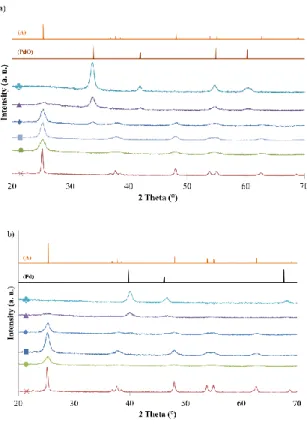
The XRD patterns of all calcined samples are presented in Figure 1a. For pure TiO2 sample, the
characteristic peaks of TiO2 anatase were detected (JCPDS 21-1272: 25.3°, 37.9°, 48.0°, 54.6°, 62.8° and
68.8°). When additive was added, the intensity of anatase peaks decreased and even disappeared for TiO2/SiO2/Pd22 sample. For the samples modified with Pd, additional peaks appeared at 34°, 42°,
54.9° and 60.3° (JCPDS 75-584), which corresponded to palladium oxide. The intensity of these peaks increased with the amount of Pd (Figure 1a).
Figure 1. (a) XRD patterns of calcined samples: (×) pure TiO2, (●) TiO2/SiO2, (█) TiO2/SiO2/Pd1, (♦)
samples: (×) pure TiO2 – H2, (●) TiO2/SiO2 – H2, (█) TiO2/SiO2/Pd1 – H2, (♦) TiO2/SiO2/Pd5 – H2, (▲)
TiO2/SiO2/Pd12 – H2 and (♣) TiO2/SiO2/Pd22 – H2. (A) Reference pattern of anatase, (PdO) reference
pattern of palladium oxide and (Pd) reference pattern of palladium.
After UV activation, no modification of the crystallinity was observed (XRD patterns identical to Figure 1a, not shown). Contrarily, after H2 reduction (Figure 1b), the peaks of metallic palladium
(JCPDS 87-0638: 39.8°, 46.2° and 67.6°) were observed replacing those of palladium oxide, as expected. Concerning the crystallite size evaluated by using the Scherrer equation, the TiO2 crystallites
(dXRDTi) decreased with the additive content: from 34 nm for pure TiO2 to 7 nm for TiO2/SiO2/Pd12
calcined sample (Table 2). For the PdO crystallites (dXRDPdO, for the calcined samples), they increased
with the amount of Pd: from 8 nm for TiO2/SiO2/Pd5 to 25 nm for TiO2/SiO2/Pd22 sample. The metallic
Pd nanoparticles (dXRDPd for the reduced samples) had a slightly smaller size than PdO crystallites
(Table 2).
The decrease of the TiO2 crystallinity can be explained by the introduction of SiO2 in the TiO2
matrix. Indeed, silica was introduced by the EDAS, which was used to disperse Pd in the TiO2 matrix.
The introduction of silica delayed the crystallization of TiO2 [9,21,22], leading to amorphous TiO2 for
the sample with the highest content of SiO2 (TiO2/SiO2/Pd22 sample).
There was no modification of the crystallite sizes, both for TiO2 and PdO, for all UV-activated
samples (Table 2). For the H2 reduced samples, as explained above, the PdO species are convert in Pd
species and the evolution of TiO2 crystallite follows the evolution of the non-reduced samples. Table 2. Samples’ crystalline, textural and optical properties.
Sample dXRDTi (nm) ± 1 dXRDPdO (nm) ± 1 dXRDPd (nm) ± 1 SBET (m2 g-1) ± 5 VDR (cm3 g-1) ± 0.01 VP (cm3 g-1) ± 0.1 dTEMTi (nm) ± 5 dTEMPdO (nm) ± 4 dTEMPd (nm) ± 4 Eg (eV) ± 0.01 Pure TiO2 34 -b -b < 5 - 0.04 25 -b -b 3.17 Pure TiO2 - H2 34 -b -b < 5 - 0.04 -a -b -b 3.16 Pure TiO2 - UV 34 -b -b < 5 - 0.04 25 -b -b 3.25 TiO2/SiO2 8 -b -b 100 0.04 0.2 10 -b -b 3.25 TiO2/SiO2 - H2 10 -b -b 145 0.06 0.4 -a -b -b 3.23 TiO2/SiO2 - UV 8 -b -b 100 0.04 0.2 10 -b -b 3.27 TiO2/SiO2/Pd1 19 -c -b 40 0.02 0.1 18 -c -b -d TiO2/SiO2/Pd1 - H2 25 -b -c 60 0.02 0.2 -a -b -c -d TiO2/SiO2/Pd1 - UV 19 -c -b 40 0.02 0.1 18 -c -b -d TiO2/SiO2/Pd5 11 8 -b 45 0.02 0.2 12 8 -b -d TiO2/SiO2/Pd5 - H2 11 -b 17 60 0.02 0.2 -a -b 10 -d TiO2/SiO2/Pd5 - UV 10 8 -b 45 0.02 0.2 12 9 -b -d TiO2/SiO2/Pd12 7 17 -b 20 0.01 0.6 10 12 -b -d TiO2/SiO2/Pd12 - H2 6 -b 9 25 0.01 0.4 -a -b 11 -d
TiO2/SiO2/Pd12 - UV 7 17 -b 20 0.01 0.6 10 12 -b -d TiO2/SiO2/Pd22 -b 25 -b 45 0.02 0.4 -b 14 -b -d TiO2/SiO2/Pd22 - H2 -b -b 12 100 0.05 0.1 -b -b 11 -d TiO2/SiO2/Pd22 - UV -b 25 -b 45 0.02 0.4 -b 14 -b -d
-a , not measured; -b, not present; -c, not detectable; -d, unmeasurable; dXRDTi, mean diameter of TiO2
crystallites measured by the Scherrer method; dXRDPdO, mean diameter of PdO crystallites measured
by the Scherrer method; dXRDPd, mean diameter of Pd crystallites measured by the Scherrer method;
SBET, specific surface area determined by the BET method; VDR, specific micropore volume determined
by Dubinin–Raduskevitch theory; VP, specific liquid volume adsorbed at the saturation pressure of
nitrogen; dTEMTi, mean diameter of TiO2 nanoparticles measured by TEM; dTEMPdO, mean diameter of
PdO nanoparticles measured by TEM; dTEMPd, mean diameter of Pd nanoparticles measured by TEM;
Eg, optical band-gap values calculated by using the transformed Kubelka–Munk function.
2.3. Morphology
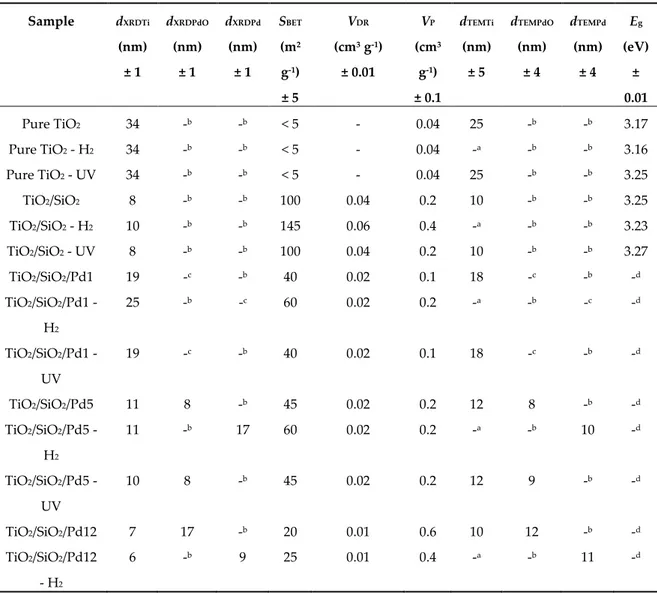
The nitrogen adsorption–desorption isotherms are presented in Figure 2a for all calcined samples. Pure TiO2 and all Pd-modified TiO2 samples were non-porous solids with a very low surface
area (SBET < 50 m2 g-1, Table 2). Only TiO2/SiO2 sample was a mesoporous solid (type IV isotherm [23])
with a hysteresis between 0.4 and 0.6 in relative pressure. Indeed, the introduction of sol–gel silica increases in the TiO2 leads to more porous solid [22]. The Pd modification seemed to have low
influence on the texture of the samples.
After H2 reduction (Figure 2b), the SBET increased for all samples (Table 2). Indeed, some
remaining organic contaminants could be removed by this thermal treatment, leading to an increase of the microporosity (VDR increased in the majority of the reduced samples, Table 2).
The UV activation had no influence on the textural properties (nitrogen adsorption–desorption isotherms identical to Figure 2a, not shown).
Figure 2. Nitrogen adsorption–desorption isotherms of (a) calcined samples and (b) reduced samples.
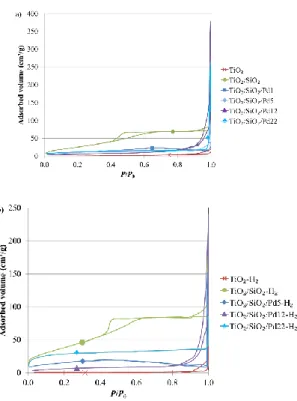
The samples were observed by TEM, as shown in Figure 3, for four representative samples. The estimation of the different sizes of particles (TiO2, PdO and Pd) are given in Table 2. The TiO2
nanoparticles (dTEMTi) were observed in the size range of 10–18 nm for all samples doped with SiO2
(Figure 3a–d). For TiO2/SiO2/Pd22 sample, no TiO2 crystallite was observed in the matrix, confirming
the amorphous TiO2/SiO2 materials. For pure TiO2, the size was around 25 nm. This result was
coherent with the XRD patterns (Figure 1) where crystallization delays were obtained with SiO2
doping [9,21]. For the Pd-modified ones, darker nanoparticles highly dispersed in the TiO2/SiO2
matrix were observed which corresponded to the PdO (calcined samples) or Pd (reduced samples) nanoparticles (Figure 3b–d). The Pd species were highly dispersed in the oxide matrix, thanks to the use of EDAS [24,25]. When the amount of Pd became too high, the size of the nanoparticles increased (dTEMPdO and dTEMPd, Table 2). Indeed, the palladium species were closer to each other, leading to
sintering when the samples were heated. The size of PdO and metallic Pd was quite similar for all samples, before and after H2 reduction (Table 2). The UV activation treatment had no influence on
the size of the materials.
The XRD crystallite sizes and the nanoparticle sizes estimated with TEM, for the Pd and PdO species, were in the same range. The small differences result from the fact that the crystallites sizes determined by XRD correspond to the average diameter in volume of crystallites. Therefore, XRD gives more statistical significance to large particles, compared to TEM.
Figure 3. TEM micrographs of calcined and reduced samples: (a) TiO2/SiO2, (b) TiO2/SiO2/Pd5 - H2,
(c) TiO2/SiO2/Pd12-H2 and (d) TiO2/SiO2/Pd22.
2.4. Optical Properties
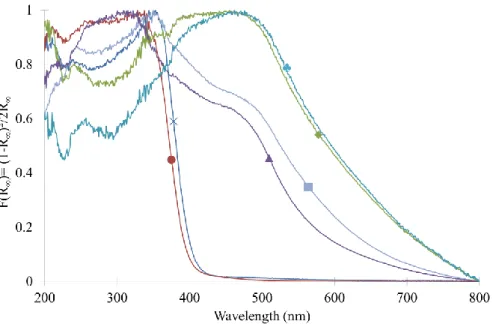
The diffuse reflectance UV/Visible spectra of the calcined samples are presented in Figure 4. The pure TiO2 and TiO2/SiO2 samples had the characteristic spectrum of titania materials with absorption
in UV range from around 400 nm. The Pd-modified samples had a larger band of absorption in the UV/Visible region due to the presence of the PdO nanoparticles. As the reduced samples were black, they were not analyzed with this technique. The band gap can be calculated only for the pure TiO2
and TiO2/SiO2 samples, and is given in Table 2. For both samples, values around 3.2 eV were found
Figure 4. Normalized diffuse reflectance UV/Visible spectra of all calcined samples: (×) pure TiO2, (●)
TiO2/SiO2, (█) TiO2/SiO2/Pd1, (♦) TiO2/SiO2/Pd5, (▲) TiO2/SiO2/Pd12 and (♣) TiO2/SiO2/Pd22.
2.5. Photocatalytic Activity
The evolution of the MB concentration during the photocatalytic experiments is given in Figure 5 for all samples. For each sample, curves obtained with samples treated by both UV and H2 are also
represented. No photolysis of MB was observed under illumination without catalyst (blank experiment). Thanks to the dark experiments, the adsorption of MB on the samples without illumination was deduced from the observed decrease of MB concentration, under illumination, to measure only the MB degradation.
Figure 5. Methylene blue (MB) concentration evolution ([MB]/[MB]0 ratio) over time (6 h) for all
sample series under UV-A illumination: (a) pure TiO2, (b) TiO2/SiO2, (c) TiO2/SiO2/Pd1, (d)
TiO2/SiO2/Pd5, (e) TiO2/SiO2/Pd12 and (f) TiO2/SiO2/Pd22. The contribution of MB adsorption was
subtracted for all samples.
For samples without palladium (pure TiO2 and TiO2/SiO2), the H2 reduction treatment did not
seem to have much influence on the percentage of MB degradation, while the activation treatment under UV seemed to improve it slightly for the pure TiO2 sample, and even more for TiO2/SiO2
sample. For samples with low palladium content (TiO2/SiO2/Pd1 and TiO2/SiO2/Pd5 samples), the
opposite phenomenon was observed: Activation under UV seemed to decrease the photoactivity, while H2 reduction greatly improved it for the TiO2/SiO2/Pd1 sample and slightly more for the
TiO2/SiO2/Pd5 and TiO2/SiO2/Pd12 samples. The TiO2/SiO2/Pd22 sample had a low photocatalytic
activity, regardless of the treatment, due to its amorphous nature (Figure 1). The MB conversion for all the samples is given in Table 3, together with the percentage of MB adsorption.
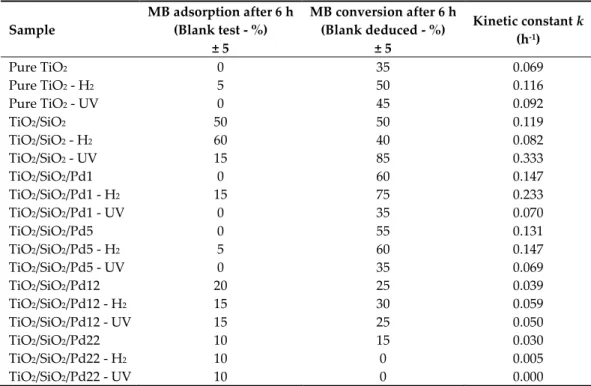
Table 3. Photocatalytic experiments for MB degradation after 6 h, under UV-A illumination.
Sample MB adsorption after 6 h (Blank test - %) ± 5 MB conversion after 6 h (Blank deduced - %) ± 5 Kinetic constant k (h-1) Pure TiO2 0 35 0.069 Pure TiO2 - H2 5 50 0.116 Pure TiO2 - UV 0 45 0.092 TiO2/SiO2 50 50 0.119 TiO2/SiO2 - H2 60 40 0.082 TiO2/SiO2 - UV 15 85 0.333 TiO2/SiO2/Pd1 0 60 0.147 TiO2/SiO2/Pd1 - H2 15 75 0.233 TiO2/SiO2/Pd1 - UV 0 35 0.070 TiO2/SiO2/Pd5 0 55 0.131 TiO2/SiO2/Pd5 - H2 5 60 0.147 TiO2/SiO2/Pd5 - UV 0 35 0.069 TiO2/SiO2/Pd12 20 25 0.039 TiO2/SiO2/Pd12 - H2 15 30 0.059 TiO2/SiO2/Pd12 - UV 15 25 0.050 TiO2/SiO2/Pd22 10 15 0.030 TiO2/SiO2/Pd22 - H2 10 0 0.005 TiO2/SiO2/Pd22 - UV 10 0 0.000
The pure TiO2 samples had very low MB adsorption by opposition to TiO2/SiO2 samples. This
difference could come from the textural properties of the TiO2/SiO2 samples, which presented higher
SBET values, as compared to pure TiO2 samples (< 5 vs. 100–145 m2 g-1, Table 2). The Pd-modified
samples presented SBET values between pure TiO2 and TiO2/SiO2 samples (~ 40 m2 g-1,Table 2), so their
TiO2/SiO2/Pd12 series, which adsorbed around 20%. The MB adsorption was therefore directly linked
to the surface properties of the samples [27].
On the one hand, the photoactivity of TiO2 was increased by the introduction of a small amount
of silica into its network [9,28]. The TiO2/SiO2/Pd1 sample degraded 60% of MB against 35% for the
pure TiO2 sample (Table 3). On the other hand, when the quantity of silica introduced became too
large, the crystallization of TiO2 in its anatase form was delayed [21]. Thus, in the samples containing
a large amount of palladium (TiO2/SiO2/Pd5, TiO2/SiO2/Pd12 and TiO2/SiO2/Pd22), and therefore a
large amount of silica, photocatalytic efficiency decreased: We obtained 60% MB degradation for the TiO2/SiO2/Pd1 sample against 15% MB degradation for the TiO2/SiO2/Pd22 sample (Table 3). In all
cases, except for the TiO2/SiO2/Pd22 sample, which contains only amorphous TiO2, the H2 reduction
treatment had the effect of increasing the photocatalytic activity. Indeed, H2 reduction allowed us to
decrease the rate of recombination of the “electron–hole” pairs present in TiO2 via two distinct
phenomena: (i) The first was the possible creation of oxygen vacancies on the surface of TiO2 by
reduction of Ti4+ ions to Ti3+ [29,30], and (ii) the second was the reduction of PdO particles to metallic
palladium acting as an electron trap and thus limiting the recombination’s of the “electron–hole” pairs [31,32]. Activation processing under UV, on the other hand, has little influence on the photocatalytic activity of calcined samples.
The optimal sample is TiO2/SiO2/Pd1, which combines the advantages of both additives (SiO2
and Pd) with a weight loading percentage of 1% for each. Indeed, the introduction of SiO2 allows us
to increase the specific surface area, as compared to pure TiO2 (Table 2), while the crystallinity of
anatase is maintained (Figure 1). Moreover, Pd introduction allows an absorption in the visible range (Figure 4).
Assuming that the photocatalyst is homogeneously dispersed in a perfectly agitated medium, the derivative of the material balance in a semi-continuous reactor can be expressed as follows [33]:
𝑑𝐶 𝑑𝑡 = −𝑟𝑉
𝑚𝑐𝑎𝑡𝑎,0 𝑉0
(1) where C is the concentration of methylene blue in the solution (kmol/m³), t is the time (h), rV is the
specific rate of the degradation of methylene blue (kmol/kgcatalyst.h), mcata,0 is the initial catalyst mass
homogeneously dispersed in the solution (kg of catalyst) and V0 is the initial solution volume (m³).
In general, the degradation curves of methylene blue in photocatalysis had an exponential appearance. The degradation kinetics of methylene blue could then be modeled by assuming that the reaction was of order 1 under the operating conditions used. The kinetic equation could thus be expressed as follows:
𝑑𝐶
𝑑𝑡 = −𝑘 × 𝐶 × 𝑚𝑐𝑎𝑡𝑎,0
𝑉0 (2)
where k is the kinetic constant (m³/kgcatalyst h).
As part of this work, the photocatalytic activity of the samples was evaluated in media containing 50 mg of catalysts dispersed in 50 mL of MB solution at 20 μmol/L concentration. The mcata,0/V0 ratio was thus equal to 1. The kinetic equation could then be developed as follows:
𝑑𝐶 𝑑𝑡 = −𝑘 × 𝐶 (3) 𝑑𝐶 𝐶 = −𝑘 × 𝑑𝑡 (4) ln (𝐶 𝐶0 ) = −𝑘 × 𝑡 (5) 𝐶 = 𝐶0× 𝑒−𝑘 × 𝑡 (6)
where C0 is the initial MB concentration in the solution (kmol/m³).
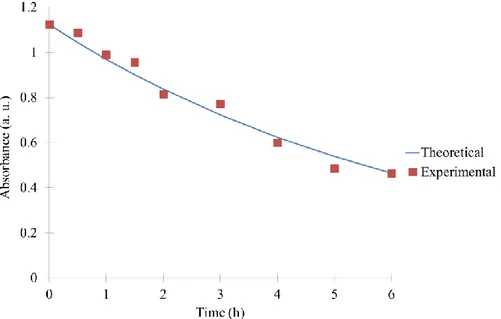
Figure 6 compares the theoretical kinetic model to the experimental values for the TiO2/SiO2/Pd1
sample. The two curves superimposed perfectly, justifying the hypothesis of an order 1 kinetics of degradation.
Equation (6) is commonly found in the literature [34,35] for photocatalytic process. Knowing the evolution over time of the concentration of methylene blue in the solutions, the kinetic constant, k, could be calculated for all samples. The values obtained are listed in Table 3.
The evolution of the kinetic constants values corresponds to the observations made previously. Indeed, the kinetic constant, k, was increased by the introduction of a small quantity of silica into the TiO2 network: The TiO2/SiO2/Pd1 sample had a kinetic constant equal to 0.147 h-1 versus 0.069 h-1 for
the pure TiO2 sample (Table 3). On the other hand, when the quantity of silica introduced became too
large, the crystallization of TiO2 in its anatase form was delayed [9,21]. Thus, in samples containing a
large amount of palladium (TiO2/SiO2/Pd5, TiO2/SiO2/Pd12 and TiO2/SiO2/Pd22 samples), and
therefore a large quantity of silica, the kinetic constant decreased, i.e., 0.147 h-1 for the TiO2/SiO2/Pd1
sample, as compared to 0.030 h-1 for the TiO2/SiO2/Pd22 sample. In all cases (except for the sample
TiO2/SiO2/Pd22, which contained only amorphous TiO2), the H2 reduction treatment had the
consequence of increasing the kinetic constant of the samples. Activation processing under UV had little influence on the kinetic constant of the calcined samples.
Figure 6. Kinetic analysis of the MB degradation for TiO2/SiO2/Pd1 sample: (-) theoretical evolution
and (█) experimental points.
With the combination of Pd/SiO2 modification and the reduction of the photocatalyst, the
photoactivity for the degradation of MB can be greatly increase compared to the pure material. Moreover, the use of modified silicon alkoxide allowed a good distribution of the metal in the titania matrix. This cogelation synthesis method appears as an easy process for homogeneous doping in titania photocatalysts.
3. Materials and Methods
3.1. Photocatalyst Synthesis
The pure and modified TiO2 samples were prepared by a sol–gel cogelation method inspired
from Reference [21]. The steps were the following: Palladium acetylacetonate (Pd(acac)2, Sigma
Aldrich, 99%) was dissolved in 2-methoxyethanol (Sigma Aldrich, 99.8%); then 3-(2-aminoethyl) aminopropyl]trimethoxysilane (EDAS, Merck, 97%) was added to the solution and stirred for 1 h, for complexation. The resulting solution became yellow. Then titanium isopropoxide (TIPT, Sigma Aldrich, 98%) was added, under stirring. In a second vial, distilled water was mixed with 2-methoxyethanol. This second solution was added, dropwise, to the first one, in 5 min, under stirring. The resulting suspension was placed in an oven, for gelation, at 80 °C, for 72 h. Then, the gel was dried under vacuum at 80 °C for 48 h, until the pressure fell at 1000 Pa. At this pressure, the
temperature was increased to 150 °C for 24 h. The dried powder was crushed with a mortar and calcined at 550 °C for 5 h.
Six samples were prepared with the following protocol: one pure TiO2 (without Pd(acac)2 and
EDAS), one TiO2/SiO2 (without Pd(acac)2) and four TiO2/SiO2/Pd samples (1, 5, 12 and 22 theoretical
wt.% of Pd). Table 1 summarizes the amounts of reactants for each sample: the weight amount of SiO2 is in the same range as Pd in all cases.
3.2. Activation Treatments
In order to increase the photoactivity of the samples, they underwent two different activation treatments after calcination: UV activation and H2 reduction.
Concerning the UV activation, the calcined powder was mixed in 50 mL of distilled water, in a Petri dish that was illuminated for 24 h, under stirring, at 25 °C. The lamp (Osram Sylvania, Blacklight-Bleu Lamp, F18W/BLB-T8) emitted UV-A radiation considered to be monochromatic, with a wavelength of 365 nm and an intensity of 1.2 mW/cm2. After the UV treatment, the photocatalyst
was filtered and dried for 24 h, at 120 °C. The UV-treated samples are denoted with “- UV”.
Concerning the H2 reduction, the calcined powder was heated under H2, for 5 h, at 450 °C. The
reduced samples are denoted with “- H2”. 3.3. Characterizations
The nitrogen adsorption–desorption isotherms were obtained thanks to a Fisons Sorptomatic 1900 device. The specific surface area, SBET, the microporous volume, VDR, and the porous volume, VP,
were obtained from the isotherms, thanks to BET and Dubinin–Raduskevic theories [23].
The crystallographic phases were determined with a Siemens D5000 device, by measurements between 20° and 70°, with a step size of 0.05° and a step time of 5 s. The crystallite size was estimated thanks to the Scherrer equation [36].
The atomic composition of the samples was determined by inductively coupled plasma atomic emission spectrometry (ICP-AES), with an ICAP 6500 device from Thermo Scientific. Before introducing the sample in the device, it was mineralized as follows: 75 mg of sample was mixed with 1.6 g of Li2B4O7 and 0.4 g of Li3BO3 in a graphitic crucible. Then it was heated to 1000 °C for 5 min.
After cooling, the pearl was dissolved, under stirring, in hot HNO3 2 M.
The sample suspensions were observed with transmission electron microscopy (TEM), using a Phillips CM 100 device (accelerating voltage 200 kV). The average nanoparticle size was estimated by measuring approximatively 100 nanoparticles with the TEM software.
Optical properties of the sample materials in the range of 200–800 nm region were obtained with diffuse reflectance measurements on a Varian Cary 500 UV–Vis-NIR spectrophotometer equipped with an integrating sphere (Varian External DRA-2500), and using BaSO4 as reference. The
absorbance spectra were transformed by using the Kubelka–Munk function [37–39] to produce a signal, normalized for comparison between samples, allowing us to calculate the band gap (Eg). The
details of this treatment method are widely described elsewhere [40–42].
3.4. Photocatalytic Activity on Methylene Blue Degradation
The photoactivity of the samples was determined by following the methylene blue (MB) degradation, under UV-A illumination. The lamp (Osram Sylvania, Blacklight-Bleu Lamp, F18W/BLB-T8) emitted UV-A radiation considered as monochromatic, with a wavelength of 365 nm and an intensity of 1.2 mW/cm2 (same as for the UV activation, section 3.2). A scheme of similar
installation was presented in Reference [43].
Then, 50 mL of MB solution with a concentration of 20 µmol/L was mixed with the photocatalyst (1 g/L). The suspension was illuminated for 6 h, at a constant temperature of 25 °C, under UV-A illumination. The concentration of MB was followed by recording UV/VIS spectrum between 300 and 800 nm with GENESYS 105 UV-VIS spectrophotometer from Thermo Scientific. A calibration curve was made to link the absorbance to the concentration. Aliquots were taken every 30 min during the
first 2 h of the experiment, and then each hour, until a total of 6 h. Each sample was tested 3 times to obtain mean degradation values; the variation on the sample concentration was around 5%. Blank experiment without photocatalyst was also performed to ensure that MB did not undergo photobleaching under UV-A illumination. Dark tests without illumination were performed to assess the MB adsorption on the samples.
4. Conclusions
In this study, TiO2 photocatalysts were cogelled with silicon alkoxide, in order to finely disperse
Pd species in TiO2 matrix and dope them with SiO2; these modifications were made in one step during
the synthesis. This Pd modification was made in order to increase the photoefficiency on methylene blue degradation. Two activation treatments were also performed in the same goal: UV activation and H2 reduction. A pure and a mixed TiO2/SiO2 sample were also synthesized as reference.
Results showed that the crystallographic structure of TiO2 is the anatase phase and that Pd is
present either in its oxidized form after the calcination stage, or in its reduced form after the reduction stage. The introduction of SiO2 delayed the crystallization of TiO2, leading to amorphous TiO2
material when the highest Pd loading (22 wt.%) was produced. The specific surface area of the samples, determined by nitrogen adsorption–desorption, varied from 5 to 145 m2 g-1, with the highest SBET value obtained after H2 reduction treatment. Transmission electron microscopy allowed us to
observe the homogeneous dispersion and nanometric size of Pd particles in the reduced samples. The size of Pd crystallites increased with the Pd amount. The band gap measured by UV/Visible diffuse reflectance spectroscopy corresponded to that of the TiO2 anatase, approximately 3.2 eV for the pure
and SiO2 doped TiO2. The band gaps for Pd-modified samples were not determined due to the dark
color of the samples and the high absorption in the UV/Visible range. The UV activation did not modify the physicochemical properties of the samples, and it had little effect on photocatalytic activity of calcined samples.
The photoactivity of TiO2 was increased by the introduction of a small amount of silica into its
network. However, when the quantity of silica introduced became too large, the crystallization of TiO2 in its anatase form was delayed, and the photocatalytic activity of samples decreased. The
introduction of Pd in the samples also increased the photoactivity. Moreover, the H2 reduction
treatment further increased the photocatalytic activity of the samples, because this treatment allowed us to decrease the rate of electron–hole recombination in TiO2 via two distinct phenomena: (i) the
creation of oxygen vacancies on the surface of TiO2 by reduction of Ti4+ ions to Ti3+; (ii) the reduction
of PdO particles to palladium metallic nanoparticles acting as an electron trap and thus limiting the electron–hole recombination. The optimal loading is 1 wt.% for each (SiO2 and Pd) additive.
Supplementary Materials: The following are available online at www.mdpi.com/2073-4344/10/10/1184/s1, Figure S1. Pictures of the calcined samples: from left to right: pure TiO2, TiO2/SiO2, TiO2/SiO2/Pd1,
TiO2/SiO2/Pd5, TiO2/SiO2/Pd12 and TiO2/SiO2/Pd22.
Author Contributions: Conceptualization, methodology, investigation, analysis and writing, V.S., T.S., J.G.M. and S.D.L.; writing—original draft preparation, J.G.M., S.H. and S.D.L.; supervision, funding acquisition and project administration, S.H. and S.D.L. All the authors corrected the paper before submission and during the revision process. All authors have read and agreed to the published version of the manuscript.
Funding: This research received no external funding.
Acknowledgments: S.D.L. thanks the Belgian National Funds for Scientific Research (F.R.S.-FNRS) for her Associate Researcher position. The authors acknowledge the Ministère de la Région Wallonne Direction Générale des Technologies, de la Recherche et de l’Energie (DGO6), the Fonds de Bay and the Fonds de Recherche Fondamentale et Collective for financial support. J.G.M. and S.H. also thank Innoviris Brussels for financial support through the Bridge project—COLORES.
References
1. Pignatello, J.J.; Oliveros, E.; MacKay, A. Advanced oxidation processes for organic contaminant destruction based on the fenton reaction and related chemistry. Crit. Rev. Environ. Sci. Technol. 2006,
36, 1–84.
2. Kuyukina, M.S.; Ivshina, I.B. Application of Rhodococcus in Bioremediation of Contaminated Environments. In Biology of Rhodococcus; Alvarez, H., Ed.; Springer: Berlin/Heidelberg, Germany, 2010; pp. 231–262, ISBN 9783642129377.
3. Linsebigler, A.L.; Lu, G.; Yates, J.T. Photocatalysis on TiO2 Surfaces: Principles, Mechanisms, and
Selected Results. Chem. Rev. 1995, 95, 735–758.
4. Pelaez, M.; Nolan, N.T.; Pillai, S.C.; Seery, M.K.; Falaras, P.; Kontos, A.G.; Dunlop, P.S.M.; Hamilton, J.W.J.; Byrne, J.A.; O’Shea, K.; et al. A review on the visible light active titanium dioxide photocatalysts for environmental applications. Appl. Catal. B: Environ. 2012, 125, 331–349.
5. Oseghe, E.O.; Ofomaja, A.E. Study on light emission diode/carbon modified TiO2 system for
tetracycline hydrochloride degradation. J. Photochem. Photobiol. A: Chem. 2018, 360, 242–248.
6. Mahy, J.G.; Paez, C.A.; Carcel, C.; Bied, C.; Tatton, A.S.; Damblon, C.; Heinrichs, B.; Wong Chi Man, M.; Lambert, S.D. Porphyrin-based hybrid silica-titania as a visible-light photocatalyst. J. Photochem.
Photobiol. A: Chem. 2019, 373, 66–76.
7. Banerjee, S.; Dionysiou, D.D.; Pillai, S.C. Self-cleaning applications of TiO2 by photo-induced
hydrophilicity and photocatalysis. Appl. Catal. B: Environ. 2015, 176, 396–428.
8. Espino-Estévez, M.R.; Fernández-Rodríguez, C.; González-Díaz, O.M. Effect of TiO2—Pd and TiO2—
Ag on the photocatalytic oxidation of diclofenac , isoproturon and phenol. Chem. Eng. J. 2016, 298, 82– 95.
9. Léonard, G.L.-M.; Malengreaux, C.M.; Mélotte, Q.; Lambert, S.D.; Bruneel, E.; Van Driessche, I.; Heinrichs, B. Doped sol-gel films vs. powders TiO2: On the positive effect induced by the presence of
a substrate. J. Environ. Chem. Eng. 2016, 4, 449–459.
10. Tunc, I. The effect of the presence of Ag nanoparticles on the photocatalytic degradation of oxalic acid adsorbed on TiO2 nanoparticles monitored by ATR-FTIR. Mater. Chem. Phys. 2014, 144, 444–450.
11. Bodson, C.J.; Heinrichs, B.; Tasseroul, L.; Bied, C.; Mahy, J.G.; Wong Chi Man, M.; Lambert, S.D. Efficient P- and Ag-doped titania for the photocatalytic degradation of waste water organic pollutants.
J. Alloy. Compd. 2016, 682, 144–153.
12. Vaiano, V.; Iervolino, G.; Sannino, D.; Murcia, J.J.; Hidalgo, M.C.; Ciambelli, P.; Navío, J.A. Photocatalytic removal of patent blue V dye on Au—TiO2 and Pt—TiO2 catalysts. Appl. Catal. B:
Environ. 2016, 188, 134–146.
13. Borzyszkowska, A.F.; Stepnowski, P.; Ofiarska, A.; Pieczynska, A.; Siedlecka, E.M. Pt—TiO2-assisted
photocatalytic degradation of the cytostatic drugs ifosfamide and cyclophosphamide under artificial sunlight. Chem. Eng. J. 2016, 285, 417–427.
14. Abdelaal, M.Y.; Mohamed, R.M. Novel Pd/TiO2 nanocomposite prepared by modified sol-gel method
for photocatalytic degradation of methylene blue dye under visible light irradiation. J. Alloy. Compd. 2013, 576, 201–207.
15. Léonard, G.L.-M.; Pàez, C.A.; Ramírez, A.E.; Mahy, J.G.; Heinrichs, B. Interactions between Zn2+ or
ZnO with TiO2 to produce an efficient photocatalytic, superhydrophilic and aesthetic glass. J.
Photochem. Photobiol. A: Chem. 2018, 350, 32–43.
16. Mahy, J.G.; Lambert, S.D.; Tilkin, R.G.; Poelman, D.; Wolfs, C.; Devred, F.; Gaigneaux, E.M.; Douven, S. Ambient temperature ZrO2-doped TiO2 crystalline photocatalysts : Highly efficient powders and
films for water depollution. Mater. Today Energy 2019, 13, 312–322.
17. Chen, Q.; Shi, W.; Xu, Y.; Wu, D.; Sun, Y.; Si, A. Visible-light-responsive Ag—Si codoped anatase TiO2
photocatalyst with enhanced thermal stability. Mater. Chem. Phys. 2011, 125, 825–832.
18. Pirard, S.L.; Mahy, J.G.; Pirard, J.-P.; Heinrichs, B.; Raskinet, L.; Lambert, S.D. Development by the sol-gel process of highly dispersed Ni—Cu/SiO2 xerogel catalysts for selective 1,2-dichloroethane
hydrodechlorination into ethylene. Microporous Mesoporous Mater. 2015, 209, 197–207.
19. Belet, A.; Wolfs, C.; Mahy, J.G.; Poelman, D.; Vreuls, C. Sol-Gel Syntheses of Photocatalysts for the Removal of Pharmaceutical Products in Water. Nanomaterials 2019, 9(1), 126.
20. Yang, J.; Xu, X.; Liu, Y.; Gao, Y.; Chen, H.; Li, H. Preparation of SiO2@TiO2 composite nanosheets and
their application in photocatalytic degradation of malachite green at emulsion interface. Colloids Surf.
A: Physicochem. Eng. Asp. 2019, 582, 123858.
21. Braconnier, B.; Páez, C.A.; Lambert, S.; Alié, C.; Henrist, C.; Poelman, D.; Pirard, J.P.; Cloots, R.; Heinrichs, B. Ag- and SiO2-doped porous TiO2 with enhanced thermal stability. Microporous
Mesoporous Mater. 2009, 122, 247–254.
22. Bodson, C.J.; Lambert, S.D.; Alié, C.; Cattoën, X.; Pirard, J.; Bied, C.; Wong Chi Man, M.; Heinrichs, B. Effects of additives and solvents on the gel formation rate and on the texture of P- and Si-doped TiO2
materials. Microporous Mesoporous Mater. 2010, 134, 157–164.
23. Lecloux, A.J. Texture of Catalysts. In Catalysis: Science and Technology; Anderson, J.R., Boudart, M., Eds.; Springer: Berlin/Heidelberg, Germany, 1981; Volume 2, pp. 171–230.
24. Mahy, J.G.; Claude, V.; Sacco, L.; Lambert, S.D. Ethylene polymerization and hydrodechlorination of 1,2-dichloroethane mediated by nickel(II) covalently anchored to silica xerogels. J. Sol-Gel Sci. Technol. 2017, 81, 59–68.
25. Lambert, S.; Cellier, C.; Grange, P.; Pirard, J.P.; Heinrichs, B. Synthesis of Pd/SiO2, Ag/SiO2, and
Cu/SiO2 cogelled xerogel catalysts: Study of metal dispersion and catalytic activity. J. Catal. 2004, 221,
335–346.
26. Khaki, M.R.D.; Shafeeyan, M.S.; Raman, A.A.A.; Daud, W.M.A.W. Application of doped photocatalysts for organic pollutant degradation-A review. J. Environ. Manag. 2017, 198, 78–94. 27. Yukselen, Y.; Kaya, A. Suitability of the methylene blue test for surface area, cation exchange capacity
and swell potential determination of clayey soils. Eng. Geol. 2008, 102, 38–45.
28. Calleja, G.; Serrano, D.P.; Sanz, R.; Pizarro, P. Mesostructured SiO2-doped TiO2 with enhanced thermal
stability prepared by a soft-templating sol-gel route. Microporous Mesoporous Mater. 2008, 111, 429–440. 29. Zhang, Z.; Long, J.; Xie, X.; Zhuang, H.; Zhou, Y.; Lin, H.; Yuan, R.; Dai, W.; Ding, Z.; Wang, X.; et al. Controlling the synergistic effect of oxygen vacancies and N dopants to enhance photocatalytic activity of N-doped TiO2 by H2 reduction. Appl. Catal. A: Gen. 2012, 425–426, 117–124.
30. Páez, C.A.; Lambert, S.D.; Poelman, D.; Pirard, J.P.; Heinrichs, B. Improvement in the methylene blue adsorption capacity and photocatalytic activity of H2-reduced rutile-TiO2caused by Ni(II)porphyrin
preadsorption. Appl. Catal. B: Environ. 2011, 106, 220–227.
31. Liu, H.; Ma, H.T.; Li, X.Z.; Li, W.Z.; Wu, M.; Bao, X.H. The enhancement of TiO2 photocatalytic activity
by hydrogen thermal treatment. Chemosphere 2003, 50, 39–46.
32. Tong, H.-x.; Chen, Q.-y.; Yin, Z.-l.; Hu, H.-p.; Wu, D.-x; Yang, Y.-h. Preparation, characterization and photo-catalytic behavior of WO3-TiO2 catalysts with oxygen vacancies. Trans. Nonferrous Met. Soc.
China 2009, 19, 1483–1488.
33. Pirard, S.L.; Malengreaux, C.M.; Toye, D.; Heinrichs, B. How to correctly determine the kinetics of a photocatalytic degradation reaction? Chem. Eng. J. 2014, 249, 1–5.
34. Arabatzis, I.M.; Stergiopoulos, T.; Andreeva, D.; Kitova, S.; Neophytides, S.G.; Falaras, P. Characterization and photocatalytic activity of Au/TiO2 thin films for azo-dye degradation. J. Catal.
2003, 220, 127–135.
35. Fisher, M.B.; Keane, D.A.; Fernández-Ibáñez, P.; Colreavy, J.; Hinder, S.J.; McGuigan, K.G.; Pillai, S.C. Nitrogen and copper doped solar light active TiO2 photocatalysts for water decontamination. Appl.
Catal. B: Environ. 2013, 130–131, 8–13.
36. Patterson, A.L. The Scherrer Formula for X-Ray Particle Size Determination. Phys. Rev. 1939, 56, 978– 982.
37. Malengreaux, C.M.; Douven, S.; Poelman, D.; Heinrichs, B.; Bartlett, J.R. An ambient temperature aqueous sol–gel processing of efficient nanocrystalline doped TiO2-based photocatalysts for the
degradation of organic pollutants. J. Sol-Gel Sci. Technol. 2014, 71, 557–570.
38. Kubelka, P. Ein Beitrag zur Optik der Farban striche. Z Tech. Phys. 1931, 12, 593–601.
39. Kubelka, P. New contributions to the optics of intensely light-scattering materials. J. Opt. Soc. Am. 1948,
38, 448–457.
40. Mahy, J.G.; Lambert, S.D.; Léonard, G.L.-M.; Zubiaur, A.; Olu, P.-Y.; Mahmoud, A.; Boschini, F.; Heinrichs, B. Towards a large scale aqueous sol-gel synthesis of doped TiO2: Study of various metallic
dopings for the photocatalytic degradation of p-nitrophenol. J. Photochem. Photobiol. A: Chem. 2016, 329, 189–202.
41. Mahy, J.G.; Cerfontaine, V.; Poelman, D.; Devred, F.; Gaigneaux, E.M.; Heinrichs, B.; Lambert, S.D. Highly efficient low-temperature N-doped TiO2 catalysts for visible light photocatalytic applications.
Materials. 2018, 11, 584.
42. Malengreaux, C.M.; Pirard, S.L.; Léonard, G.; Mahy, J.G.; Herlitschke, M.; Klobes, B.; Hermann, R.; Heinrichs, B.; Bartlett, J.R. Study of the photocatalytic activity of Fe3+, Cr3+, La3+ and Eu3+ single-doped
and co-doped TiO2 catalysts produced by aqueous sol-gel processing. J. Alloy. Compd. 2017, 691, 726–
738.
43. Tasseroul, L.; Pirard, S.L.; Lambert, S.D.; Páez, C.A.; Poelman, D.; Pirard, J.P.; Heinrichs, B. Kinetic study of p-nitrophenol photodegradation with modified TiO2 xerogels. Chem. Eng. J. 2012, 191, 441–
450.
Publisher’s Note: MDPI stays neutral with regard to jurisdictional claims in published maps and institutional affiliations.
© 2020 by the authors. Licensee MDPI, Basel, Switzerland. This article is an open access article distributed under the terms and conditions of the Creative Commons Attribution (CC BY) license (http://creativecommons.org/licenses/by/4.0/).