The XMM-Newton view of the X-ray spectrum of
WR140 across periastron passage
Micha¨el De Becker
1,2, Julian M. Pittard
3, Peredur M. Williams
4for the WR140 consortium
1Department of Astrophysics, Geophysics and Oceanography, University of Li`ege, Belgium
2 Observatoire de Haute-Provence, Saint-Michel l’Observatoire, France
3 Department of Physics and Astronomy, University of Leeds, UK
4Institute for Astronomy, Royal Observatory, Edinburgh, UK
Abstract: An XMM-Newton campaign dedicated to the study of the X-ray emission of the colliding wind massive binary WR140 across its 2009 periastron passage has been undertaken. The high quality EPIC spectra revealed a strong phase-locked variability both in flux and in spectral shape. The observed variations are consistently explained by the varying emission measure of the emitting plasma along the eccentric orbit, and by the changing absorption column density along the line of sight. Our results are first interpreted in the context of simple multi-temperature thermal emission models, and prospects for more sophisticated modelling are discussed.
1
Scientific context
WR 140 (HD 193793, HIP 100287) is undoubtedly one of the most studied WR+O massive binaries. It is a long period system (7.9 yr) consisting of a WC7 + O5 pair (Williams et al. 2009). This system turns out to be an especially relevant astrophysical laboratory for the study of colliding stellar winds. First, radio observations of this system revealed a non-thermal nature of its spectrum pointing to its capability to accelerate particles up to relativistic energies (e.g. Williams, van der Hucht & Spoel-stra 1994, White & Becker 1995, Dougherty et al. 2005). Second, the wind-wind interaction region of WR 140 is known to be a nucleation site for dust particles (Monnier, Tuthill & Danchi 2002). Finally, previous soft X-ray observations (ASCA: Koyama et al. 1994, Zhekov & Skinner 2000; Chandra: Pol-lock et al. 2005) revealed a strong thermal emission spectrum dominated by the hot plasma expected to be present in such a colliding wind massive binary. Until recently, visibility constraints prevented any observations of WR 140 with the highly sensitive XMM-Newton satellite. This paper presents some first results obtained in the framework of the XMM-Newton campaign devoted to this target, especially across its periastron passage that motivated a multi-wavelength/multi-observatory effort among the massive star community (see Williams 2011 for a review).
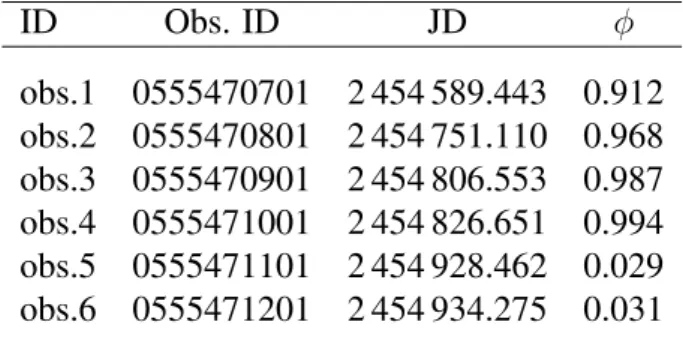
Table 1: Journal of observations. The columns include respectively the number of the observation in our series, the observation identifier, the Julian date at mid exposure, and the orbital phase as computed from the ephemeris of Marchenko et al. (2003).
ID Obs. ID JD φ obs.1 0555470701 2 454 589.443 0.912 obs.2 0555470801 2 454 751.110 0.968 obs.3 0555470901 2 454 806.553 0.987 obs.4 0555471001 2 454 826.651 0.994 obs.5 0555471101 2 454 928.462 0.029 obs.6 0555471201 2 454 934.275 0.031
2
XMM-Newton observations
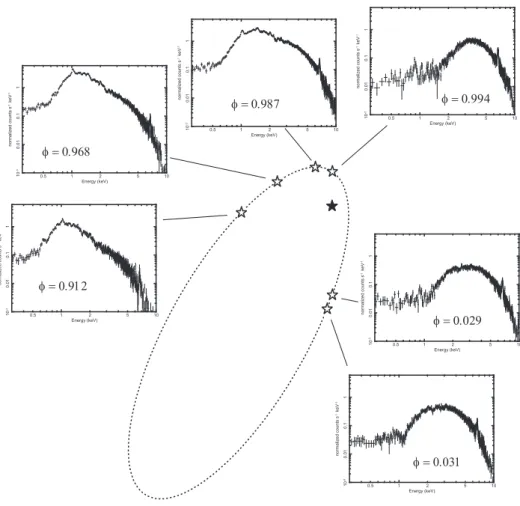
XMM-Newton observed WR 140 six times in AO7, across its 2009 periastron passage, with exposure times of 20 ks (proposal ID055547). Unfortunately, pointing constraints of the satellite did not allow us to observe the target at periastron. The aim-point was set to the position of the target in order to obtain simultaneously high resolution RGS spectra. For EPIC instruments, we used the thick filter to reject optical light. Data were processed with SASv8.0. We extracted the events from the sources and the background separately, using spatial filters devoid of any detectable point source. For details on the data set and on the reduction procedure, we refer to De Becker et al. (2011). EPIC-MOS1 spectra are shown in Fig. 1.
3
General X-ray properties and broadband spectral variability
We fitted various composite models prepared with the XSPEC software (v.12.5.1)1 to spectra from
every observation. The models were made using different components for the X-ray emission and for the absorption in order to represent the observed spectra between 0.3 and 10.0 keV. We achieved a good description of the X-ray spectrum of WR 140 using a 3-T thermal emission model with varying abundances, along with photoelectric absorption components representing the interstellar and wind absorption. Best-fit parameters were obtained for a model of the following form:
tbabs*(vphabs*vapec+vphabs*vapec+vphabs*vapec)
where tbabs is a model for the interstellar extinction taking into account updated abundances, along with the impact of hydrogen molecules and dust particles (Wilms, Allen & McCray 2000). We fixed
the interstellar hydrogen column density to a value of 0.59 × 1022cm−2(see Pollock et al. 2005), but
we left the local absorbing columns as free parameters. The plasma temperatures have values of the order of 5, 15 and 50 MK. We note that even though some spectra of the series could at first sight be fitted by a 2-T model, we refrained to do so mainly for one reason: we adopted the same model for the complete time series in order to discuss consistently the variability of the X-ray spectrum, and this could not be done with a heterogenous modelling. Our results point to a significant overabundance in C, in agreement with the WC type of the primary (see De Becker et al. 2011 for a more detailed discussion). This approach provides a rather good representation of the X-ray emission and of its phase-locked variability (see De Becker et al. 2011), but a more appropriate modelling of the X-ray
1 10 0.5 2 5 10 -3 0.01 0.1 1 normalized counts s -1 keV -1 Energy (keV) 1 10 0.5 2 5 10 -3 0.01 0.1 1 normalized counts s -1 keV -1 Energy (keV) 1 10 0.5 2 5 10 -3 0.01 0.1 1 normalized counts s -1 keV -1 Energy (keV) φ = 0.994 φ = 0.029 φ = 0.031 1 10 0.5 2 5 10 -3 0.01 0.1 1 normalized counts s -1 keV -1 Energy (keV) 1 10 0.5 2 5 10 -3 0.01 0.1 1 normalized counts s -1 keV -1 Energy (keV) φ = 0.912 1 10 0.5 2 5 10 -3 0.01 0.1 1 normalized counts s -1 keV -1 Energy (keV) φ = 0.968 φ = 0.987
Figure 1: Variability of the EPIC-MOS X-ray spectrum (between 0.3 and 10.0 keV) of WR 140 as a function of the orbital phase. The spectra are identified with the projected positions of the O5 star (open symbols) at the phases of the observations in its orbit around the WR star (filled symbol) projected on the sky.
emission is in preparation.
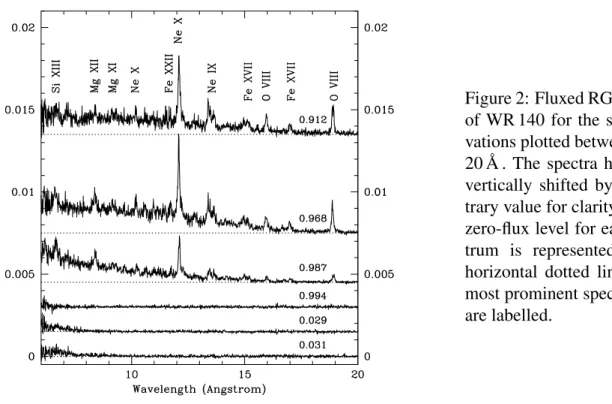
On the other hand, RGS data reveal several spectral lines, including the dominating Ne X Lyα line, along with the rather strong He-like triplet of Ne IX (see Fig. 2). The global shape of the RGS spectrum changes significantly along the orbit, with the most striking variation observed when the wind-wind interaction region is occulted by the dense WC wind: starting from phase 0.994, the X-rays are almost completely absorbed. A net increase in the line strength is observed when approaching periastron, in agreement with the expected increase of the emission measure. This is especially obvi-ous for instance when looking at the Ne X Lyα line, going from phase 0.912 to 0.968.
4
Phase-locked variability interpretation
We measured the count rates in different energy bands in order to investigate in more detail the variability of WR 140 in X-rays. The count rate in the hard part of the spectrum (mostly unaffected by absorption) has its maximum close to periastron. This is interpreted in terms of variations of the emission measure of the emitting plasma, that changes along the eccentric orbit. In the soft part of the spectrum, the variations are at least qualitatively interpreted as the result of a competition between an emission measure effect (as the separation, D, of the WR and O5 stars varies as a function of the orbital phase) and an orientation effect (as the line of sight crosses absorbing material with changing
Figure 2: Fluxed RGS spectra of WR 140 for the six obser-vations plotted between 6 and
20 ˚A . The spectra have been
vertically shifted by an arbi-trary value for clarity, and the zero-flux level for each spec-trum is represented by the horizontal dotted lines. The most prominent spectral lines are labelled.
column density as a function of the orbital phase). Such measurements constitute valuable constraints for models currently in development aiming at a good 3-dimensional description of the physics of the colliding winds in WR140 (Parkin et al. 2011, and future developments).
Figure 3: Variation of the local column den-sitites as a function of the orbital phase. The values obtained from our simple modelling fit quite well the expected trend for WR140 illus-trated by the two curves, calculated following an integration through the WC wind to a source moving along the eccentric orbit (see equations A16 and A17 in Williams et al. 1990). Orbital parameters from Marchenko et al. (2003) were used.
The stellar winds have reached their terminal velocity before colliding, so to first order the plasma temperature is expected to be constant with orbital phase (in fact, there will be small changes in the pre-shock velocities due to the expansion and contraction of the system (see, e.g. Pittard & Parkin 2010), plus possible changes near periastron due to increased cooling). We therefore assume that the global shape of the unabsorbed spectrum is constant, with variations in (i) the total emission measure due to the varying orbital separation, and (ii) the wind absorption. We fixed the ratio of the vapec normalization parameters, and we fixed the temperatures to the best fit values (along with the element abundances). The evolution of the normalization parameter of the first emission component shows that emission measure does not follow the 1/D trend expected for adiabatic cases (Stevens, Blondin & Pollock 1992). On the other hand, the absorbing column densities could be plotted to check their evolution as a function of the orbital phase, in order to be confronted to the expected trend described for instance by Williams et al. (1990). Fig. 3 shows that we find a fairly good agree-ment between the measured quantities and the expected ones, though ultimately the spectra should be
compared against more realistic models (e.g. Pittard & Parkin 2010).
5
Concluding remarks
At this stage of the analysis, we can formulate the following conclusions:
1. The XMM-Newton spectra obtained across periastron passage reveal a spectacular phase-locked variability, qualitatively explained in terms of varying emission measure and absorbing wind column densities.
2. The unabsorbed X-ray flux does not follow the simple 1/D trend expected for a self-similar adiabatic wind-wind collision region.
3. This first approach is severely limited by the capabilities of the simple models we used. Dedi-cated opacity tables have been prepared to improve the modelling of the absorption by the wind material (in progress).
4. In order to describe adequately the X-ray emission from WR 140, state-of-the-art models which are as realistic as possible are needed. Such models will have to deal with the 3D hydrodynam-ics and radiative transfer as a function of the orbital phase (e.g. Pittard 2009), and take into account more detailed physics such as non-equilibrium ionization, or the possible feedback of particle acceleration on shock properties.
Acknowledgements
Financial support from FRS-FNRS and XMM/INTEGRAL PRODEX contracts is acknowledged by MDB. Our thanks go also to the Science Operation Center (SOC) team for the scheduling of the XMM-Newton observations.
References
De Becker M. et al. 2011, A&A, in preparation
Dougherty, S.M., Beasley, A.J., Claussen, M.J., Zauderer, B.A., & Bolingbroke, N.J. 2005, ApJ, 623, 447 Koyama K., Maeda Y., Tsuru T., Nagase F., Skinner S. 1994, PASJ, 46, L93
Marchenko S., Moffat A.F.J., Ballereau D. et al. 2003, ApJ, 596, 1295 Monnier J.D., Tuthill P.G. & Danchi W.C. 2002, ApJ, 567, L137
Parkin E.R., Pittard J.M., Corcoran M.F., Hamaguchi K., Stevens I.R., Gosset E., Rauw G., & De Becker M. 2011, in Proceedings of the 39th Li`ege Astrophysical Colloquium, eds. G. Rauw, M. De Becker, Y. Naz´e, J.-M. Vreux & P. Williams, BSRSL, 80, 610
Pittard J.M. 2009, MNRAS, 396, 1743
Pittard J.M. & Parkin E.R. 2010, MNRAS, 403, 1657
Pollock A.M.T., Corcoran M.F., Stevens I.R., & Williams P.M. 2005, ApJ, 629, 482 Stevens I.R., Blondin J.M. & Pollock A.M.T, 1992, ApJ, 386, 265
White R.L. & Becker R.H. 1995, ApJ, 451, 352
Williams P.M., van der Hucht K.A., Pollock A.M.T., Florkowski D.R., van der Woerd H., Wamsteker W. M. 1990, MNRAS, 243, 662
Williams P.M., van der Hucht K.A., & Spoelstra T.A.T. 1994, A&A, 291, 805 Williams P.M., Marchenko S.V., Marston A.P. et al. 2009, MNRAS, 395, 1749
Williams P.M. 2011, in Proceedings of the 39th Li`ege Astrophysical Colloquium, eds. G. Rauw, M. De Becker, Y. Naz´e, J.-M. Vreux & P. Williams, BSRSL, 80, 595
Wilms J., Allen A. & McCray R. 2000, ApJ, 542, 914 Zhekov S.A. & Skinner S.L. 2000, ApJ, 538, 808


