Université de Montréal
Magnetic resonance imaging of resting cerebral oxygen
metabolism - applications in Alzheimer’s disease
par Isabelle Lajoie
Département de Pharmacologie et Physiologie de l’Université de Montréal
Faculté de Médecine
Thèse présentée
en vue de l’obtention du grade de Philosophiæ Doctor (Ph.D.) en Génie Biomédical
Février, 2017
Résumé
Le contraste BOLD employé dans les études d’imagerie par résonance magnétique fonctionnelle (IRMf) provient d’une combinaison ambigüe de changements du flux sanguin cérébral, du volume sanguin ainsi que du métabolisme oxydatif. Dans un contexte où les fonctions vasculaires ou métaboliques du cerveau ont pu être affectées, tel qu’avec l’âge ou certaines maladies, il est crucial d’effectuer une décomposition du signal BOLD en composantes physiologiquement plus spécifiques. La dernière génération de méthodes d’IRMf calibrée permet d’estimer à la fois le flux sanguin cérébral et le métabolisme oxydatif au repos. Le présent travail est basé sur une telle technique, appelée QUantitative O2 (QUO2), qui, via un model généralisé, prend en considération les changements du flux sanguin ainsi que ceux en concentrations sanguine d’O2 durant des périodes d’hypercapnie et d’hyperoxie, afin d’estimer, à chaque voxel, la fraction d’extraction d’oxygène et le métabolisme oxydatif au repos. Dans la première partie de cette thèse, le protocole d’acquisition ainsi que la stratégie d’analyse de l’approche QUO2 ont été revus afin d’améliorer la stabilité temporelle des réponses BOLD et du flux sanguin, conséquemment, afin d’accroître la fiabilité des paramètres estimés. Par la suite, une évaluation de la variabilité intra- et inter-sujet des différentes mesures QUO2 a été effectuée auprès d’un groupe de participants sains. En parallèle, une analyse de la sensibilité du model à différentes sources d’erreurs aléatoires (issues des mesures acquises) et systématiques (dues aux assomptions du model) a été réalisée. De plus, les impacts du niveau d’oxygène administré durant les périodes d’hyperoxie ont été évalués via une simulation puis expérimentalement, indiquant qu’une hyperoxie moyenne était bénéfique. Finalement, l’influence de la maladie d’Alzheimer sur les changements vasculaires et métaboliques a été explorée pour la première fois en appliquant le protocole QUO2 à une cohorte de patients Alzheimer et à un groupe témoin du même âge. Des différences en terme de flux sanguin, fraction d’oxygène extraite, métabolisme oxydatif, et taux de relaxation transverse R2* au repos comme en réponse à l’hypercapnie, ont été identifiées au niveau du voxel, ainsi qu’au niveau de régions cérébrales vulnérables à la maladie d’Alzheimer. Une liste de limitations accompagnées de recommandations a été dressée en ce qui a trait au temps
de transit différé, aux artéfacts de susceptibilité magnétique, de même qu’au défi que représente l’hypercapnie chez les personnes âgées ou atteintes de la maladie d’Alzheimer.
Mots-clés : IRMf calibré, hyperoxie, hypercapnie, exactitude et précision, métabolisme
oxydatif au repos, fraction d’extraction d’oxygène, flux sanguin cérébral, santé vasculaire et métabolique, maladie d’Alzheimer
Abstract
The BOLD contrast employed in functional MRI studies is an ambiguous signal composed of changes in blood flow, blood volume and oxidative metabolism. In situations where the vasculature and metabolism may have been affected, such as in aging and in certain diseases, the dissociation of the more physiologically-specific components from the BOLD signal becomes crucial. The latest generation of calibrated functional MRI methods allows the estimation of both resting blood flow and absolute oxygen metabolism. The work presented here is based on one such proof-of-concept approach, dubbed QUO2, whereby taking into account, within a generalized model, both arbitrary changes in blood flow and blood O2 content during a combination of hypercapnia and hyperoxia breathing manipulations, yields voxel-wise estimates of resting oxygen extraction fraction and oxidative metabolism. In the first part of this thesis, the QUO2 acquisition protocol and data analysis were revisited in order to enhance the temporal stability of individual blood flow and BOLD responses, consequently improving reliability of the model-derived estimates. Thereafter, an assessment of the within and between-subject variability of the optimized QUO2 measurements was performed on a group of healthy volunteers. In parallel, an analysis was performed of the sensitivity of the model to different sources of random and systematic errors, respectively due to errors in measurements and choice of assumed parameters values. Moreover, the various impacts of the oxygen concentration administered during the hyperoxia manipulation were evaluated through a simulation and experimentally, indicating that a mild hyperoxia was beneficial. Finally, the influence of Alzheimer’s disease in vascular and metabolic changes was explored for the first time by applying the QUO2 approach in a cohort of probable Alzheimer’s disease patients and age-matched control group. Voxel-wise and region-wise differences in resting blood flow, oxygen extraction fraction, oxidative metabolism, transverse relaxation rate constant R2* and R2* changes during hypercapnia were identified. A series of limitations along with recommended solutions was given with regards to the delayed transit time, the susceptibility artifacts and the challenge of performing a hypercapnia manipulation in cohorts of elderly and Alzheimer’s patients.
Keywords: calibrated fMRI, hyperoxia, hypercapnia, accuracy and precision, resting
oxidative metabolism, oxygen extraction fraction at rest, cerebral blood flow, vascular and metabolism health, Alzheimer’s disease
Table of Contents
Résumé ... i Abstract ... iii Table of Contents ... v List of tables... ix List of figures ... xAbbreviations and acronyms ... xi
Acknowledgments ... xiv
1. Introduction ... 1
1.1. Positron emission tomography in AD ... 1
1.2. Magnetic resonance imaging in AD ... 2
1.3. Calibrated MRI: task-related changes of CMRO2 ... 4
1.4. Baseline CMRO2 ... 5
1.5. QUO2: Quantitative O2 ... 6
1.6. The present thesis work ... 7
2. Regional Reproducibility of BOLD Calibration Parameter M, OEF and Resting-State CMRO2 Measurements with QUO2 MRI ... 10
2.1. Preface ... 11
2.2. Abstract ... 12
2.3. Introduction ... 13
2.4. Materials and Methods ... 15
2.4.1. Respiratory Manipulation ... 15
2.4.2. Image Acquisition ... 16
2.4.3. Respiratory Data Analysis ... 17
2.4.4. Imaging Data Analysis ... 18
2.4.5. Statistical Analysis ... 21
2.4.7. Precision of QUO2 model-derived estimates - sensitivity to random errors ... 23
2.5. Results ... 24
2.5.1. Gas manipulations ... 24
2.5.2. Exclusion of non-parenchymal or artifact voxels ... 26
2.5.3. T1 shortening ... 27
2.5.4. Detection rate of solutions in ROI ... 27
2.5.5. Test and retest group-averaged metrics across ROIs ... 28
2.5.6. Comparison of all tests averaged between ROIs ... 29
2.5.7. ROI reproducibility analysis ... 31
2.5.8. Parametric maps ... 37
2.5.9. Accuracy of group GM-averaged values - sensitivity to systematic errors ... 39
2.5.10. Precision of group GM-averaged values - sensitivity to random errors ... 41
2.6. Discussion ... 43
2.6.1. Regional inter- and intra-subject reproducibility ... 44
2.6.2. Accuracy of group GM-averaged values - sensitivity to systematic errors ... 45
2.6.3. Precision of group GM-averaged values - sensitivity to random errors ... 46
2.6.4. QUO2 qualitative individual and group maps reproducibility ... 47
2.6.5. Potential QUO2 accuracy and precision improvement ... 47
2.7. Acknowledgments ... 49
3. The Impact of Inspired Oxygen Levels on Calibrated fMRI Measurements of M, OEF and Resting CMRO2 using Combined Hypercapnia and Hyperoxia ... 49
3.1. Preface ... 49
3.2. Abstract ... 50
3.3. Introduction ... 51
3.4. Materials and Methods ... 53
3.4.1. Respiratory Paradigm ... 54
3.4.2. Image Acquisition ... 54
3.4.3. Respiratory Data Analysis ... 55
3.4.5. Analysis of sensitivity of model-derived QUO2 values to change in O2 concentration ... 57 3.4.6. Statistical analysis ... 58 3.5. Results ... 59 3.5.1. Gas manipulation ... 59 3.5.2. Susceptibility artifacts ... 60 3.5.3. T1 shortening ... 62
3.5.4. Analysis of sensitivity of model-derived QUO2 values to change in O2 concentration ... 63
3.5.5. Protocol-averaged estimates in ROIs ... 64
3.5.6. Within-subject variability in ROIs ... 66
3.5.7. Parametric maps ... 67
3.6. Discussion ... 69
3.7. Acknowledgments ... 71
4. Application of calibrated fMRI in Alzheimer’s disease ... 71
4.1. Preface ... 72 4.2. Abstract ... 73 4.3. Introduction ... 74 4.4. Methodology ... 75 4.4.1. Participants ... 75 4.4.2. Data Acquisition ... 77 4.4.3. Data Analysis ... 78 4.4.4. Statistical Analysis ... 80 4.5. Results ... 82 4.5.1. Participant demography ... 82 4.5.2. Susceptibility Artifacts ... 82
4.5.3. Delayed Arterial Transit Time ... 82
4.5.4. Patients Versus Healthy Control Subjects ... 84
4.6. Discussion ... 90
4.6.2. Limitations ... 93
4.7. Conclusion ... 96
4.8. Acknowledgments ... 96
5. General discussion ... 97
5.1. Future directions ... 98
5.2. Additional data and future analyses ... 100
5.3. Conclusion ... 102
List of tables
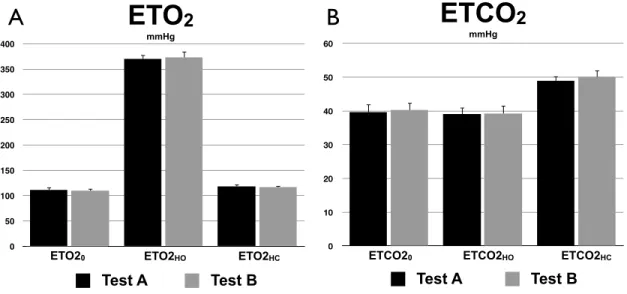
Table 2.I. End-tidal measurements ... 25
Table 2.II. Exclusion of non-parenchymal or artifact voxels ... 27
Table 2.III. Detection rate of solutions in ROI (%) ... 27
Table 2.IV. Reproducibility of QUO2 measurements in different ROI ... 31
Table 2.V. Literature values of M, OEF and resting CMRO2 ... 44
Table 4.I. Demographic and clinical data for each group ... 82
List of figures
Figure 1.1. The Quantitative O2 (QUO2) approach ... 6
Figure 2.1. Regions of interest (ROIs) ... 21
Figure 2.2. Gas manipulations ... 25
Figure 2.3. Exclusion of non-parenchymal or artifact voxels ... 26
Figure 2.4. Test and retest group-averaged metrics across ROIs ... 29
Figure 2.5. Comparison of all tests averaged between ROIs ... 30
Figure 2.6. ROI analysis of within- and between-subject reproducibility ... 33
Figure 2.7. ROI analysis of individual reproducibility - Correlation plots ... 35
Figure 2.8. ROI analysis of individual reproducibility - Bland-Altman graphs ... 36
Figure 2.9. Group maps ... 38
Figure 2.10. Individual OEF and M maps ... 39
Figure 2.11. Accuracy of group GM-averaged values - sensitivity to systematic errors ... 40
Figure 2.12. Precision of group GM-averaged values - sensitivity to random errors ... 42
Figure 3.1. Gas manipulations ... 60
Figure 3.2. Susceptibility artifacts ... 61
Figure 3.3. T1 shortening ... 62
Figure 3.4. Analysis of sensitivity to O2 concentration ... 64
Figure 3.5. Protocol-averaged estimates in ROIs ... 65
Figure 3.6. Within-subject variability in ROIs ... 66
Figure 3.7. Parametric maps ... 68
Figure 4.1. Participant retention ... 76
Figure 4.2. Bias in occipital lobe due to delayed arterial transit time (ATT) ... 83
Figure 4.3. Gas manipulations ... 84
Figure 4.4. Volume of the brain analyzed ... 87
Abbreviations and acronyms
AC Anterior cingulate
AD Alzheimer’s disease
APOE Apolipoprotein E
APP Amyloid precursor protein
ASL/pCASL/de-pCASL Arterial spin labeling/Pseudo-continuous ASL/dual-echo pCASL
ATT Arterial transit time
BET Brain extraction tool
BOLD Blood oxygen level-dependent
CaO2 Arterial content of O2
CBF Cerebral blood flow
CBV Cerebral blood volume
CMRO2 Cerebral metabolic rate of O2
CNR Contrast to noise ratio
CO2 Carbon dioxide
CR Coefficient of repeatability
CV/wsCV/bsCV Coefficient of variance/Within-subject CV/Between-subject CV
CVR Cerebrovascular reactivity
EPI Echo planar imaging
ETO2/ETCO2 End-tidal O2/CO2 concentration
FAST FMRIB’s automated segmentation tool
FDG Fluoro-D-glucose
FI Fixed-inspired
FLAIR Fluid attenuated inversion recovery fMRI Functional magnetic resonance imaging
FSL FMRIB Software Library
FWHM Full width at half maximum
GCM Generalized calibration model
GLM General linear model
GM Grey matter
GRAPPA Generalized autocalibrating partially parallel acquisition
GRE Gradient echo
Hb/dHb Hemoglobin/Deoxyhemoglobin
HC/HO Hypecapnia/Hyperoxia
HIP Hippocampus
HRF Hemodynamic response function
IP Inferior parietal
LHO/HHO Lower/Higher hyperoxia
M Maximal possible BOLD signal change
MCI Mild cognitive impairment
MDD Minimum detectable difference
MMSE Mini-Mental State
MoCa Montreal Cognitive Assessment
MPRAGE Magnetization prepared rapid gradient echo
MRI Magnetic resonance imaging
O2 Oxygen
OEF Oxygen extraction fraction
PaO2/PaCO2 Arterial partial pressure of O2/CO2
PC Posterior cingulate
PD Proton density
PET Positron emission tomography
PLD Post-labeling delay
PRE Precuneus
qBOLD Quantitative BOLD
QUIXOTIC Quantitative imaging of extraction of oxygen and tissue
QUO2 Quantitative O2
ROI Region-of-interest
RSN Resting-state network
R2* Transverse relaxation rate constant SD/wsSD Standard deviation/Within-subject SD SNR (temporal) Signal-to-noise ratio
SP Superior parietal
SWI Susceptibility-weighted imaging
T Tesla
T1 Longitudinal relaxation time
T2/T2* Transverse relaxation time
TE Echo time
TR Repetition time
tSNR Temporal signal-to-noise ratio
VaD Vascular dementia
WM White matter
Acknowledgments
J’aimerais d’abord remercier mon directeur de recherche, Rick, pour m’avoir offert cette opportunité d’apprendre et de travailler dans un domaine des plus stimulants. Merci pour la confiance placée en moi, pour les conseils scientifiques et pour cette touche humoristique qui aura adouci les différentes épreuves rencontrées.
Merci à Claudine et Felipe de m’avoir transmis une partie de leurs connaissances et de leur passion pour la recherche. Un merci tout spéciale à Felipe, qui aura été pour moi un mentor durant ces années de collaboration.
Un énorme merci à Anne-Marie, Lucile et Michel, dont le travail exceptionnel de coordination et d’assurance qualité aura grandement contribué au succès et à la qualité du travail de thèse.
Merci à Bahare, Marius, Mike-Ely, Scott, Clément et Santiego pour les discussions tantôt scientifiques, tantôt tout simplement loufoques et combien divertissantes!
Un merci chaleureux à mes parents qui ont toujours cru en moi et n’ont jamais arrêté de m’encourager, et ce malgré un parcours académique non traditionnel.
Un tendre merci à Jean-Philippe pour avoir agrémenté mon quotidien spécialement dans les moments plus difficiles. Merci de m’avoir soutenue tout au long et d’avoir fait preuve d’une constante compréhension malgré les heures accumulées de travail en soirée et les fins de semaine.
Finalement, un merci tout spécial à bébé Édouard, qui a su patienter au moins 39 semaines avant de se montrer le bout du nez, me permettant ainsi de mener à bien cette thèse avant de pouvoir savourer pleinement sa venue tant attendue dans nos vies.
1. Introduction
Alzheimer’s disease (AD) is the most common type of dementia and there is substantial interest in better understanding the condition to help discover new treatments. Candidates for the primary causal factor of the disease include: cholinergic deficits [1], beta-amyloid (Aβ) deposition [2,3] and hyperphosphorylated tau pathology [4]. Additional factors that may have an important influence in the development of AD are: mitochondrial dysfunction [5-9] which tends to decrease the cerebral metabolic rate of O2 (CMRO2) consumption [10], and chronic hypoperfusion (a deficit in cerebral blood flow (CBF)) which could result in a lack of oxygen availability, leading to the beginning of mitochondrial failure [10]. Ultimately, a progressive synaptic, neuronal and axonal degeneration is observed. Given the above considerations, a detailed exploration of both oxidative metabolic (CMRO2) and vascular (CBF) dysfunction is a promising avenue to consider in order to advance preventative and treatment strategies of the AD.
1.1.
Positron emission tomography in AD
Positron emission tomography (PET) has been used to image resting oxygen consumption [11,12] in AD. However, imaging of CMRO2 using PET is challenging as it requires an on-site cyclotron for the three separate administrations of the short-lived (half-life of about two minutes) 15O radioactive tracers, each followed by an image acquisition of relatively low sensitivity [13], along with a number of arterial blood draws to measure blood radioactivity. Hence, this procedure is arduous for the patients and its adoption in large-scale research studies and clinical setting has been difficult. Despite the challenges associated with this approach, earlier PET studies have allowed the establishment of basic physiology associated with oxygen uptake deficits associated with AD. Ishii et al. observed an oxidative metabolism deficit in the medial temporal, lateral temporal and parietal cortices of AD relative to controls [14], which was later replicated [15-17], while no significant difference between the two groups was generally found with regards to oxygen extraction fraction (OEF) at rest. More recent results are in agreement with the hypothesis that oxidative metabolism may have a predominant role in the development of AD [18-23].
In addition to imaging of CMRO2, PET is commonly used to image amyloid burden, regional perfusion and glucose uptake at rest (18FDG, i.e. fluorodeoxyglucose). As opposed to the PET measures of CMRO2, FDG-PET offers good sensitivity and spatial resolution, and since 18F has a relatively long half-life, there is no need for an on-site cyclotron when used in clinical settings. Studies have shown a coupling between cerebral perfusion, glucose consumption and oxygen consumption, which includes a parietotemporal pattern of reduction in perfusion and glucose uptake. It was also observed that a frontal deficit was either associated with the degree of AD progression [24], or with frontotemporal dementia [25] and vascular disease [15].
1.2.
Magnetic resonance imaging in AD
Similar to PET imaging, magnetic resonance imaging (MRI) has so far played an important role in the characterization of Alzheimer’s disease. Structural MRI has been used to provide static anatomical information.
During a structural MRI scan, the application of an RF pulse forces protons in the brain tissue to align and thereafter, to revert back to their resting states following a certain longitudinal (T1) and transverse (T2) relaxation time. A different signal intensity is thereby observed across tissues and depends mainly on the amount of water in each voxel (proton density (PD)) as well as the longitudinal (T1-weighted) and transverse (T2-weighted) relaxation times, associated with each soft tissue. Hence, structural MRI offers a high spatial resolution view of soft tissue contrast, and is therefore well suited for the estimation of tissue damage or loss, an important biomarker in AD. The application of structural MRI in AD includes the characterization of whole-brain atrophy [26-29] or atrophy of vulnerable regions, such as the hippocampus [30-33] and entorhinal cortex [34], which are both part of the medial temporal lobe and implicated in the formation and storage of memories [35,36]. Additionally, it was found that the structural changes were particularly sensitive to progression from mild cognitive impairment (MCI), patients with early clinical signs of AD who don’t fulfill the criteria for dementia, to moderate stages of AD [29,37].
Functional MRI (fMRI) provides dynamic physiological information and includes, among other parameters, blood oxygen level dependent (BOLD), connectivity and blood flow techniques.
The BOLD contrast mechanism results from the presence of different magnetic properties of oxygenated and deoxygenated hemoglobin [38]. While oxyhemoglobin (Hb) is diamagnetic, deoxyhemoglobin (dHb) is paramagnetic. The presence of paramagnetic dHb yields a decrease in the T2*-weighted signal (1/R2*) due to increased signal inhomogeneity resulting from dephased water spins. As arterial blood is almost fully oxygenated, the attenuation of the T2* signal comes from venous blood and tissue with dHb [39,40]. Following the elimination of all dHb, the BOLD value will be at its maximum, and will depend on the initial dHb concentration. During a task, blood velocity and vessel volume increase. The increase in perfusion exceeds that of the oxygen consumption rate, yielding a lower dHb concentration, and hence the BOLD increase we observe in fMRI (increase in the T2 *-weighted signal) [38,41].
The most common use of the BOLD technique for AD is the evaluation of functional responses during a memory-encoding task [42-44]. More recently, an additional fMRI approach was developed, that maps the resting-state network (RSN) connectivity in the brain. By removing the need for a task paradigm, this approach lessens the potential difficulties experienced by the patients and can simplify statistical analysis and interpretation of the results due to the large number of behavioral variables. Resting-state fMRI connectivity allows the study of spontaneous BOLD fluctuations over time and the identification of correlation patterns (or networks) between voxels. It was demonstrated that the basic brain networks were altered in AD compared to a cohort of healthy controls [45-47].
The arterial-spin-labeling (ASL) technique is a non-invasive MRI approach that, by labeling the blood water from the neck as it flows up toward the brain, creates a temporary endogenous contrast agent yielding a blood flow-dependent component in the brain’s MRI signal that can be isolated and quantified by subtraction of the unlabeled control images. The ASL technique allows the quantitative measurement of resting CBF, task-related responses, as well as cerebrovascular reactivity (CVR). CVR is measured under hypercapnic conditions, i.e.
[48], hence increasing blood flow [49,50]. CVR is commonly expressed as the amplitude of CBF increase for a given increase of PaCO2. ASL was previously applied to dementia to assess the resting vascular component of the condition [51,52] and most consistent result was the blood flow decrease in the precuneus and/or posterior cingulate, as well as in the lateral parietal cortex. Decreased blood flow in posterior cingulate was also observed in MCI, making it a good candidate for early detection of the disease. These flow decreases appear to be coupled with metabolism decreases observed using PET [24]. Findings in the temporal lobe are limited due to the small number of studies providing information in that region, however, it was suggested that blood flow in AD was decreased in inferior-lateral temporal cortex. Finally, few studies have pointed towards an increase in hippocampal blood flow [53,54].
1.3.
Calibrated MRI: task-related changes of CMRO
2The BOLD contrast obtained from conventional fMRI suffers from being unspecific, since it reflects multiple physiological processes such as changes in blood flow, blood volume and oxidative metabolism. In situations where a cohort of homogeneous participants is evaluated, BOLD contrast remains a non-invasive and accessible method with good sensitivity for mapping task-related responses. However, when heterogeneity is suspected between two cohorts of a vascular or metabolic nature, the BOLD signal becomes insufficient. In 1998, the term “calibrated MRI” was introduced by Tim Davis, to describe a method that combined the BOLD and the ASL responses to a hypercapnic manipulation, in order to calibrate the BOLD contrast and subsequently, to determine the quantitative changes in oxygen consumption encountered during a specific task [55]. This calibrated MRI was later referred as hypercapnically calibrated fMRI. In 2007, Peter Chiarelli et al. proposed a variation of the Davis hypercapnia approach, by replacing the hypercapnia periods with periods of hyperoxia, where participants were breathing air with enriched O2 [56]. This new approach had the advantages of eliminating the discomfort associated with the carbon dioxide inhalation, excludes the possibility of CO2 impacting the metabolism and reduces the importance of ASL. However, this technique implicates a set of assumptions, including a constant whole brain oxygen extraction fraction (OEF), which can in fact vary between regions and participants in cases of pathology [57]. In recent years, other groups have introduced the R2’ method [58],
which aims to estimate the calibration parameter M without requiring a gas manipulation, and the General Calibrated Model (GCM), introduced by our group [59], where the BOLD contrast could be calibrated for any arbitrary combinations of hypercapnic and hyperoxic manipulation. Compared to the original hypercapnic and hyperoxic approaches, the GCM was found to offer a better stability in the presence of noisy CBF signals [59]. Until then, the quantitative MRI methods were restricted to measure fractional changes in O2 consumption (during a task) and were thus quantitative in relative terms only. Following the growing interest in the mapping of absolute baseline O2 extraction fraction and O2 consumption, novel MRI-based techniques were developed in this respect and are discussed next.
1.4.
Baseline CMRO
2The quantitative BOLD (qBOLD) method, described by He and Yablonskiy, is based on the Gradient Echo Sampling of Spin Echo (GESSE) sequence. With the use of a biophysical model, this sequence allows the extraction of the venous oxygen saturation in extravascular tissue and the estimation of the baseline OEF [60-62]. A major drawback of the qBOLD method is that it depends on a large number of assumed parameters, which are difficult to measure directly on an individual basis.
A second approach, dubbed QUIXOTIC (quantitative imaging of extraction of oxygen and tissue), uses a velocity-selective excitation scheme to isolate the venous blood oxygenation signal [63], from which the OEF and CMRO2 can be obtained. An important limitation of the QUIXOTIC method is the need to know the precise velocity range in order to select the blood venular signal, a range that may differ with age and disease.
Finally, an alternative method has been suggested by Bulte et al. [64], in which the calibrated parameter M is determined employing the hypercapnia calibration [55] and then fitted in the hyperoxia calibration technique [56] to obtain the OEF. By combining the latter with measures of CBF and end-tidal O2, the baseline estimate of CMRO2 is retrieved. This method is closely related to the approach proposed by Gauthier et al., dubbed QUO2 (Quantitative O2) [65]. However, it possesses a larger number of assumptions, which differ between the hypercapnia and hyperoxia calibration, hence increasing its sources of systematic
errors and of physiological ambiguity [59]. The QUO2 approach was the starting point of this thesis and is described in further details in the following section.
1.5.
QUO2: Quantitative O2
The approach, shown in Figure 1.1, combines periods of hypercapnia (HC) and hyperoxia (HO) with simultaneous acquisition of BOLD and CBF using dual-echo pCASL [65]. Meanwhile, end-tidal respiratory gases are non-invasively sampled. The end-tidal O2, along with the BOLD and CBF voxel-wise responses to either one of the respiratory manipulation, are inputs to the GCM, yielding a functional curve of paired maximum BOLD increase (M) and OEF. Repeating the latter measurements under the other respiratory manipulation, results of an additional functional curve of dependency between M and OEF. By intersecting the two curves, thus solving the system of two equations, we obtain the voxel-wise value of M and OEF. The product of resulted arterial O2 content (CAO2), approximated by the end-tidal O2, with resting CBF gives us the O2 delivery, which multiplied by OEF, yields the resting CMRO2 in micromolar units. Moreover, in addition to providing estimates of M, OEF and CMRO2, the QUO2 method offers vascular information such as the baseline blood velocity and the CO2-mediated cerebrovascular reactivity (CVR).
Figure 1.1. The Quantitative O2 (QUO2) approach
The approach combines periods of hypercapnia (HC) and hyperoxia (HO) with simultaneous acquisition of blood oxygen level dependent (BOLD) and cerebral blood flow (CBF) using a
OEF OEF HC M M OEF0 CBF0 Resting CMRO2 OEF HO M M HO HC OEF %CBF %BOLD XResting CA X O2 %BOLD %CBF pCASL measurements HC HO Respiratory Manipulation 0 1002003004005006007008009001000 0 10 20 30 40 50 60 70
Student Version of MATLAB
0 1002003004005006007008009001000 0 10 20 30 40 50 60 70
Student Version of MATLAB
0 1002003004005006007008009001000 0 10 20 30 40 50 60 70
Student Version of MATLAB
0 1002003004005006007008009001000 0 10 20 30 40 50 60 70
Student Version of MATLAB
0 1002003004005006007008009001000 0 10 20 30 40 50 60 70
Student Version of MATLAB
0 1002003004005006007008009001000 0 10 20 30 40 50 60 70
Student Version of MATLAB
0 1002003004005006007008009001000 0 10 20 30 40 50 60 70
Student Version of MATLAB
0 1002003004005006007008009001000 0 10 20 30 40 50 60 70
Student Version of MATLAB
0 1002003004005006007008009001000 0 10 20 30 40 50 60 70
Student Version of MATLAB
0 1002003004005006007008009001000 0 10 20 30 40 50 60 70
Student Version of MATLAB
0 1002003004005006007008009001000 0 10 20 30 40 50 60 70
Student Version of MATLAB
0 1002003004005006007008009001000 0 100 200 300 400 500 600
Student Version of MATLAB
0 1002003004005006007008009001000 0 100 200 300 400 500 600
Student Version of MATLAB
0 1002003004005006007008009001000 0 100 200 300 400 500 600
Student Version of MATLAB
0 1002003004005006007008009001000 0 100 200 300 400 500 600
Student Version of MATLAB
0 1002003004005006007008009001000 0 100 200 300 400 500 600
Student Version of MATLAB
0 1002003004005006007008009001000 0 100 200 300 400 500 600
Student Version of MATLAB
0 1002003004005006007008009001000 0 100 200 300 400 500 600
Student Version of MATLAB
0 1002003004005006007008009001000 0 100 200 300 400 500 600
Student Version of MATLAB
0 1002003004005006007008009001000 0 100 200 300 400 500 600
Student Version of MATLAB PCO2
PO2
General Calibrated
dual-echo version of pseudo-continuous arterial spin labeling (pCASL). A Generalized Calibration Model (GCM) is fed with obtained measurements yielding a fully determined system of two equations and two unknowns: Oxygen Extraction Fraction (OEF), and extrapolated maximum BOLD signal increase (M). The product of resulted arterial O2 content (CAO2) with resting CBF gives us the O2 delivery, which multiplied by OEF, yields the resting cerebral metabolic rate of O2 (CMRO2) in micromolar units.
The QUO2 method thus offers the possibility of employing a widely available system that does not imply any ionizing radiation or arterial catheterization, to help better characterize the vascular and metabolic burdens of disease such as AD. Another major advantage of QUO2 fMRI over other modalities is that structural, vascular and connectivity measurements can be performed concurrently. Together, these allow correlation of structural and functional measurements within a single modality.
1.6.
The present thesis work
Prior to the beginning of the work presented in this thesis, the initial proof-of-concept QUO2 had been tested in seven healthy volunteers [65], and, while it proved to produce valid regional and group-averaged estimates of M, OEF and CMRO2, it showed signs of instability and lack of solutions in individual maps. These preliminary results were encouraging, but further improvement, validation and evaluation of the technique were needed (Tancredi et al. [66,67], Chapter 2-3) prior to its application in an AD population (Chapter 4).
The initial application of the proof-of-concept QUO2 method employed a standard oxygen breathing circuit, which needed to be fixed to the participant’s face using tape in order to avoid contamination from room air. Even with the use of tape (which could induce discomfort and an increased feeling of claustrophobia for certain participants), it was observed that the use of the standard oxygen mask yielded unstable fractional concentrations of inspired O2 or CO2, as well as a dependency between end-tidal measurements and the administered flow rate [66]. In order to increase the participant’s comfort and stability in inspired and end-tidal values, we developed a breathing circuit, presented in Tancredi et al. [66], which was employed throughout the present work. The latter, by incorporating an open reservoir through
which the participant could breathe room air whenever the provided flow become insufficient, also provides, over the simple oxygen mask, additional safety to the participant.
Thereafter, an assessment of the precision (Tancredi et al. [67], Chapter 2) and accuracy (Chapter 2) of QUO2 parameters was performed. Precision of the model-derived parameters will partly depend on the random error in the measurements of BOLD and CBF response to the respiratory manipulation. While previous work presented a simulation of the impact on M estimates of such errors in CBF measurements [59], the impact on OEF (and indirectly CMRO2) to errors in BOLD measurements in addition to CBF, was still to be evaluated and was simulated in Chapter 2. Additionally, a reproducibility study was performed in eight healthy volunteers to determine the regional within- and between-subject variance (Chapter 2). On the other hand, the accuracy of model-derived estimates is impacted by systematic errors due to the assumed parameters used in the model. Chapter 2 presents the sensitivity of the model to the QUO2 assumed parameters described next. The Grubb parameter (α) defines the relationship between the venous blood flow and blood volume. It was originally estimated to be 0.38, based on work in anesthetized monkeys [68], but was later found to be 0.18 in adult humans [69,70]. The latter value has been used in several studies, including the present work. The β parameter represents the power-law relationship between dHb and transverse relaxation [71]. The original estimate of 1.5 at 3 Tesla was employed throughout the present work although alternate interpretations have been postulated corresponding to a lower value of 0.91 [72]. The hemoglobin concentration in blood ([Hb]) was set to 15 g Hb/dl blood the group of healthy volunteers in Chapter 2 and 3 [56,73]. However, considering that [Hb] varies with gender and age [74-76], and that it can be easily determined by a simple blood draw, we measured it in our probable AD and elderly cohorts of Chapter 4, hence eliminating the presence of systematic errors associated with the hemoglobin concentration in blood. An additional assumption made throughout the present work is that neither hyperoxia nor hypercapnia were yielding a change in oxidative metabolism. This assumption remains the subject of ongoing debate [77-83] and hence, the sensitivity of the model to any changes in CMRO2 during either HC or HO was assessed. Finally, an assumed value [64,84] or the group-averaged value of blood flow changes during hyperoxia in calibrated fMRI is commonly employed [65,85] since its real value is often near the level of
ASL noise and because the correction for changes in blood T1 during HO remains challenging. This latter correction will be discussed in the following section. For our younger healthy controls (Chapter 2 and 3), we used the individual T1-corrected CBFHO value and presented an evaluation of the QUO2 sensitivity to this parameter (Chapter 2). In Chapter 3, we opted for the use of group-averaged T1-corrected value due to a larger noise level in our patients and elderly cohorts data compared to our younger healthy controls.
An additional factor that may contribute to the precision and accuracy of the QUO2 model-derived estimates is the oxygen concentration provided during the hyperoxia manipulation. A maximal level, such as 100% oxygen, may diminish the error in M estimation by bringing the BOLD changes closer to the maximum value. However, compared to a lower concentration of O2, such as around 50%, the inhalation of 100% O2 may result in a larger area of susceptibility artifacts near the sinuses due to the increased presence of paramagnetic oxygen molecule [86]. Additionally, the inhalation of air enriched with O2, results in an increased paramagnetic O2 concentration in plasma, which shortens the arterial relaxation time
T1 [87-89]. Since the ASL signal depends on the blood relaxation time [90], this decrease in T1 must therefore be taken into account, otherwise the estimated response to hyperoxia will be overestimated. The T1-correction throughout the present thesis was performed as follows: first, the T1 during hyperoxia was linearly interpolated from literature values [89] based on our individual arterial partial pressure (PaO2). Finally, a corrective factor was applied [91,92] based on the adjusted T1 and the quantitative blood flow equation [93]. Hence, a higher level of O2 concentration during HO may necessitate a greater T1-correction, which could be prone to larger errors in T1-corrected CBF response estimation. Chapter 3 was dedicated to the exploration of the above impacts of inspired oxygen levels on the QUO2 model-derived estimates, in order to determine the best compromise for the concentration of inspired O2.
Finally, we recruited 65 probable AD dementia and 65 age-matched controls in order to apply the enhanced QUO2 calibrated fMRI for comparison of obtained estimates. The application of task-related calibrated fMRI was previously seen in aging [94-96], while only isolated studies evaluated the absolute oxygen metabolism applying a calibrated fMRI approach in aging or in internal carotid artery occlusion patients [97,98]. To our knowledge,
part of the present thesis a particularly novel contribution both in the developments of calibrated MRI techniques as well as in clinical and research applications in AD. Chapter 4 of this thesis presents the outcomes of the QUO2 application in AD.
In summary, in order to enhance the accuracy and robustness of the model-derived estimates, the temporal stability of the BOLD and CBF responses to respiratory manipulation were enhanced through improved respiratory monitoring with a novel breathing circuit [66]. Thereafter, the reproducibility in grey matter of the previous measurements was evaluated in healthy subjects [67]. Chapter 2 presents an enhancement in the QUO2 image analysis, the assessment of the within- and between-subject variance of the model-derived estimates, as well as the evaluation of sensitivity of the model to random and systematic errors. Chapter 3 assesses the impact of the O2 level during the hyperoxia periods on M, OEF and CMRO2. Finally, in Chapter 4, the QUO2 is applied in a cohort of probable AD and age-matched group control.
2. Regional Reproducibility of BOLD Calibration
Parameter M, OEF and Resting-State CMRO
2Measurements with QUO2 MRI
Authors: Isabelle Lajoie, Felipe B. Tancredi, Richard D. Hoge
Authors contributions: Study design and Software development: IL FBT RDH; Data acquisition: IL FBT; Formal analysis and Data interpretation: IL; Writing original draft and Visualization/Data presentation: IL; Project administration and Funding acquisition: RDH. Status: Published in the journal PLoS ONE. 2016; 11(9): e0163071.
2.1.
Preface
Calibrated fMRI was first proposed by Davis et al. [55], who employed a hypercapnic respiratory manipulation along with an MRI ASL sequence and a biophysical model. This allowed the quantification of task-evoked fractional CMRO2. Considering the discomfort associated with the inhalation of air mixed with carbon dioxide, alternative techniques were developed. Chiarelli et al. proposed the hyperoxia calibration [56], whereas Blockley et al. suggested the use of the information in gradient and spin echoes to calibrate the BOLD signal without the need for a gas manipulation [58]. However, these two methods were found to be more sensitive to errors than the original hypercapnic calibration method [58]. A third method, the generalized calibration model (GCM), was proposed [59] that allows the calibration of the BOLD signal for any arbitrary combinations of hypercapnic and hyperoxic manipulations. This new approach was found to yield robust and accurate M maps and hence reliable estimations of the changes in CMRO2 during a visual task.
The different calibrated fMRI approaches are limited by the fact that they report a relative change from unknown baselines, making them insufficient in situations where the studied groups have different baseline CMRO2, such as in aging or dementia [19,99-101]. Moreover, they require a task, which may be arduous for certain clinical populations.
Therefore, several groups have developed MRI-based techniques allowing absolute quantification of resting CMRO2 [61-64,102-105]. One such approach, which was dubbed Quantitative O2 (QUO2) [65], combines two separate hypercapnia and hyperoxia manipulations using the GCM in order to estimate voxel-wise M and resting oxygen extraction fraction (OEF) values. The product of resting OEF, resting blood flow (issued from the MRI ASL sequence) and arterial oxygen content, yields the baseline CMRO2.
The initial proof-of-concept for QUO2, applied in a population of healthy volunteers proved to yield regional and group-averaged estimates that were consistent with those of prior PET studies [65]. However, the voxel-wise individual maps suffered from instability and some voxels lacked solutions for OEF and M, while information about variance in its estimates as well as about its sensitivity to random and systematic errors were incomplete. Within the course of work of the present thesis, the first advance was achieved by the replacement of the
standard oxygen mask by a newly designed breathing circuit which proved to yield a better stability in the inspired concentration and hence in the end-tidal values [66]. This in turn led to a better temporal stability of the CBF and BOLD responses to the respiratory manipulations. Thereafter, end-tidal O2/CO2 and grey matter CBF/BOLD signals reproducibility were assessed, revealing generally robust and consistent measures, with blood flow response to hypercapnia being the most variable (CV<20%) [67].
Here, in Chapter 2, we propose a number of improvements for QUO2 MRI image analysis, followed by an investigation of the within- and between-subject repeatability of model-derived estimates within different key regions. Finally, the sensitivity of the model to different sources of random and systematic errors was established.
2.2.
Abstract
The current generation of calibrated MRI methods goes beyond simple localization of task-related responses to allow the mapping of resting cerebral metabolic rate of oxygen (CMRO2) in micromolar units and estimation of oxygen extraction fraction (OEF). Prior to the adoption of such techniques in neuroscience research applications, knowledge about the precision and accuracy of absolute estimates of CMRO2 and OEF is crucial and remains unexplored to this day. In this study, we addressed the question of methodological precision by assessing the regional inter-subject variance and intra-subject reproducibility of the BOLD calibration parameter M, OEF, O2 delivery and absolute CMRO2 estimates derived from a state-of-the-art calibrated BOLD technique, the QUantitative O2 (QUO2) approach. We acquired simultaneous measurements of CBF and R2* at rest and during periods of hypercapnia (HC) and hyperoxia (HO) on two separate scan sessions within 24 hour using a clinical 3 T MRI scanner. Maps of M, OEF, oxygen delivery and CMRO2, were estimated from the measured end-tidal O2, CBF0, CBFHC/HO and R2*HC/HO. Variability was assessed by computing the between-subject coefficients of variation (bwCV) and within-subject CV (wsCV) in seven ROIs. All tests GM-averaged values of CBF0, M, OEF, O2 delivery and CMRO2 were: 49.5 ± 6.4 mL/100 g/min, 4.69 ± 0.91%, 0.37 ± 0.06, 377 ± 51 µmol/100 g/min and 143 ± 34 µmol/100 g/min respectively. The variability of parameter estimates was found to be the lowest when averaged throughout all GM, with general trends toward higher CVs
when averaged over smaller regions. Among the MRI measurements, the most reproducible across scans was R2*0 (wsCVGM=0.33%) along with CBF0 (wsCVGM=3.88%) and R2*HC (wsCVGM=6.7%). CBFHC and R2*HO were found to have a higher intra-subject variability (wsCVGM=22.4% and wsCVGM=16% respectively), which is likely due to propagation of random measurement errors, especially for CBFHC due to the low contrast-to-noise ratio intrinsic to ASL. Reproducibility of the QUO2 derived estimates were computed, yielding a GM intra-subject reproducibility of 3.87% for O2 delivery, 16.8% for the M value, 13.6% for OEF and 15.2% for CMRO2. Although these results focus on the precision of the QUO2 method, rather than the accuracy, the information will be useful for calculation of statistical power in future validation studies and ultimately for research applications of the method. The higher test-retest variability for the more extensively modeled parameters (M, OEF, and CMRO2) highlights the need for further improvement of acquisition methods to reduce noise levels.
Key-words: Calibrated fMRI; Baseline oxidative metabolism; Reproducibility; Hypercapnia;
Hyperoxia; de-pCASL
2.3.
Introduction
Mapping of resting metabolism in the brain is of considerable interest for diagnostic and research applications. Until recently, positron emission tomography (PET) using a triple injection of radio-labeled O2 was the only imaging method for measuring cerebral metabolic rate of O2 consumption (CMRO2) [11]. The PET method requires exposure to ionizing radiation, arterial sampling, and access to an on-site cyclotron to produce the short-lived 15 O-labeled tracers, limitations that have led to the development of magnetic resonance imaging (MRI) techniques to measure O2 consumption [64,85,106].
The approach proposed by our team, Quantitative O2 (QUO2) MRI is based on respiratory calibration of the BOLD signal, in which the oxygen extraction fraction (OEF) at rest is determined using hypercapnia (HC) and hyperoxia (HO). During the respiratory manipulation, we monitor end-tidal O2 (ETO2) levels and use dual-echo ASL to measure BOLD and cerebral blood flow (CBF) simultaneously. ETO2, BOLD and CBF then serve as
which yields a system of two equations with solutions for the BOLD calibration parameter M, i.e. the maximum BOLD signal increase when venous O2 saturation approaches 100%, and resting OEF. Multiplication of OEF by baseline CBF and arterial O2 content (estimated from ETO2 monitoring and, optionally, blood testing) gives resting CMRO2 in absolute units, e.g. µmol/100 g/min.
An initial proof-of-concept of the QUO2 method was presented in Gauthier and Hoge [65] to obtain individual and group maps of BOLD calibration parameter M, resting OEF and CMRO2. While valid regional and group-averaged estimates of the latter parameters were obtained, individual OEF maps showed signs of instability characterized by large fluctuations in the modeled values and a lack of solution in certain regions. The stability of individual solution maps generated using this method depends on accurate and robust measures of end-tidal O2 and maps of fractional changes in BOLD and CBF during the respiratory manipulation. In an attempt to improve the stability and avoid circumstances where the QUO2 model cannot be solved, we have adapted the imaging and respiratory protocols used in several ways. Instead of performing two separate respiratory scans for hyperoxia and hypercapnia, we have adopted the 18-minute respiratory sequence that alternates between periods of hypercapnia and hyperoxia [64] and during which the total time dedicated to each gas manipulation is increased compared to the original protocol, improving statistical power. We developed a simple breathing circuit allowing a better control over fractional concentration of inspired gas and thus yielding improved stability of end-tidal values compared with the simple oxygen masks used in our earlier studies [66]. Combining a version of the pseudo-continuous ASL sequence (de-pCASL), the respiratory protocol and breathing circuit mentioned above, we assessed the test-retest reliability in the respiratory responses and in CBF and BOLD responses within GM [67]. In the present study, we attempted to further improve the voxel-wise image quality in single-subject maps by performing an integrated analysis on the dual-echo pCASL data. The novel analysis strategy (further described in Materials and Methods) involved 1) motion correcting the interleaved echo series using the same transformation for the two echo times; 2) applying a more holistic general linear model on the motion-corrected series to extract baseline parameters and gas responses using one regressor per combination of echo and tag/control; 3) employing both echoes information to
estimate R2* rather than approximating it from the second echo; and 4) employing a more sophisticated approach to mitigate solution instabilities from isolated non-parenchymal voxels using 3D median filtering.
The aim of this study was to assess, in a small cohort of healthy individuals, the variability of the optimized QUO2 measures across and within subject in different brain regions. These results, based on the precision of the method, will help guide future developments and research application of the method. The following estimates were obtained: BOLD calibration parameter M, OEF, O2 delivery and resting CMRO2. The impact of systematic and random errors on the accuracy and precision of such estimates was also evaluated. Furthermore, these estimates were compared with CBF and BOLD-based reproducibility estimates derived from the same group of subjects and same enhanced analysis.
2.4.
Materials and Methods
Eight healthy adults were enrolled in this study (4 females, mean age: 30.5 ± 5.7 years). Two participants were current smokers. None of the participants had asthma, previous history of cardiovascular, cerebrovascular or respiratory diseases. One participant was treated for hypothyroidism. All participants gave written informed consent and the project was approved by the Comité mixte d’éthique de la recherche du Regroupement Neuroimagerie/Québec. They were scanned twice (referred to as Test A and Test B), within 24 hour, using the same imaging procedures and respiratory manipulation. To minimize effects of diurnal fluctuation in blood flow, all sessions was acquired between 2 PM and 6 PM [107]. The participants were asked to abstain from caffeine 3 hours prior to scanning.
2.4.1. Respiratory Manipulation
For the respiratory manipulation, we adopted the gas sequence described by Bulte et al. [64] with a total duration of 18 minutes. This involves two 2-min periods of hypercapnia (HC) and two 3-min periods of hyperoxia (HO). HC was followed by a 1-min normocapnic period and then the 3-min hyperoxic stimulus. HO was followed by a 3-min period of normoxia.
HC and HO blocks were induced by supplying participants with gas mixtures enriched with CO2 or O2. Participants breathed the gas mixtures through the breathing circuit developed in-house [66]. An automated system, also developed in-house, was used to deliver the gas mixtures with a reproducible time course in all scanning sessions. The system comprises 4 flow controllers (SideTrak® 840, Sierra instruments, L. Monterey, CA, USA), a ~25 mL mixing chamber, a digital interface (Sierra, FloBoxTM 954) to send commands to the flow controllers and a laptop computer to automate the gas mixture processes and collect behavioral data. The system’s output is connected to the breathing circuit via 10 meters of plastic tubing (BIOPAC, AFT31-MRI). Three gases were input to the flow controllers: medical air, oxygen and a 5% CO2 and air mixture. During the hyperoxia periods, subjects breathed a mixture of 50% pure oxygen balanced with air, yielding a fix inspired O2 concentration of 60% O2. Otherwise, participants were given medical air to breathe. Gas mixtures were administered at a rate of 20 L/min, except during transitions in inspired concentrations, during which the flow rate was increased to 50 L/min for 5.4 seconds in order to accelerate transitions.
Respiratory gases were continuously monitored using the CO2100C and O2100C modules of a BIOPAC MP150 system (BIOPAC Systems Inc., CA, USA). Gases were sampled via a 10m segment of rigid tubing (AFT31-XL, from BIOPAC System Inc.) in series with a bacterial filter (#2200/01, GVS filter technology, LA, UK) and 1’ segment of oxygen tubing attached to the sampling port of the respiratory circuit.
2.4.2. Image Acquisition
Images were acquired on a clinical 3 T scanner (Siemens TIM TRIO, Siemens Medical Solutions, Erlangen, Germany) using the vendor’s 32-channel receive-only head coil. The scan session included a 5-minute anatomical acquisition (1 mm3 MPRAGE with TR/TE/flip angle = 2.3 seconds/3 msec/9°, 256x240 matrix, GRAPPA factor = 2), and an 18-minute functional scan using a dual-echo version of pseudo-continuous ASL sequence (de-pCASL) [108] in order to acquire simultaneous measures of BOLD and CBF. The de-pCASL parameters were: TR/TE1/TE2/alpha = 4.12 seconds/8.4 msec/30 msec/90°, labeling duration = 2 seconds using Hanning window-shaped RF pulse with duration/space = 500 µsec/360 µsec, flip angle = 25°, slice-selective gradient = 6 mT/m, label offset = 100 mm below the center of image slab,
nominal and average post-labeling delay (PLD) = 0.9 and 1.44 seconds respectively. The readout consisted of a GRE-EPI with GRAPPA factor = 2, partial sampling of k-space = 7/8, in-plane resolution of 4.5 x 4.5 mm2, 21 slices with 4.5 mm thickness and 0.45 mm gap.
2.4.3. Respiratory Data Analysis
Analysis of the respiratory data was carried out using an in-house program developed in Matlab (MathWorks, Natick, MA, USA). An automatic extraction of the end-tidal (ET) and fixed-inspired (FI) points from the continuous O2 and CO2 traces was performed. It was observed that the filter placed in series with the sampling line added an extra resistance causing an effect of low-pass filtering to the respiratory waveform. This resulted in an offset of both the ET and FI monitored pressures, i.e. an attenuation of the peak-to-peak amplitude of the waveform, which was dependent on the participant’s breathing pace. Each ET point was corrected using the average of the differences between the observed and expected FI points surrounding it. ET values were also corrected to account for an expired partial pressure of water of 47 mmHg [109]. The resting ET and changes in ET during HC and HO periods were determined by applying the linear model previously described [110]. The model is composed of a third-degree polynomial term and four regressors to represent responses to the hypercapnic and hyperoxic blocks. The offset term served to estimate the baseline ET whereas the effect size of each response regressor yielded an estimate of the associated ET change. Final ETO2 change to periods of HO was obtained by averaging the two ETO2 changes to HO. The same method was employed to compute the final ETO2 change to periods of HC, and ETCO2 responses to both gases.
The average values of ETO2 at baseline and during both respiratory stimuli were used to compute arterial O2 content (ml O2/ml blood) and change in the venous deoxygenated fraction ( [dHb]/ [dHb]0 ) as in Chiarelli et al. [56] and Gauthier et al. [85]. The latter quantities are integrated to obtain the BOLD calibrated value M, resting OEF and CMRO2 as specified below.
2.4.4. Imaging Data Analysis
2.4.4.1. Preprocessing
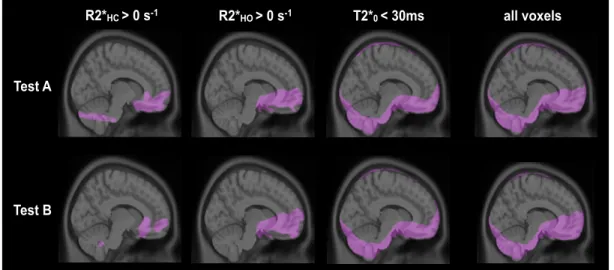
Analysis of functional scans was performed using in-house software implemented in C. The interleaved echo series was motion corrected with consecutive first and second echo frames sharing the same transformation matrix. The resultant series was spatially filtered (8mm FWHM 3D Gaussian kernel), had extra-cerebral voxels removed and was intensity normalized (brain mean 100). The fMRI data were then fit to a GLM to extract the label and control series of both echoes during baseline, hypercapnia and hyperoxia periods. The model used four regressors per conditions to account for both echoes label and control points, and a third-degree polynomial with an offset term representing signal drifts. We used a single-gamma HRF function with 20 seconds time-to-peak and 40 seconds width, which yielded near-exponential transitions to account for the slow response of the arterial partial pressures to the inspired gas [111]. ASL (S0) and BOLD (R2* or 1/T2*) control and label series at baseline and during gas manipulations were computed using both echoes information. ASL flow series were computed from subtraction of S0 control to S0 label series, whereas BOLD series were isolated averaging the control and label R2* series. A 3D median filtering (radius of 1 voxel) was applied on the resultant maps to minimize the impact of non-parenchymal voxels such as those containing large blood vessels.
The functional maps produced by the above analysis were then used to further reduce the impact of voxels not meeting the assumptions of the QUO2 model: Baseline T2* maps served to exclude voxels in regions degraded by susceptibility artifacts (lower threshold of 30ms). Voxels in which ∆R2*HO was positive were assumed to be dominated by susceptibility artifacts from adjacent nasal cavity due to the paramagnetic effect of molecular O2. Additional voxels with positive ∆R2*HC were considered as non-parenchymal and were also excluded from the analysis. The ASL signal was converted into physiological units of flow (mL/100 g/min) as in Wang et al. [93] using the constants recommended by the ISMRM Working Committee [112] and an adjusted PLD to account for slice acquisition time (PLD range for 21 slices of 900-1960ms).
During hyperoxic manipulation, the T1 of blood is altered due to an increase in plasma concentration of paramagnetic O2 [89]. To account for this change in blood T1, which would bias our ∆%CBFHO estimation, we applied a corrective factor using the approach described in Chalela et al. [91] and Zaharchuk et al. [92]. The T1 of blood during hyperoxic intervals was estimated individually using the R1 and PaO2 relationship in rats’ blood reported in Pilkinton et al. [89].
2.4.4.2. Computation of metabolism
For each gas challenge, the changes in the venous deoxygenated fraction, along with the change in BOLD (∆R2*) and CBF were used as inputs to the generalized calibration model (GCM) described in Gauthier et al. [59]. This yields a system of two equations with two unknowns: the BOLD calibration parameter M (extrapolated maximum BOLD fractional signal increase when venous O2 saturation approaches 100%) and OEF (the fraction of delivered oxygen that is consumed). Absolute CMRO2 was then determined by multiplying OEF by O2 delivery, computed as the product of resting CBF by arterial O2 content. In the absence of intersection in between the HC and HO curves, the voxel is said to have no solution and will later be excluded from any ROI or voxel average in M, OEF and CMRO2. Because of the low CNR of the ASL hyperoxic response, the GM-averaged value obtained from the post-
T1-correction ∆%CBFHO was used as an estimate of the whole-brain post-T1-correction ∆%CBFHO. Previous studies [56,85] also report using a whole-brain estimate of ∆%CBFHO, with the difference that, in the current paper, the value was computed for each participant. In the equation defining M (Gauthier and Hoge [59], equation 7), the parameter α, which expresses the relationship between changes in blood flow and blood volume, was assumed to be 0.18 [70] while β, defining the non-linear dependence of changes in R2* on deoxygenated hemoglobin, was set to 1.5 [71]. The hemoglobin concentration [Hb] was assumed to be 15 g Hb/dl blood, although this can be readily measured using a venous blood draw. It was also assumed that oxygen consumption remained constant during periods of hypercapnia and hyperoxia (CMRO2HC and CMRO2HO). The sensitivity of QUO2 model-derived estimates to the assumed parameters was also evaluated, as detailed in the section ‘Accuracy of QUO2 model-derived estimates - sensitivity to systematic errors’.
2.4.4.3. Tissue segmentation
Automated segmentation of grey matter (GM) from the anatomical scans was carried out using the FMRIB Software Library (FSL) [113]. Structural images were extracted from T1 -weighted scans using the brain extraction tool (FSL’s BET). Then, a binary mask delineating the brain was created along with a probability mask of GM employing the automated segmentation tool (FSL’s FAST). Both were resampled to the resolution of the functional EPI scans.
2.4.4.4. Regions Of Interest
In addition to the whole brain grey matter (GM), six ROIs in ICBM space were selected from OASIS-TRT-20 in three-dimensional mode [114]. The selected ROIs are located in parietal, occipital or temporal lobes, and are known to be implicated in conditions such as Alzheimer’s disease [16,115-119]. ROI’s, presented in Figure 2.1, include left and right: inferior parietal (IP), superior parietal (SP), precuneus (PRE), hippocampus (HIP), anterior (caudal and rostral) cingulate (AC) and posterior cingulate (PC). Each ROI was registered to the resolution of the functional EPI scans before being conjoined with the individual’s GM probability mask excluding voxels with a GM probability lower than 50% and non-parenchymal voxels identified previously. The resultant ROI probability masks were used to perform weighted averaging of the different metrics. Voxels where no solution was found for
Figure 2.1. Regions of interest (ROIs)
QUO2 parameters were evaluated in GM and in six ROIs selected from the OASIS-TRT-20 atlas.
2.4.4.5. Registration
Individual BOLD, CBF, M, OEF and CMRO2 maps were non-linearly normalized to the ICBM152 template using the CIVET software package [120] via the CBRAIN tool [121] with 12 degrees of freedom using trilinear interpolation. Test A and B average maps of BOLD and CBF were computed as arithmetic means using in-house software. On their part, average maps of M, OEF and CMRO2 were obtained excluding from the average any voxels where no solution was found
2.4.5. Statistical Analysis
Within each measurement, i.e. CBF, BOLD (R2*), M, OEF and CMRO2, Test A and Test B were averaged and compared across ROIs, considering P < 0.05 level of significance, correction for multiple comparisons.
Inferior Parietal (IP) Hippocampus (HIP) Superior Parietal (SP) Precuneus (PRE) Anterior Cingulate (AC) Posterior Cingulate (PC)
Statistical tests were performed on the data to ensure it satisfied the criteria for conducting a reproducibility analysis. For ETO2 and the other parameters listed above, the distribution of differences was tested for normality using the Shapiro-Wilk W-test, and the independence between the magnitude of differences and mean of measurements was verified using a rank correlation coefficient (Kendall’s τ). If the differences distribution appeared to deviate from a normal distribution, or if the magnitude of differences increased with the mean of measurements, the data were transformed on the log10 scale and the verification was repeated. In cases where the log10 scaled data satisfied the criteria, the reproducibility was assessed on these scaled values. Otherwise, assessment of reproducibility was based on the original values along with appropriate annotation [122-124]. Additionally, to determine whether there was an order effect between the two tests, we performed a two-tailed paired t-test on each set of ROI-averaged values, considering a P < 0.05 level of significance.
ROI-averaged reproducibility was evaluated using Matlab to compute metrics that give complementary information on the agreement between repeated measures and population variance:
a) dSD, the standard deviation of the differences between Test A and B measurements.
b) wsSD, the within-subject standard deviation, equals dSD/√2 considering two measurements.
c) wsCV, the within-subject (or intra-subject) coefficient of variation, as used in Floyd et al. [123] and Chen et al. [125]. wsCV=√ [mean of the (wsSD/subject mean)2]. wsCV provides an unbiased reproducibility measurement expressed as a percent of the mean with a low wsCV indicating a high reproducibility. When data were on the log10 scale, wsCV was approximated by 10^(wsSD)-1 [126].
d) CR, the coefficient of repeatability [127] = 1.96*√2*wsSD or 1.96*dSD. CR gives an estimate of the range of values one would obtain in a retest measurement. Thus, 95% of repeated measures for the sample will lie between the interval mean differences ± CR (⍺=0.05).
e) bsCV, the between-subject (or inter-subject) coefficient of variation as computed in Tjandra et al. [128]. bsCV = SDpooledData / meanpooledData * 100.