Volume and Blood Pressure
Overlap of Genetic Loci Produced by Bivariate, Whole-Genome
Linkage Analyses
Peter Kochunov, PhD; David Glahn, PhD; Jack Lancaster, PhD; Anderson Winkler, MD;
Jack W. Kent, Jr, PhD; Rene L. Olvera, MD; Shelley A. Cole, PhD; Thomas D. Dyer, PhD;
Laura Almasy, PhD; Ravi Duggirala, PhD; Peter T. Fox, MD; John Blangero, PhD
Background and Purpose—The volume of T2-hyperintense white matter (HWM) is an important neuroimaging marker of cerebral integrity with a demonstrated high heritability. Pathophysiology studies have shown that the regional, ependymal, and subcortical HWM lesions are associated with elevated arterial pulse pressure and arterial blood pressure (BP), respectively. We performed bivariate, whole-genome linkage analyses for HWM volumes and BP measurements to identify chromosomal regions that contribute jointly to both traits in a population of healthy Mexican Americans. Our aims were to localize novel quantitative trait loci acting pleiotropically on these phenotypes and to replicate previous genetic findings on whole brain HWM volume and BP measurements.
Methods—BP measurements and volumes of whole-brain (WB), subcortical, and ependymal HWM lesions, measured from high-resolution (1 mm3) 3-dimensional fluid-attenuated inversion recovery images, served as focal quantitative phenotypes. Data were collected from 357 (218 females; mean age⫽47.9⫾13.2 years) members of large extended families who participated in the San Antonio Family Heart Study.
Results—Bivariate genomewide linkage analyses localized a significant quantitative trait locus influencing WB and regional (ependymal) HWM volumes and pulse pressure and systolic BP to chromosomal location 1q24 between markers D1S196 and D1S1619. Several other chromosomal regions (1q42, 10q24-q26, and 15q26) exhibited suggestive linkages. The results of the post hoc analyses that excluded 55 subjects taking antihypertensive medication showed no substantive differences from the results obtained in the full cohort.
Conclusion—This study confirms several previously observed quantitative trait loci influencing BP and cerebral integrity and identifies a novel significant quantitative trait locus at chromosome 1q24. The genetic results strongly support a role for pleiotropically acting genes jointly influencing BP and cerebral white matter integrity. (Stroke. 2010;41:2137-2142.)
Key Words: brain 䡲 brain imaging 䡲 genetics 䡲 hypertension 䡲 leukoaraiosis 䡲 leukoencephalopathy 䡲 magnetic resonance 䡲 MRI
T
he volume of T2-hyperintense white matter (HWM) lesions1is an important neuroimaging marker of cerebralintegrity with a large (55% to 73%) proportion of its intersubject variability attributed to genetic factors.2–5
In-creases in HWM volume are correlated with a decline in cerebral blood flow,6glucose metabolism,7and cognition.8,9
Histopathologically, HWM lesions represent regions of accu-mulation of extracellular water due to focal degradation of the myelin sheath that arise from at least 2 distinct pathogenic mechanisms.10Ependymal lesions are the regions of
periven-tricular gliosis and are thought to be produced by mechanical damages caused to the ependymal lining by the pulsatile
movements of cerebrospinal fluid, a mechanism known as pulse-wave encephalopathy.11The amplitude of the pulsatile
cerebrospinal fluid movements is linked to the pulse pressure (PP), the difference among arterial, systolic blood pressure (SBP)m and diastolic blood pressure (DBP). Elevated PP was shown to be associated with higher ependymal HWM vol-umes, even in normotensive individuals.12,13 In contrast,
subcortical HWM lesions are predominantly the regions of focal cerebral ischemia that are associated with elevated SBP and are thought to be the product of age-related stenosis and loss of permeability of capillaries due to small vessel disorders.10,11
Received May 18, 2010; accepted June 17, 2010.
From the Research Imaging Institute (P.K., D.G., J.L., A.W., R.L.O., P.T.F.), University of Texas Health Science Center at San Antonio, San Antonio, Texas; the Department of Psychiatry (D.G., J.L., A.W.), Yale University & Olin Neuropsychiatric Research Center; and the Department of Genetics (P.K., J.W.K., S.A.C., T.D.D., L.A., R.D., J.B.), Southwest Foundation for Biomedical Research, San Antonio, Texas.
Correspondence to Peter Kochunov, PhD, Dip ABMP, University of Texas Health Science Center at San Antonio, Research Imaging Institute, 7703 Floyd Curl Drive, San Antonio, TX 78284. E-mail [email protected]
© 2010 American Heart Association, Inc.
Stroke is available at http://stroke.ahajournals.org DOI: 10.1161/STROKEAHA.110.590943
2137 by guest on May 3, 2017 http://stroke.ahajournals.org/ Downloaded from by guest on May 3, 2017 http://stroke.ahajournals.org/ Downloaded from by guest on May 3, 2017 http://stroke.ahajournals.org/ Downloaded from
Recent findings by Turner and colleagues4have identified
overlap between genetic loci for the whole-brain (WB) HWM volume and blood pressure (BP) measurements in 488 hyper-tensive sibships.4 Turner and colleagues used bivariate,
whole-genome linkage analyses to identify several significant and suggestive loci for WB HWM and BP measurements, suggesting a high degree of pleiotropy between these traits. In the current article, we pursued to replicate findings by Turner and colleagues4 using bivariate linkage analysis for WB
HWM volume and BP measurements. We performed these analyses in a well-studied population of randomly selected Mexican American families. Our previous research in this population demonstrated significant heritability for HWM volumes and BP traits (Table 1) and showed that the 2 regional HWM volumes shared only a moderate (approxi-mately 21%;G⫽.46⫾0.12;P⫽0.001) fraction of the genetic
variance.5,14Furthermore, we demonstrated that although the
univariate linkage analyses for the HWM and BP traits did not produce statistically significant loci, these analyses have independently showed a locus of suggestive significance on chromosome 1, q24.5,14An additional aim of this article is to
formally test the significance of the overlap between the genes influencing the volume of HWM lesions and those determining the individual variability in arterial BP on chromosome 1 using a bivariate linkage analysis. A bivariate analysis can reveal chromosomal regions that contribute jointly to both traits either through the pleiotropic effects of the same genetic variants or the coincidental effects of closely linked genes.4 Bivariate analysis also greatly improves the
power of genetic discovery and the ability to localize causal beyond what is possible by univariate linkage analyses.4
Methods
Subjects and Measurements
Three hundred fifty-seven (218 females) active participants in the San Antonio Family Heart Study15were recruited as the part of this
study. The Mexican American individuals are from large extended pedigrees selected randomly from the community. Subjects ranged in age from 19 to 85 years of age (47.9⫾13.2 years) and were part of 47 families (9.3⫾8.1 individuals/family; range, 2 to 38). Subjects were excluded for MRI contraindications, history of neurological illnesses, or major neurological event (stroke). At the time of the collection of BP measurements, 122 subjects (77 females; average age⫽54.8⫾13.0) were self-reported to have hypertension and 55 subjects (41 female, average age 58.5⫾12.0 years) were reported to take antihypertensive medications. Additionally, 65 subjects were reported to have Type II diabetes and 13 subjects were reported to have heart disorders. To reduce the possible confounding effects of
the antihypertensive drugs, we repeated all analyses in a cohort that excluded these subjects. This smaller cohort, after removing these individuals, consisted of 302 subjects (177 females) with the average age of 46.3⫾12.7 years and exhibited only slightly lower average SBP (120⫾16.4), DBP (70.1⫾10.6), and PP (50.5⫾13.9) values than those of the full cohort (Table 1). All subjects provided written informed consent on forms approved by the Institutional Review Board of the University of Texas Health Science Center at San Antonio (UTHSCSA).
Collection of the SBP and DBP measurements was detailed in Rutherford et al.14 In short, SBP and DBP measurements were
performed using a random-zero sphygmomanometer on the left arm. Three measurements were performed with 5-minute intervals and average of the last measurements was used as trait values. PP was calculated as the difference between SBP and DBP. Brain imaging and image analysis procedures were described in detail elsewhere.5
Brain images were collected an average of 3.0⫾0.8 years (maxi-mum⫽5.3 years) after the BP measurements. Hence, there is a prospective element to the brain measures. Imaging was performed at the Research Imaging Institute, UTHSCSA, using a Siemens 3-T Trio scanner and a high-resolution 8-channel head coil. Three-dimensional, T2-weighted imaging data were acquired using a high-resolution (isotropic 1 mm), turbo-specho fluid-attenuated in-version recovery sequence with the following parameters: TR/TE/TI/ flip angle/echo train length⫽5 seconds/353 ms/1.8 s/180°/221. Fluid-attenuated inversion recovery images were preprocessed by removal of nonbrain tissue, registration to the Talairach frame, and RF inhomoge-neity correction. HWM regions were manually delineated in 3-dimensioal space using in-house software (http://ric.uthscsa.edu/ mango) by an experienced neuroanatomist with high (r2⬎0.9) test– retest reproducibility. HWM regions were coded as ependymal regions, contiguous with cerebrospinal fluid structures, and subcortical in accor-dance with a technique described in Kochunov et al5and Henry Feugeas
et al.16 The WB HWM volume and the volumes of subcortical and
ependymal HWM were measured for each subject. Genotyping
The details of the genotyping procedure can be found in Kammerer et al.17After DNA was extracted from lymphocytes, fluorescently
labeled primers from the MapPairs Human Screening set (Versions 6 and 8; Research Genetics, Huntsville, Ala) and polymerase chain reaction were used to amplified 417 microsatellite markers spaced at approximately 10-cM intervals across 22 autosomes. An automated DNA sequencer (ABI Model 377 with Genescan and Genotyper software; Applied Biosystems, Foster City, Calif) was used. The average heterozygosity index for these markers was approximately 0.76. The sex-averaged marker map was confirmed by deCODE genetics and markers not on this map were placed by interpolation based on physical location.18
Bivariate, Quantitative Trait Linkage Analysis Quantitative genetic analyses were performed using a variance components methods implemented in SOLAR (sequential oligogenic linkage analysis routines).19 Bivariate quantitative trait linkage
analyses of HWM volumes and BP traits were performed to localize
Table 1. Heritability (h2
) Estimates and the Pattern of Significant Covariance for the WB and Regional HWM Volumes and 3 BP Measurements Trait Average⫾SD h2 P Significant Covariates (P⬍0.05) Variance Explained by Covariates
WB HWM 2.50⫾2.81 cm3 .72 1E-14 Age (5E-14) 28%
Subcortical HWM .61⫾1.34 cm3 .66 4E-11 Age (3E-16) 27%
Ependymal HWM 1.84⫾2.07 cm3 .73 1E-9 Age (2E-9) 20%
SBP 122.6⫾16.6 mm Hg .63 1E-6 Age (1E-3) 11%
DBP 71.3⫾10.8 mm Hg .17 .04 None 0%
PP 51.3⫾14.2 mm Hg .49 1E-4 Age (1E-3), age2(1E-4) 23%
by guest on May 3, 2017
http://stroke.ahajournals.org/
potential quantitative trait loci (QTLs) influencing phenotypic vari-ation to specific chromosomal locvari-ations.19Model parameters were
estimated using maximum likelihood. The hypothesis of significant linkage was assessed by comparing the likelihood of a classical additive polygenic model with that of a model allowing for both a polygenic component and a variance component due to linkage at a specific chromosomal location. The logarithm of odds (LOD) score given by the log10 of the ratio of the likelihood of the linkage and the polygenic model served as the test statistic for genetic linkage. Because unmodified bivariate LOD scores typically involve an extra degree of freedom, we calculated the single locus equivalent LOD for each bivariate localization test. We chose LOD scores of 2.0 and 3.0 as the minimal requirements for the suggestive (likely to occur ⱕ1 times by chance in a genome scan) and significant scores (genomewide probability value⫽0.05), respectively. Similar to pre-vious studies, HWM volumes and BP measurements were trans-formed using the inverse Gaussian transformation to assure normal range for kurtosis and skewness.2– 4 All genetic analyses were
conducted with age, sex, age*sex, age2, age2*sex, and diagnostic status for Type 2 diabetes and heart disorder (encoded as 0 or 1) included as covariates.
Results
Bivarate, genomewide linkage analyses produced 3 signifi-cant (LOD⬎3.0) and several suggestive (LOD ⬎2.0) QTL localizations (Figure; Table 1). The highest LOD score (LOD⫽3.82) was observed for the WB HWM and PP analysis at the chromosomal location 1q24, located 200 cM away from the p-terminus (Table 1). A significant linkage
(LOD⫽3.19) was also observed at this same location for the ependymal HWM volume and PP. Additionally, a significant linkage (LOD⫽3.07) between WB HWM volume and SBP was also observed at this location (Figure; Table 1). Bivariate analysis for sublobar HWM volume and BP measurements only reached suggestive levels of significance (Table 1). The highest score (LOD⫽2.68) was observed for SBP at chromosomal location 10q24-q26, located 15 cM away from the p-terminus (Table 1). Additionally, a suggestive linkage site was observed for both regional HWM mea-surements and SBP at the region of chromosome 15q26 (Table 1). There were no significant linkage results for any of the analyses that involved DBP, but a suggestive linkage site was identified on chromosome 10 for both regional HWM volume traits (Table 1).
The results of the post hoc analyses that excluded subjects taking antihypertensive medication showed no substantive differences from the results in the full cohort (Table 2). There were no new significant or suggestive genetic loci observed in the smaller cohort and there were only minute differences in the significance of the peaks. We observed a slight (but nonsignificant) increase in the LOD scores for the ependymal and PP and WB and SBP analyses, from 3.19 to 3.40 and 3.07 to 3.14, respectively. We also observed a slight (nonsignifi-cant) reduction in the significance for the WB and PP 3 analysis from 3.82 to 3.62.
Figure. Bivariate linkage analysis results for WB (top), ependymal (middle), and subcortical (bottom) HWM volumes (bottom) and 3 measurements of arterial BP.
by guest on May 3, 2017
http://stroke.ahajournals.org/
Discussion
Our study in healthy Mexican Americans individuals aimed to replicate a finding of shared genetic loci between HWM and quantitative BP traits, previously reported by Turner et al4in a study of hypertensive sibships. We performed these
analyses in a cohort of well-characterized population of Mexican Americans. Additional, post hoc analyses were performed in a cohort that excluded subjects taking antihy-pertensive medications. The genetic linkage analyses in both cohorts identified the same regions of significant and sugges-tive linkage and these loci overlapped with several loci reported by Turner and colleagues and with several loci previously identified by the univariate linkage analyses of BP, triglyceride levels, and atherosclerosis traits performed by this and other groups. The highest linkage value (LOD⫽3.82/3.62 full versus normotensive cohorts) was ob-served for the bivariate linkage analysis of WB HWM volume and PP. This locus (chromosome 1q24) was also significant in the bivariate analyses of the WB HWM and SBP and ependymal HWM and PP (Table 2). This locus (1q24) was previously identified by our group as a suggestive locus as a part of the univariate analysis of SBP.14It is known
to harbor the constellation of selectin genes (SELP, SELL, and SELE) and also the coagulation factor V (F5) gene. In particular, the adhesion molecule P-selectin is a marker of potential endothelial dysfunction that has been implicated as a risk factor in essential hypertension20,21 and stroke.20,22
Additionally, platelet-derived gene expression levels of SELP have been observed to be strongly and positively correlated with arterial BP.18,23 This finding was replicated in our
population, in which we observed a highly significant, posi-tive correlation between SELP mRNA expression levels and arterial BP.24No other gene transcripts in this region
exhib-ited such a strong relationship with BP. Therefore, SELP appears to be a strong positional candidate gene that may be responsible for the significant QTLs on chromosome 1. Furthermore, deep sequencing and functional variants analy-ses will be required for true identification.
Locations of 2 suggestive linkages identified by this study overlapped with locations of suggestive linkage reported by Turner et al.4The first overlap was observed for the region on
the chromosome 15, q26 (94 cM), where Turner and col-leagues observed a suggestive QTL for the bivariate analysis of the WB HWM and mean BP. This region was previously shown to be strongly associated with hypertension and regulation of blood lipids by the genomewide association analyses of triglyceride levels.23,24 The second overlap was
observed for the region on the chromosome 1q42 (272 cM), where Turner and colleagues observed a suggestive QTL for the bivariate analysis of WB HWM and PP. This region harbors the angiotensinogen gene and was previously impli-cated by a whole-genome linkage study in hypertensive individuals.25
However, we were unable to replicate findings by Turner and colleagues of the significant QTL on chromosomes 5 (95 cM) and 11(19 cM). Indeed, at these chromosomal locations, our peak LOD scores were only approximately 0.1 to 0.3 (Figure). That lack of complete overlap in genetic loci between these 2 studies could be due several potential issues. Like with all complex disease genetic studies, power to localize such pleiotropic genetic effects can be limited and lead to discrepancies between studies. More fundamentally, genetic factors vary across different ethnicities. The study by Turner and colleagues was focused on populations of Euro-pean ancestry, whereas our study is the first to examine Mexican Americans, a population with significant Native American admixture. If relatively rare variants are involved in the determination of quantitative variability, we may expect considerable differences in the localization of the most important genetic loci across populations.26Linkage studies
of such complex phenotypes cannot be used to exclude genetic regions for important QTLs. Therefore, the lack of concordance cannot be interpreted as evidence against the hypothesis that a QTL exists in a particular genomic region. Additionally, although we identified no significant genomic regions showing joint effects on DBP and HWM volumes, we cannot rule such loci out. Similarly, the lack of identification of genomic regions jointly influencing 2 phenotypes provides no evidence on their overall pleiotropic relationship.
Our findings supported the hypothesis that ependymal and subcortical white matter lesions may have different causal genetic loci.5,11,16,27 We previously showed that ependymal
and subcortical HWM volumes shared only 21% of genetic variance, which suggested that most of the genetic variation is nonoverlapping.5In agreement with the pulse-wave
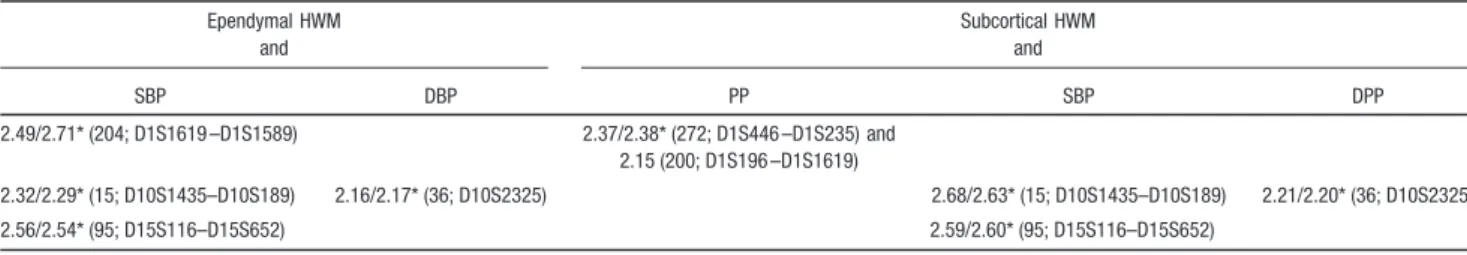
enceph-alopathy mechanism of formation of the ependymal lesions, the linkage results for the bivariate, ependymal HWM volume and PP reached statistical significance (LOD⫽3.19). The linkage results for the subcortical HWM volume only reached suggesting significance, but the highest LOD score (LOD⫽2.68) was observed for the bivariate analysis with the SBP. This region, 10q24-q26, has been identified as a region of significant linkage by univariate analyses of several atherosclerosis traits,28therefore supporting the hypothesis of Table 2. Significant (LOD >3.0; Bold) and Suggestive (LOD >2.0) LOD Scores and Locations (on Marshfield Map, Markers) Between WB and Regional HWM Volumes and Quantitative BP Measurements
Chromosome WB HWM and Ependymal HWM and PP SBP DBP PP 1 3.82/3.62* (200; D1S196 –D1S1619) 3.07/3.14* (203; D1S196 –D1S1619) 3.19/3.40* (200; D1S196 –D1S1619) 10 2.41/2.35* (15; D10S1435–D10S189) 15 2.72/2.71* (94; D15S116–D15S652)
*LOD values were calculated from a smaller cohort, which excluded 55 subjects with hypertension.
by guest on May 3, 2017
http://stroke.ahajournals.org/
a small vessel-mediated origin of subcortical HWM. We did not interpret the lack of the statistically significant linkage between subcortical HWM volume and SBP as an indication that hypertension does not play a role in the formation of the subcortical HWM lesions. The pathogenesis of subcortical HWM lesion is more complex because several additional factors, including age-related, free-radical damage to oligo-dendrocytes, and immune system-mediated gliosis, were shown to contribute to the formation of subcortical le-sions10,29,30 and these factors can reduce the sensitivity of
HWM SBP analysis. Further investigations that include BP measurements in conjunction with systemic markers of infla-tion, as proposed by Alzheimer’s Disease Neuroimaging Initiative,31 will be necessary to help identify the genetic
factors contributing to individual risks of this complex trait.
Limitation
A limitation of this analysis is the coarse, 10 to 15 cM, chromosomal sampling of microsatellite markers. We are in the process of completing a high-density single nucleotide polymorphism analysis in this population. This step will reduce the search space to approximately 500 kb of sequence and further refine to locations of genetic loci.
Sources of Funding
This research was supported by National Institute of Biomedical Imaging and Bioengineering (K01 EB006395) grant to P.K., the National Heart Lung and Blood Institute (P01HL045522) to J.B., and the National Institute of Mental Health (R37MH059490 and R01MH078111) to J.B. and (R01MH0708143 and R01MH083824) to D.G.
Disclosures
None.References
1. Kochunov P, Thompson PM, Coyle TR, Lancaster JL, Kochunov V, Royall D, Mangin JF, Riviere D, Fox PT. Relationship among neuro-imaging indices of cerebral health during normal aging. Hum Brain
Mapp. 2008;29:36 – 45.
2. Carmelli D, DeCarli C, Swan GE, Jack LM, Reed T, Wolf PA, Miller BL. Evidence for genetic variance in white matter hyperintensity volume in normal elderly male twins. Stroke. 1998;29:1177–1181.
3. Reed T, Kirkwood SC, DeCarli C, Swan GE, Miller BL, Wolf PA, Jack LM, Carmelli D. Relationship of family history scores for stroke and hypertension to quantitative measures of white-matter hyperintensities and stroke volume in elderly males. Neuroepidemiology. 2000;19:76 – 86. 4. Turner ST, Fornage M, Jack CR Jr, Mosley TH, Kardia SL, Boerwinkle E, de Andrade M. Genomic susceptibility loci for brain atrophy in hypertensive sibships from the Genoa study. Hypertension. 2005;45: 793–798.
5. Kochunov P, Glahn D, Winkler A, Duggirala R, Olvera R, Cole SA, Dyer TD, Almasy L, Fox P, Blangero J. Analysis of genetic variability and whole genome linkage of whole-brain, subcortical and ependymal hyper-intense white matter volume. Stroke. 2009;40:3685–3690.
6. Kraut MA, Beason-Held LL, Elkins WD, Resnick SM. The impact of magnetic resonance imaging-detected white matter hyperintensities on longitudinal changes in regional cerebral blood flow. J Cereb Blood Flow
Metab. 2008;28:190 –197.
7. Kochunov P, Ramage AE, Lancaster JL, Robin DA, Narayana S, Coyle T, Royall DR, Fox P. Loss of cerebral white matter structural integrity tracks the gray matter metabolic decline in normal aging. Neuroimage. 2009;45:17–28.
8. Kochunov P, Robin D, Royall D, Lancaster J, Kochunov V, Coyle T, Schlosser A, Fox P. Can structural MRI cerebral health markers track cognitive trends in executive control function during normal maturation and adulthood? Hum Brain Mapp. 2009;30:2581–2594.
9. Galluzzi S, Lanni C, Pantoni L, Filippi M, Frisoni GB. White matter lesions in the elderly: pathophysiological hypothesis on the effect on brain plasticity and reserve. J Neurol Sci. 2008;273:3–9.
10. Fazekas F, Kleinert R, Offenbacher H, Schmidt R, Kleinert G, Payer F, Radner H, Lechner H. Pathologic correlates of incidental MRI white matter signal hyperintensities. Neurology. 1993;43:1683–1689. 11. Bateman GA. Pulse-wave encephalopathy: a comparative study of the
hydrodynamics of leukoaraiosis and normal-pressure hydrocephalus.
Neuroradiology. 2002;44:740 –748.
12. Nair GV, Chaput LA, Vittinghoff E, Herrington DM. Pulse pressure and cardiovascular events in postmenopausal women with coronary heart disease. Chest. 2005;127:1498 –1506.
13. Miura K, Soyama Y, Morikawa Y, Nishijo M, Nakanishi Y, Naruse Y, Yoshita K, Kagamimori S, Nakagawa H. Comparison of four blood pressure indexes for the prediction of 10-year stroke risk in middle-aged and older Asians. Hypertension. 2004;44:715–720.
14. Rutherford S, Cai G, Lopez-Alvarenga JC, Kent JW, Voruganti VS, Proffitt JM, Curran JE, Johnson MP, Dyer TD, Jowett JB, Bastarrachea RA, Atwood LD, Goring HH, Maccluer JW, Moses EK, Blangero J, Comuzzie AG, Cole SA. A chromosome 11q quantitative-trait locus influences change of blood-pressure measurements over time in Mexican Americans of the San Antonio Family Heart Study. Am J Hum Genet. 2007;81:744 –755.
15. Mitchell BD, Kammerer CM, Blangero J, Mahaney MC, Rainwater DL, Dyke B, Hixson JE, Henkel RD, Sharp RM, Comuzzie AG, VandeBerg JL, Stern MP, MacCluer JW. Genetic and environmental contributions to cardiovascular risk factors in Mexican Americans. The San Antonio Family Heart Study. Circulation. 1996;94:2159 –2170.
16. Henry Feugeas MC, De Marco G, Peretti II, Godon-Hardy S, Fredy D, Claeys ES. Age-related cerebral white matter changes and pulse-wave encephalopathy: observations with three-dimensional MRI. Magn Reson
Imaging. 2005;23:929 –937.
17. Kammerer CM, Schneider JL, Cole SA, Hixson JE, Samollow PB, O’Connell JR, Perez R, Dyer TD, Almasy L, Blangero J, Bauer RL, Mitchell BD. Quantitative trait loci on chromosomes 2p, 4p, and 13q influence bone mineral density of the forearm and hip in Mexican Americans. J Bone Miner Res. 2003;18:2245–2252.
18. Goring HH, Curran JE, Johnson MP, Dyer TD, Charlesworth J, Cole SA, Jowett JB, Abraham LJ, Rainwater DL, Comuzzie AG, Mahaney MC, Almasy L, MacCluer JW, Kissebah AH, Collier GR, Moses EK, Blangero J. Discovery of expression QTLs using large-scale transcriptional pro-filing in human lymphocytes. Nat Genet. 2007;39:1208 –1216. 19. Almasy L, Blangero J. Multipoint quantitative-trait linkage analysis in
general pedigrees. Am J Hum Genet. 1998;62:1198 –1211.
Table 2. Continued Ependymal HWM and Subcortical HWM and SBP DBP PP SBP DPP 2.49/2.71* (204; D1S1619 –D1S1589) 2.37/2.38* (272; D1S446 –D1S235) and 2.15 (200; D1S196 –D1S1619) 2.32/2.29* (15; D10S1435–D10S189) 2.16/2.17* (36; D10S2325) 2.68/2.63* (15; D10S1435–D10S189) 2.21/2.20* (36; D10S2325) 2.56/2.54* (95; D15S116–D15S652) 2.59/2.60* (95; D15S116–D15S652) by guest on May 3, 2017 http://stroke.ahajournals.org/ Downloaded from
20. Zee RY, Cook NR, Cheng S, Reynolds R, Erlich HA, Lindpaintner K, Ridker PM. Polymorphism in the p-selectin and interleukin-4 genes as determinants of stroke: a population-based, prospective genetic analysis.
Hum Mol Genet. 2004;13:389 –396.
21. Blann AD, Nadar SK, Lip GY. The adhesion molecule p-selectin and cardiovascular disease. Eur Heart J. 2003;24:2166 –2179.
22. Preston RA, Coffey JO, Materson BJ, Ledford M, Alonso AB. Elevated platelet p-selectin expression and platelet activation in high risk patients with uncontrolled severe hypertension. Atherosclerosis. 2007;192: 148 –154.
23. Duggirala R, Blangero J, Almasy L, Dyer TD, Williams KL, Leach RJ, O’Connell P, Stern MP. A major susceptibility locus influencing plasma triglyceride concentrations is located on chromosome 15q in Mexican Americans. Am J Hum Genet. 2000;66:1237–1245.
24. Browning BL, Browning SR. Haplotypic analysis of Wellcome Trust case control consortium data. Hum Genet. 2008;123:273–280.
25. Wang WY, Glenn CL, Zhang W, Benjafield AV, Nyholt DR, Morris BJ. Exclusion of angiotensinogen gene in molecular basis of human hyper-tension: sibpair linkage and association analyses in Australian Anglo-Caucasians. Am J Med Genet. 1999;87:53– 60.
26. Blangero J, Williams JT, Almasy L. Novel family-based approaches to genetic risk in thrombosis. J Thromb Haemost. 2003;1:1391–1397. 27. Bateman GA. Pulse wave encephalopathy: a spectrum hypothesis
incor-porating Alzheimer’s disease, vascular dementia and normal pressure hydrocephalus. Med Hypotheses. 2004;62:182–187.
28. Zhang Q, Lewis CE, Wagenknecht LE, Myers RH, Pankow JS, Hunt SC, North KE, Hixson JE, Jeffrey Carr J, Shimmin LC, Borecki I, Province MA. Genome-wide admixture mapping for coronary artery calcification in African Americans: the NHLBI Family Heart Study. Genet Epidemiol. 2008;32:264 –272.
29. Beckman KB, Ames BN. The free radical theory of aging matures.
Physiol Rev. 1998;78:547–581.
30. Bartzokis G, Sultzer D, Lu PH, Nuechterlein KH, Mintz J, Cummings JL. Heterogeneous age-related breakdown of white matter structural integrity: implications for cortical ‘disconnection’ in aging and Alzhei-mer’s disease. Neurobiol Aging. 2004;25:843– 851.
31. Walhovd KB, Fjell AM, Brewer J, McEvoy LK, Fennema-Notestine C, Hagler DJ Jr, Jennings RG, Karow D, Dale AM. Combining MR imaging, positron-emission tomography, and CSF biomarkers in the diagnosis and prognosis of Alzheimer disease. AJNR Am J Neuroradiol. 31:347–354.
by guest on May 3, 2017
http://stroke.ahajournals.org/
John Blangero
Olvera, Shelley A. Cole, Thomas D. Dyer, Laura Almasy, Ravi Duggirala, Peter T. Fox and
Peter Kochunov, David Glahn, Jack Lancaster, Anderson Winkler, Jack W. Kent, Jr, Rene L.
Print ISSN: 0039-2499. Online ISSN: 1524-4628
Copyright © 2010 American Heart Association, Inc. All rights reserved.
is published by the American Heart Association, 7272 Greenville Avenue, Dallas, TX 75231
Stroke
doi: 10.1161/STROKEAHA.110.590943
2010;41:2137-2142; originally published online August 19, 2010;
Stroke.
http://stroke.ahajournals.org/content/41/10/2137
World Wide Web at:
The online version of this article, along with updated information and services, is located on the
http://stroke.ahajournals.org/content/suppl/2016/03/31/STROKEAHA.110.590943.DC1
Data Supplement (unedited) at:
http://stroke.ahajournals.org//subscriptions/
is online at:
Stroke
Information about subscribing to
Subscriptions:
http://www.lww.com/reprints
Information about reprints can be found online at:
Reprints:
document.
Permissions and Rights Question and Answer
process is available in the
Request Permissions in the middle column of the Web page under Services. Further information about this Once the online version of the published article for which permission is being requested is located, click
can be obtained via RightsLink, a service of the Copyright Clearance Center, not the Editorial Office.
Stroke
in
Requests for permissions to reproduce figures, tables, or portions of articles originally published
Permissions:
by guest on May 3, 2017
http://stroke.ahajournals.org/
60
儿童后循环缺血性卒中的研究
Childhood Posterior Circulation Arterial Ischemic Stroke
Mark T. Mackay, MBBS, FRACP; Sanjay P. Prabhu, MBBS, FRCR; Lee Coleman, MBChB, BSc, FRANZCR
背景和目的 :目前关于儿童后循环动脉缺血性卒中(PCAIS) 的相关研究报道有限,本研究通过对儿童后循环动脉卒中的 临床表现、影像学特点进行分析,探讨儿童与成人PCAIS 在梗死部位、血管畸形情况、危险因素及卒中亚型等方面的差异。 方法 :收集2002 年 8 月至 2008 年 2 月在皇家儿童医院 73 例经影像学证实的儿童 PCAIS 患者临床资料进行前瞻性研究, 应用成人血管定位分类系统,依据后循环梗死部位,将患儿分成近段组、中段组、远段组,同时血管畸形依据畸形部位、 严重程度及随时间进展情况分别进行阐述分析。应用针对儿科改良版的TOAST 分型方法对儿童 PCAIS 进行卒中亚型分型。 结果 :本组募集到的73 例儿童病例,确定 PCAIS 27 名 (37%),影像学上可见 34 个病灶,其中动脉病变部位近段 25 例, 中段2 例,远段 1 例,多节段 6 例 ;血管事件中 14 个累及单病灶,20 个累及多病灶。25 名 PCAIS 患儿中 16 例 MRA 发现异常,其中动脉狭窄8 例,动脉闭塞 8 例。该 16 例患儿经过 12 个月的随访调查结果显示 :血管病变进展者 5 例, 暂时进展后稳定者2 例,血管稳定或改善者 8 例,恢复正常者 1 例。25 名 PCAIS 患儿按卒中亚型分类,非进展的脑血 管狭窄闭塞动脉病9 例,心源性栓塞 4 例,动脉夹层剥离 3 例,烟雾样血管病 3 例,其他明确病因者 4 例,可能病因 1 例以及3 例不明原因者。52% 的儿童 PCAIS 有再发后循环 (6 例 ) 或前循环梗死 (8 例 )。 结论 :非进展动脉病是儿童PCAIS 最常见病因,常会累及后循环动脉的远段。动脉粥样硬化相关危险因素并非儿童 PCAIS 的重要原因,而儿童 PCAIS 存在高复发率。 关键词 :动脉病,心源性,儿童,病因,梗死,后循环,危险因素,卒中,椎基底动脉 (Stroke. 2010;41:2201-2209. 南京军区福州总医院神经内科 吴银燕 译 殷红兵 校 )
全脑及局部性脑白质高信号体积与血压 :
二变量全基因组连锁分析显示的遗传位点重叠
Whole Brain and Regional Hyperintense White Matter Volume and Blood Pressure
Overlap of Genetic Loci Produced by Bivariate, Whole-Genome Linkage Analyses
Peter Kochunov, PhD; David Glahn, PhD; Jack Lancaster, PhD; Anderson Winkler, MD; Jack W. Kent, Jr, PhD; Rene L. Olvera, MD; Shelley A. Cole, PhD; Thomas D. Dyer, PhD;Laura Almasy, PhD; Ravi Duggirala, PhD;
Peter T. Fox, MD; John Blangero, PhD
背景和目的 :脑白质T2 高信号 (HWM) 体积是大脑完整性的重要的神经影像学标志,且有高度遗传性。病理生理学研究 已显示局部、室管膜及皮层下的HWM 损害分别与脉压和动脉血压相关。我们通过对健康墨西哥裔美国人的 HWM 体积 和血压进行二变量全基因组连锁分析,以确定其与两者相关的染色体区域。我们的目的是明确这些表型新的基因多向性 定量性状位点,并复制之前在全脑HWM 体积和血压测量中遗传学的发现。
方法 :血压测量以及高分辨率(1 mm3) 三维液体衰减反转恢复 (FLAIR) 成像测得的全脑、皮层下及室管膜的 HWM 病损体积作
为局部定量表型。数据收集于San Antonio Family Heart 研究中多个扩大家庭的 357 位成员 (218 位女性;平均年龄 47.9±13.2岁)。 结果:二变量全基因组连锁分析确定了影响全脑及局部(室管膜)的HWM 体积及脉压和收缩压的有意义的定量性状位点, 在染色体位置1q24 的标志物 D1S196 和 D1S1619 之间。几个其他染色体区域(1q42, 10q24-q26 和 15q26)显示可能的关 联。事后分析结果时排除了55 个服用降压药者后再得出的结果 , 与整个队列研究的结果无本质区别。 结论 :这一研究证实了几个预先观察的影响血压和大脑完整性的定量性状位点,并识别出位于染色体1q24 的新的有意义 的定量性状位点。这一遗传学结果强烈支持基因多向性的作用共同影响血压及脑白质的完整性。 关键词 :脑,脑部成像,遗传学,高血压,脑白质疏松症,脑白质病,磁共振,核磁共振成像 (Stroke. 2010;41:2137-2142. 暨南大学附属第一医院神经内科 李牧 译 张玉生 徐安定 校 )