UNIVERSITY OF LIÈGE
Faculty of Sciences
The use of Capillary Electrophoresis coupled to
High Resolution Mass Spectrometry as an
Analytical Tool for Biomolecule Analysis
Supervisor
Prof. Edwin De Pauw
Mass Spectrometry Laboratory, ULiège
Co-Supervisor
Prof. Gauthier Eppe
Mass Spectrometry Laboratory, ULiège
Academic year 2018-2019
Dissertation submitted by
Cédric Delvaux
for the fulfilment of the degree of
Doctor of Philosophy in Sciences
Jury
Supervisor Prof. Edwin de Pauw Université de Liège
Co-supervisor Prof. Gauthier Eppe Université de Liège
President Prof. Bernard Leyh Université de Liège
Secretary Dr. Johann Far Université de Liège
Member Prof. Marianne Fillet Université de Liège
Member Prof. Ann Van Schepdael Katholieke Universiteit Leuven
Member Prof. Yannis François
Many people were involved during the completion of this thesis, either directly or indirectly. I received help from numerous people, in my professional environment of course, but also from my personal life. This section aims at expressing my gratitude to those who supported me during these sometimes-demanding years.
Of course, no thesis can be carried out and completed without an appropriate research environment. Consequently, I would like to start by acknowledging the University of Liège and the Mass Spectrometry Laboratory for the facility and the large instrument park, allowing me to get in touch with various instruments, techniques and mass spectrometry expertise. I would also like to thank the University of Liège for the different mandates as a teaching assistant, giving me the opportunity to perform my thesis while teaching chemistry at the same time. This combination was an excellent way for me to explore different professional aspects of chemistry (i.e. teaching and academic research) and allowed me to get further confidence for my future career. A thesis is also the occasion to travel and meet other research groups in (inter)national conferences. I would like to thank the University of Liège for giving me the opportunity to attend many great conferences and meetings. The fruitful discussions and inspiring ideas from these events were the basis of many results developed in this work. The “Patrimoine de l’Université de Liège” is also acknowledged for the financial support.
In the long list of people who should be acknowledged, I would like to start with Professor Edwin De Pauw for the opportunity to be part of his research group. As my promotor, he gave me the liberty of research that many of my coworkers envy and let me freely pursue the research topics I wanted to explore. Also, because of the many different aspects of research he develops at the Laboratory of Mass Spectrometry, fruitful collaborations naturally arise from the daily contact with other PhD students or post-doctoral researchers. Consequently, almost every developed chapter in this thesis relies on a collaborative work.
I would also like to express my gratitude to my jury members, especially Professor Ann Van Schepdael, Professor Marianne Fillet, and Professor Yannis François for accepting to review this manuscript and provide their valuable feedbacks. It is a great pleasure for me. Professor Bernard Leyh and Doctor Johann Far are also thanked for accepting to be respectively the President and Secretary of this thesis jury.
A special thanks must be directed to Dr. Johann Far, who taught me a lot about mass spectrometry, capillary electrophoresis, liquid chromatography and practical aspects of analytical chemistry in general. Since we started working together almost 10 years ago (I was then in my 3rd Bachelor year),
I’ve never stopped learning from him. His pedagogy (although the methods are sometimes quite questionable), encouragements, technical assistance, and especially the constant support he provided me for reviewing presentations, posters, papers as well as discussions on experimental results and interpretation made this PhD thesis possible. The door of his office is always open for advice and help and I can never thank him enough for his decisive contribution to this work, but also during the last 10 years.
It’s always a pleasure for analysts to develop methods that can directly be used by other research groups to address real-life issues. Among his research group, I must specially thank Madeleine Boulanger and Marjorie Dauvin for our great collaborative work on these projects. Madeleine is also warmly thanked for helping me in the design of my thesis cover.
I would also thank Dr. Philippe Massonnet for involving me in his project about the characterization of disulfide bonds connectivity in peptides. As his thesis focused on the use of ion mobility for the study of such structured peptides, I could take advantage of his great knowledge about these systems in our collaboration. Christopher Kune is also acknowledged for the theoretical support and ion mobility experiments in this project... and be an active member of the “Jafar” team.
I would like to thank all the members of the Mass Spectrometry Laboratory for the past six years I have spent in their company. Special thanks go to my colleagues of -1 floor Elodie, Mathieu, Emeline, Caroline, Donatello, Julien and Mitch. The three interconnected offices were always a place for discussions, guidance, shared experience and support. My thesis would have been a lot less fun without my great “-1” colleagues. In particular, Elodie is specially thanked for helping me in various sample preparations, sample list configurations and thoroughly reviewing my thesis to the final version. Gabriel, Nicolas, Dominique, Max, Lisette, Nanou and Nancy are thanked for their technical assistance and access to the Q Exactive when necessary.
Concerning the teaching part of my thesis, I would like to warmly thank Stephane for the last 6 years at the Analytical Chemistry Laboratories. It was a real pleasure for me to be his colleague in this teaching activity. His constant availability and great care in the preparation of the different laboratory sessions were always appreciated. I will miss these Fridays… Dr. Cédric Malherbe is acknowledged as my predecessor for providing me great teaching contents and valuable advice. Enfin, je termine ces remerciements en français pour dire à ma famille et à Jonathan à quel point ils ont été autant de piliers pour moi durant cette aventure, comme à chaque fois. Mes parents, Isabelle et Philippe, sont tout spécialement remerciés pour leur support constant durant mes 5 années d’études et 6 années de thèse, me poussant toujours vers l’avant et me permettant d’arriver où je suis aujourd’hui. Nennenne, en tant que marraine et grand-mère, est également remerciée d’avoir été cette personne si spéciale, éveillant en moi l’appétit d’apprendre et de comprendre et contribuant probablement à façonner la personne que je suis devenue. Ma petite sœur Valentine doit également figurer dans cette liste de personnes proches à remercier. Je suis très heureux de la compter parmi mes proches et la remercie pour ses encouragements « cactus ». Enfin, j’aimerais tout spécialement remercier Jonathan pour son soutien sans faille et sa grande compréhension dans les étapes de finalisation de cette thèse. Savoir que nous pouvons mutuellement compter l’un sur l’autre, peu importe les circonstances de la vie est une grande force, pour laquelle je ne peux lui être que profondément reconnaissant. Je le remercie pour tout ce que nous avons déjà accompli et me réjouis déjà de tout ce que nous accomplirons ensemble à l’avenir.
BGE BackGround Electrolyte CE Capillary Electrophoresis CZE Capillary Zone Electrophoresis
DNA DeoxyriboNucleic Acid
DTIMS Drift Tube Ion Mobility Spectrometry
EOF ElectroOsmotic Flow
ESI ElectroSpray Ionization ETD Electron Transfer Dissociation
FT-ICR Fourier Transform Ion Cyclotron Resonance FT-MS Fourier Transform Mass Spectrometry HCD Higher energy Collision induced Dissociation HPLC High Performance Liquid Chromatography HR-MS High Resolution – Mass Spectrometry
ID Inner Diameter
IM-MS Ion Mobility – Mass Spectrometry IMS Ion mobility Spectrometry
IR InfraRed
IRMPD InfraRed MultiPhoton Dissociation LIF Laser-Induced Fluorescence
LC Liquid Chromatography
m-A2pm meso-2,6-diaminopimelic acid
MALDI Matrix Assisted Laser Desorption Ionisation MRM Multiple Reaction Monitoring
MS Mass Spectrometry
MS/MS Tandem Mass Spectrometry
NACE Non Aqueous Capillary Electrophoresis nanoESI nanoElectroSpray Ionization
OD Outer Diameter
PGN Peptidoglycan
PRM Parallel Reaction Monitoring PTM Post-Translational Modification
RNA RiboNucleic Acid
RP-HPLC Reversed Phase - High Performance Liquid Chromatography
SIM Single Ion Monitoring
SRM Single Reaction Monitoring
TQ Triple Quadrupole
TOF Time Of Flight
TWIMS Travelling Wave Ion Mobility
UPLC Ultra Performance Liquid Chromatography
UV UltraViolet
CHAPTER 1 ... 13
CHAPTER 2 ... 17
2.1. Capillary Electrophoresis ...19
2.1.1. The discovery of Electrophoresis...19
2.1.2. From Tiselius’ Apparatus to Zone Electrophoresis ...19
2.1.3. The rise of capillary electrophoresis as a versatile separation method ...19
2.1.4. Capillary Zone Electrophoresis ...21
2.1.5. Theory of Capillary Electrophoresis ...21
2.1.5.1. The Electrophoretic Mobility ...21
2.1.5.2. The Electro-Osmotic Flow (EOF) ...22
2.1.5.3. The apparent mobility ...25
2.1.6. The apparent mobility, the migration time and the electropherogram ...26
2.2. Mass Spectrometry ...27
2.2.1. Ionization of the Sample ...28
2.2.1.1. Electrospray ionization (ESI) ...28
2.2.1.2. Nanoelectrospray ionization (nanoESI) ...30
2.2.2. m/z analysis ...31
2.2.2.1. The Fourier Transform - Ion Cyclotron Resonance (FT-ICR) Mass Analyzer ...34
2.2.2.1.1. Ion Cyclotron Resonance...35
2.2.2.1.2. Fourier Transform - Mass Spectrometry ...35
2.2.2.2. The Orbitrap Mass Analyzer ...36
2.2.2.2.1. Description of the Orbitrap...37
2.2.2.2.2. High-Resolution Orbitrap Mass Spectrometry for Quantitative Analysis ...38
2.2.2.3. The Orbitrap vs FT-ICR Mass Analyzers ...39
2.2.2.4. Time-Of-Flight (TOF) Mass Analyzer ...41
2.2.3. Ion Detection and Generation of a Mass Spectrum ...42
2.3. Capillary Electrophoresis coupled to Mass Spectrometry (CE-MS) ...43
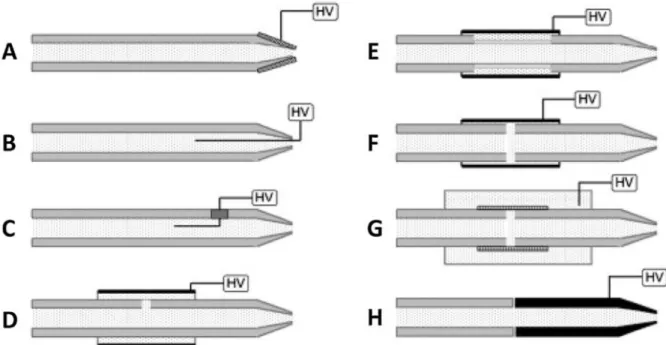
2.3.1. CE-MS Interfaces ...45
2.3.1.1. Electrospray interfaces ...46
2.3.1.1.1. The co-axial sheath-flow interface ...46
2.3.1.1.2. The liquid junction interface ...47
2.3.1.2. Nanoelectrospray interfaces ...48
2.3.1.2.1. Preliminary approaches of the sheathless interface ...49
2.3.1.2.2. The porous sheathless nanospray interface...50
2.3.1.3. Low sheath-flow interfaces ...51
2.4. CE-MS and other separation techniques ...57
2.4.1. Comparison of CE-MS and LC-MS ...57
2.4.1.1. Proteomic analysis ...58
2.4.2. Comparison of CE-MS and IM-MS ...62
2.4.2.1. Drift-time ion mobility spectrometry (DTIMS) ...62
2.4.2.2. Travelling-wave ion mobility spectrometry (TWIMS) ...63
2.4.2.3. IM-MS in analytical chemistry ...64
2.4.2.4. IM-MS for structural analysis ...66
2.4.2.5. Determination of ion’s CCS: experimental CCS and theoretical calculations ...68
2.4.2.6. Structural information provided by IM-MS ...69
2.4.2.7. Comparison of CZE with IMS for the assessment of gas phase and solution structures ...72
2.5. References ...74
CHAPTER 3 ... 85
3.1. Context of the chapter ...87
3.2. Results – published research article in Electrophoresis ...89
3.3. Results – Supporting Information ... 101
3.4. Conclusion and perspectives ... 112
CHAPTER 4 ... 113
4.1. Context of the chapter ... 115
4.2. Results – research article to be submitted in Analytical Chemistry ... 118
4.3. Results - Supporting Information... 135
4.4. Conclusion and perspectives ... 144
CHAPTER 5 ... 145
5.1. Context of the chapter ... 147
5.2. Results – research article submitted in Analytical Chemistry... 149
5.3. Results - Supporting Information... 176
5.4. Conclusion and perspectives ... 184
CHAPTER 6 ... 187
6.1. Context of the chapter ... 189
6.2. Results – short communication to be submitted in Electrophoresis... 193
6.3. Results - Supporting Information... 203
6.4. Conclusion and perspectives ... 205
CHAPTER 1
The interest for Capillary Electrophoresis (CE) as a separation technique has recently reattracted research interest mainly due to the introduction of efficient interfaces for its hyphenation to Mass Spectrometry (MS). As a separation method, CE provides many advantageous analytical aspects including the variety of available electrophoretic modes, rapid analysis, small sample consumption and high separation efficiency. In addition, as the separation mechanism in CE is based on charge and “size” of the analytes, it provides an orthogonal separation to classical liquid chromatography (LC) separations based on partition coefficients between stationary and mobile phases.
The objective of this thesis is to take benefit of the above-mentioned advantages by using Capillary Electrophoresis (CE) coupled to High Resolution Mass Spectrometry (HR-MS) as an analytical tool for the analysis of various biomolecules. In particular, this work aims at deploying CE-MS when analytical challenges are addressed and requires its use, while other separation methods only provide partial information.
The first part of this thesis focuses on the implementation of CE-MS as a valuable analytical method for the analysis of peptides and muropeptides (i.e. glycopeptides associated with the bacterial cell wall). The increased characterization efficiency provided by the CE-MS methods is demonstrated in comparison to established LC(-MS) methods.
A second important part of this thesis was dedicated to the comparison between capillary electrophoresis and ion mobility separations. In this case, these two analytical techniques are both based on ion migration under the influence of an electric field either in the gas phase (ion mobility) or in solution (capillary electrophoresis). The comparison of these techniques first allows to assess their respective separation efficiencies but more importantly, to compare migration behaviors in both separation media. As it will be later detailed in this manuscript, the examination of the migration behaviors at equivalent charge states allows to address the retention of structural features from the solution to the gas phase.
The thesis is divided into seven chapters briefly introduced here below:
Chapter 2 reviews capillary electrophoresis and mass spectrometry and their respective analytical aspects. Various interfaces to hyphenate CE with MS are then reviewed and their advantages and drawbacks are critically discussed. To conclude, CE-MS is compared to classical analytical methods such as LC-MS or more recently IM-MS.
Chapter 3 and 4 demonstrate the analytical merits of CE-MS for the analysis and characterization of peptidoglycan fragments including muropeptides (Chapter 3) and cytoplasmic peptidoglycan-derived peptides (Chapter 4). This work was performed within the framework of a collaboration with the “Centre d’Ingénierie des Protéines” (CIP) or “Center for Protein Engineering” from the University of Liège. In particular, the ability to separate and detect species that are otherwise co-eluted by the classical reversed-phase chromatography method opens new opportunities for in-depth bacterial characterization. An absolute quantitation method was also developed based on an isotopically labelled standard.
Chapter 5 was dedicated to the comparison CE-MS and IM-MS for the separation of peptides bearing two intramolecular disulfide bonds in the gas phase and in solution, respectively. This work was supported by theoretical calculations for the determination of various physicochemical properties of the analytes including structural features in both migration media. Moreover, the comparison of the mobilities determined in the gas phase and in solution allowed to get insights into the influence of the electrospray desolvation process on the structural preservation of these species.
Chapter 6 focuses on the characterization of the electroosmotic flow (EOF) by two separate methods (neutral and charged markers). As this work was entirely performed on a low-sheath flow interface, the characterization of its specific suction effect was also performed and discussed. Finally, Chapter 7 provides a summary of the different analytical methods and results obtained during this thesis and brings some future prospects to be examined.
CHAPTER 2
General Introduction:
The place of Capillary Electrophoresis coupled
to Mass Spectrometry in the analytical toolbox
2.1. Capillary Electrophoresis
2.1.1. The discovery of Electrophoresis
Although electrophoresis has recently regained interest as a versatile analytical technique, its first description goes back to 1807 as Professors Strakhov and Reuss described for the first time the electrophoresis phenomenon on clay particles. In their experiment, they applied a constant electric field on clay particles dispersed in water and noticed the migration of these particles under the influence of the electric field1. Their work also led to the first description of electro-osmosis, which
is discussed in detail in section “The Electro-Osmotic Flow (EOF)”. Further work including experimental and theoretical descriptions of electrophoresis provided the basis for Tiselius’s introduction of electrophoresis as a separation technique by the 1930s2,3. Tiselius was awarded the
Nobel Prize in Chemistry in 1948 "for his research on electrophoresis and adsorption analysis, especially for his discoveries concerning the complex nature of the serum proteins."
2.1.2. From Tiselius’ Apparatus to Zone Electrophoresis
Improvements of Tiselius’ approach and in particular, the introduction of solids (such as paper) or gel matrices to separate compounds into discrete and stable bands (zones) eventually led to the widespread application of electrophoresis in biochemistry. By the 1960s, the constant improvement of gel electrophoresis methods allowed the separation of biologically relevant macromolecules including proteins and nucleic acids, assisting the rise of molecular biology4–7. Finally, the
introduction of electrophoresis performed in open tubes (or capillaries) by Hjertén in 19678
circumvented various frequently encountered problems with gel electrophoresis (long analysis times, low efficiencies, and difficulties in detection and automation). Since then, the development in the manufacturing of narrow capillaries allowed CE to become a high-performance analytical technique.
2.1.3. The rise of capillary electrophoresis as a versatile separation method The development of CE in the last decades has also led to the introduction of various modes of operations, each with a specific separation approach. The major modes of CE include Capillary Zone Electrophoresis (CZE), Capillary Gel Electrophoresis (CGE), Capillary IsoTachoPhoresis (CITP), Capillary ElectroChromatography (CEC), Micellar ElectroKinetic Chromatography (MEKC) and Capillary IsoElectric Focusing (CIEF). The following table summarizes these different modes with a brief overview of their specific separation mechanisms:
Table 2.1 - Modes of operations of capillary electrophoresis and description of the related separation mechanisms
Mode Separation basis Description
CZE Free solution mobility The capillary is filled with an appropriate Background Electrolyte (BGE) and the analytes are separated due to differences in their apparent electrophoretic mobilities. This mode of separation is further detailed in the next section.
CGE Size The capillary is filled with a polymer (e.g. polyacrylamide or agarose) which acts as a molecular sieve during the separation. Principally used for macromolecules such as DNA and SDS-saturated proteins.
CITP Moving boundaries The sample is introduced between a leading electrolyte with a high ionic mobility and a terminating electrolyte with a low ionic mobility. The analytes of interest have an intermediate ionic mobility. The application of the electric field results in a low electrical field in the leading electrolyte zone and a high electrical field in the terminating electrolyte. In fact, the electric field auto-adjusts in each zone to maintain a constant velocity with the lowest field across the zone with the highest mobility. At the end, the analytes migrate at the same velocity as separated zones.
CEC Interaction with a statio-nary phase (not necessa-rily immobilized) under the influence of an electric field
The capillary is either coated with a stationary phase, or the BGE is spiked with solubilized or dispersed stationary phase. The EOF acts as the fluidic pump. The difference of migration is due to the repartition coefficients between the mobile and stationary phases and the electrophoretic mobilities of the analytes, mixing electrophoresis and chromatography in a single device. Typically used for chiral separations were the BGE is spiked with a chiral selector including crown ethers or cyclodextrins.
MEKC Interaction with
(migra-ting) micelles The capillary is filled with a BGE containing surfactants at concentrations above the critical micelle concentration to form surfactant micelles. Differential interactions between the micelle and analytes is the basis for the separation.
CIEF Isoelectric point The capillary is filled with a mixture of analytes and ampholytes. A pH gradient is formed through the capillary using a basic solution at the cathode and an acidic solution at the anode. Focusing takes place as the charged ampholytes and analytes migrate until they reach the region of the gradient corresponding to their pI value. Once the focusing is complete, a mobilization step flushes the zones to the detection point (e.g. by application of pressure).
As can be seen from literature, CE-based methods are rapidly emerging in numerous analytical fields, with the implementation of robust and reliable methods for the analysis of a wide range of analytes. Thanks to its different operation modes, CE is progressively positioning as a central analytical approach for the analysis of major categories of biomolecules due to its versatility and the complementary information compared to other analytical approaches. For example, CE is now a key method for the separation of proteins thanks to CGE9. In addition, CGE is also becoming a
reference method in the biopharmaceutical industry to support analytical characterization, process development, and quality control of therapeutic recombinant monoclonal antibodies (rMAbs)10–13.
In parallel, CE has recently turned into a powerful approach for carbohydrate analyses14 with high
resolution separations of glycans combined to structural identification including positional isomers, as well as the type of linkage15 (alpha or beta linkage). Forensic science has also been largely
impacted by the recent developments of CE where the introduction of CE-based methods for the detection of various drugs in complex matrices constitutes an attractive alternative to HPLC and/or GC methodologies. In the forensic context, CE also plays an essential role in the separation of DNA and the development of methods for high throughput DNA typing16,17. For very large
systems, CE is able to analyze (very) large biological assemblies such as viruses, bacteria, fungi and whole cells18. Finally, the determination of binding constants is also possible thanks to “affinity
CE”19.
Despite the various available CE modes, this thesis focuses on the use of Capillary Zone Electrophoresis coupled to Mass Spectrometry (CZE-MS) for the development of analytical methods. Therefore, only this mode will be described in detail.
2.1.4. Capillary Zone Electrophoresis
Capillary zone electrophoresis (CZE) is the most widely used mode due to its simplicity of operation and versatility. CZE applies for the analysis of a wide range of polar and ionic species20
including biomolecules such as amino acids21, peptides and proteins22 but also a wide range of
enantiomers23 (with the use of chiral selectors). For example, CZE can be applied on proteins for
purity validation, screening charge variants24,25 and conformational studies26,27. In CZE, the
separation is based on the differential migrations of the analytes under the influence of the electric field to form discrete zones in the capillary. Both anionic and cationic analytes can be separated in a single run due to the electro-osmotic flow (see section “The Electro-Osmotic Flow (EOF)” for details). However, CZE does not separate the neutral analytes which co-elute with the EOF. The detection of the analytes is generally performed at the outlet of the separation capillary (as performed for MS) or in a small detection window close to the outlet (as performed for CE-UV for example).
2.1.5. Theory of Capillary Electrophoresis
In capillary electrophoresis, the separation is based on the application of an electric field on a capillary filled with a background electrolyte (BGE). Due to the application of the electric field, two electro-driven phenomena take place within the separation capillary. First, the interaction of the electric field with the ionic analytes leads to their migration due to the electric force that is exerted on them. This phenomenon, referred as the “electrophoretic mobility”, is detailed in the next section. In addition, a bulk solution displacement also takes place due to the application of the electric field. This phenomenon, referred as the “electroosmotic flow”, originates from the diffuse double layer of ions at the capillary surface. The combination of these parameters is responsible for the differential migration of the analytes, and by extension, the detected migration time. In this context, the optimization of both parameters (i.e. electrophoretic mobility and electroosmotic flow) needs to be considered when developing analytical methods. The following sections detail each parameter separately.
2.1.5.1. The Electrophoretic Mobility
The term “Electrophoresis” is defined by IUPAC as “the motion of colloidal particles in an electric field". When electrophoresis is used as a separation method, the separation is based on differential analyte velocities under the influence of an electric field. The velocity of a particular ion is given by equation (1):
v = µe. E (1)
Where v is the velocity of the ion during the electrophoretic process (m.s-1)
µeis the electrophoretic mobility of the ion (m².V-1.s-1)
This equation leads to the definition of the mobility: “the mobility of a specific particle is defined as the ratio of its velocity to the magnitude of the electric field”.
The applied electric field on the capillary is directly determined by the applied voltage during the separation and the length of the capillary. It is therefore identical (and most of the time constant) for all analytes. The electrophoretic mobility, however, is characteristic of the analyte. For a given analyte, its electrophoretic mobility is the direct balance between the electric force exerted by the electric field (equation 2) and the friction force exerted by the surrounding BGE (approximated for a spherical ion) (equation 3), which is the combination of the Stokes (static viscosity) and the Einstein (diffusion and Brownian motion) equations.
Felectric = q. E (2) Ffriction = −6π. η. Rh. v (3) Where q is the charge of the analyte (C)
ηis the viscosity of the background electrolyte (kg.m-1.s-1)
Rh is the ion’s hydrodynamic radius (m)
Once the electric field is applied to the capillary, the ion reaches a steady velocity imposed by the balance between these forces. At this point, these forces apply in opposite directions on the ion, as described by equation 4:
q. E = 6π. η. Rh. v → v = q 6π. η. Rh
E (4)
The comparison between equations (1) and (4) yields the analytical expression of the electrophoretic mobility (equation 5), also known as the Stokes-Einstein equation:
µe = q 6π. η. Rh
(5) This equation implies that:
- highly charged analytes migrate faster than less charged analytes (influence of q) - compact analytes migrate faster than extended analytes (influence of Rh)
- all parameters impacting the viscosity of the migration BGE including temperature, addition of organic solvent, etc… directly influence the migration of all analytes at once It is also important to highlight that for aqueous separations of biomolecules, the charge in solution is directly imposed by the different pKa values of the ionizable residues contained in the structure.
Therefore, the pH of the BGE has a tremendous importance in most analytical methods developed in this work.
2.1.5.2. The Electro-Osmotic Flow (EOF)
Besides the electrophoretic mobility of the analytes, the use of an electric field during electrophoresis generates another electro-driven phenomenon called electro-osmosis. Electro-osmosis consists in a flow of bulk solution inside the capillary upon the application of the electric field. This phenomenon originates from the interaction between the surface of the capillary and the BGE that leads to the formation of a diffuse double layer (accumulation of an excess of charges) in the solution in direct contact with the inner part of the capillary. In general, these charges are
caused by the ionization of groups at the surface by acid-base equilibria. For example, in bare fused silica capillaries, EOF is strongly correlated to pH, highlighting the influence of the ionization of the capillary’s silanol groups (SiOH ⇌ SiO- + H+) in the EOF phenomenon. Alternatively, EOF
was also described in ionizable materials such as PEEK or Teflon, indicating that the non-specific adsorption of ionic species at the surface can also generate EOF.
In fact, the presence of charges at the capillary surface (ionized silanol groups or adsorption of ions) results in an accumulation of counter-ions near the capillary wall to counterbalance these charges. This accumulation of ions can be viewed as two distinct regions. The closest region to the capillary wall, referred as the compact layer, consists in a region where counter-ions are tightly retained by the charges present on the capillary wall. The second part of the double layer constitutes the so-called “diffuse region” where counter-ions are still in excess but not sufficiently retained to prevent migration. Once the electric field is applied across the capillary, the counter-ions of the diffuse layer migrate toward the electrode of opposite charge. Because these counter-ions are hydrated, their migration is accompanied by their hydration spheres, which results in a direct movement of bulk solution. This bulk flow has a typical flat plug-like flow profile, i.e. a flow profile of equivalent velocity across the capillary section. Similarly to the electrophoretic velocity, the EOF velocity can be described by its velocity (equation 6):
v = µEOF. E (6) Where v is the velocity of the electro-osmosis (m.s-1)
µEOFis the electro-osmotic mobility (m².V-1.s-1) E is the applied electric field (V.m-1)
The electro-osmotic mobility is defined by several physico-chemical parameters that are directly linked to the BGE and the double layer. As a result, the electro-osmotic mobility can be expressed as:
µEOF =ε . ζ η (7)
Where ε is the dielectric constant of the BGE (F.m-1or kg.m.V-2.s-2)
ζis the zeta potential (V)
η is the viscosity of the BGE (kg.m-1.s-1)
As can be seen in equation (7), the magnitude of EOF can be regulated by adjusting the capillary surface potential (ζ) or BGE parameters (η and ε). Unfortunately, in most cases, a change in one of these parameters also affects the electrophoretic mobility of the analytes. The consequences of such changes are difficult to predict and need to be carefully assessed in regard with other relevant separation parameters. It is therefore important to consider the optimization of the conditions on both EOF and analyte mobilities to obtain efficient separations.
The dielectric constant and the viscosity of the BGE are directly determined by the BGE composition and can be readily adapted. In particular, the use of organic solvent in the BGE composition can heavily affect these parameters. In contrast, the zeta potential is rather difficult to adjust in a straightforward way but is usually performed by the covalent or absorption coating of polymers to the surface of the inner wall of the capillary.
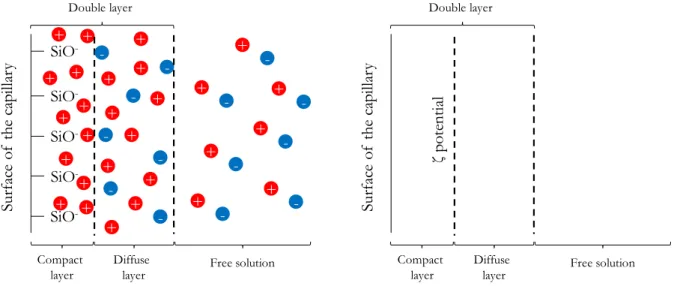
The zeta potential is usually used for colloidal dispersions and can be defined as the electric potential between the shear plane within the double layer (i.e. the plane between the compact and the diffuse layer) relative to a point in the free solution. In the specific context of CE, the zeta potential is usually defined as the potential difference between the free BGE and the compact layer of BGE attached to the inner surface of the capillary. Therefore, the zeta potential is essentially linked to the charge density at the inner surface on the capillary wall, as presented in Figure 2.1:
Figure 2.1 - Schematic representation of the double layer found at the contact point between the BGE and the capillary surface
In the case of bare fused silica capillaries, this charge is directly linked to the ionization of the silanol groups, with significantly greater EOF at high pH (silanols are present as SiO-) than at low
pH (silanols are present as SiOH). Figure 2.2 shows the influence of pH on the electro-osmotic mobility for different materials:
Figure 2.2 - Evolution of the mobility of EOF according to pH for Pyrex, Silica and Teflon capillaries (adapted from Lukacs and Jorgenson28)
The zeta potential is also influenced by the charge density within the free portion of BGE in the capillary. In consequence, the ionic strength of the BGE directly impacts the EOF. Increasing the ionic strength results in a decreased zeta potential and consequently reduces the EOF.
From an analytical point of view, the EOF is often considered valuable but requires a strict control to avoid impairing the resolution of the analyte separation. As Jorgenson and Lukacs showed in early developments29, capillary zone electrophoresis resolution can be compromised if the EOF
mobility is much larger than the electrophoretic mobilities of the analytes. In such cases, a high
+ + + + + + + + + + + SiO -SiO -SiO -SiO -SiO -+ + + + + + + -+ + + -+ -+ -+ -+ -+ -+ -+ Su rf ac e of th e ca pi lla ry Compact layer Diffuse
layer Free solution Double layer -Su rf ac e of th e ca pi lla ry Compact layer Diffuse
layer Free solution
ζ po te nt ia l Double layer
EOF value (generally for high pH in bare fused silica) results in very fast migration of the analytes, with a subsequent incomplete separation.
One of the major advantages of EOF is the ability to resolve all analytes in a single run, regardless of their charge, provided that their electrophoretic mobility is lower than the mobility of the EOF. As the effective mobility of an analyte (µapp) is the superimposition of the intrinsic electrophoretic
mobility and the EOF mobility (see next section, equation 8), the control over EOF is a parameter of importance for analytical method development. In bare fused silica capillaries, the capillary wall is globally negatively charged and the EOF is directed from the anode to the cathode, sweeping all analytes to the cathode. In that case, cations migrate at the highest velocity since their intrinsic electrophoretic mobilities are added to the EOF. Then, the neutrals are all carried out by the EOF and are consequently not separated. Finally, the anions have the lowest velocity since their electrophoretic mobilities are opposed to the EOF.
Among available options to control EOF, a change in the BGE physicochemical properties including concentration, pH or ionic strength, the temperature (affecting multiple parameters such as the viscosity, diffusion and reaction rates) and the use of an organic solvent are the main options. Another frequently applied strategy consists in modifying the capillary surface properties. To this end, the simplest way is to use capillaries of different chemical composition than the traditional bare fused silica such as Teflon28. However, the mainstream strategy relies on the use of dynamic
or covalent coating in bare fused silica capillaries to achieve the desired EOF characteristics30.
Figure 2.3 shows an example of the use of a cationic polymer to reverse the EOF compared to classical bare fused silica EOF:
Figure 2.3 - Upper part: classical EOF direction using bare fused silica capillaries Lower part: reversed EOF direction due to a positively charged coating
The use of coatings is of particular interest since it can reduce, neutralize or even reverse the direction of the EOF according to the nature of the coating. In addition, this strategy can also considerably decrease the adsorption of analytes (such as proteins) onto the capillary wall31.
2.1.5.3. The apparent mobility
The combination of the electrophoretic mobility to the EOF mobility is referred as the apparent mobility (µapp) as described by equation 8:
µapp = µe+ µEOF (8)
Consequently, the apparent mobility is the actual mobility of an analyte under precise experimental conditions. It can be experimentally derived from several experimental parameters, as explained in the following section.
2.1.6. The apparent mobility, the migration time and the electropherogram Experimentally, the relevant parameter for the detection of an analyte during a CE experiment is its migration time. This migration time is defined as the time required for the analyte to migrate through the capillary from the inlet of the capillary to the detection point. According to the method of detection, the detection point is the outlet of the capillary (for example with CE-MS), the position of a contactless conductivity detector or a small window in the capillary for spectroscopic detection (for example with CE-UV).
The detection of the migration time can lead to the apparent mobility (µapp) by equation 9:
µapp = l MT. E=
l. L
MT. V (9)
Where µapp is the apparent mobility of the analyte of interest (m².V-1.s-1) lis the effective length of the capillary to the detector (m)
L is the total length of the capillary (m) MT is the migration time of the analyte (s) V is the applied voltage (V)
E is the applied electric field (V.m-1)
As mentioned above, the apparent mobility is the combination of the electrophoretic mobility of the analyte and the EOF mobility. The measurement of the EOF mobility leads to the determination of the electrophoretic mobility: positive for cations, and negative for anions when the CE experiment is performed in normal polarity, i.e. the positive electrode is applied at the inlet of the capillary. The electrophoretic mobility can directly lead to physicochemical properties of the analyte related to its charge in solution and/or its hydrodynamic radius (equation 5). This highlights the need for the development of reliable EOF measurement methods.
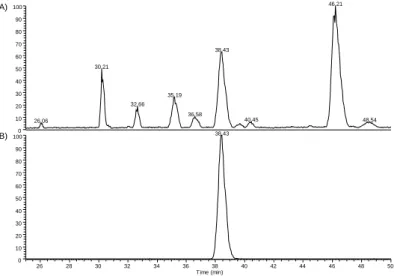
Similar to the chromatogram in HPLC/UPLC, the graphical representation of the migration time through the run is referred as an “electropherogram” where the intensity of a specific analyte’s signal (or the total electropherogram of the different species contained in the sample) is represented as a function of time. Depending on the detection method, the signal’s units in the electropherogram are expressed as the detected units (intensity in a mass spectrum in cps of a specific m/z or absorbance unit AU for example). An example of electropherogram is given in Figure 2.4:
Figure 2.4 - (A) Total ion current electropherogram of different analytes included in a sample analyzed by CZE-MS (B) Extracted electropherogram of a particular analyte of a sample analyzed by CZE-MS
26 28 30 32 34 36 38 40 42 44 46 48 50 Time (min) 0 10 20 30 40 50 60 70 80 90 100 0 10 20 30 40 50 60 70 80 90 100 46.21 38.43 30.21 35.19 32.66 36.58 40.45 48.54 26.06 38.43 (A) (B)
2.2. Mass Spectrometry
Mass spectrometry (MS) is defined as an analytical technique that ionizes chemical species contained in a sample and detects the corresponding ions based on their mass-to-charge ratios (m/z). The detection of these ions is represented by a mass spectrum where the different ion intensities (in relative intensity as presented in Figure 2.5 or in absolute counts per scan or cps) are plotted as a function of the mass-to-charge ratio, as presented in Figure 2.5.
Figure 2.5 - Example of a mass spectrum with a mass range of 400 - 2,000
Because of its very high sensitivity, low limits of detection and versatility, MS has a central place in the analytical toolbox. Indeed, MS is used in a wide range of applications covering both analytical and physical chemistry. In particular, the field of MS has established as a vital bioanalytical tool in many fields such as functional genomics32, proteomics33, metabolomics34, drug discovery35, and
chemical diagnostics36. At the earlier stage of MS development, MS was mainly applied for
fundamental studies such as the study of gas phase reactions37, the elucidation of molecular
structural features38 or the determination of thermodynamic properties of biomolecules39.
Although MS is still developing rapidly, its introduction is not new. Indeed, J.J Thompson is often considered as the father of Mass Spectrometry since he introduced the mass spectrograph in 1897 (see Figure 2.6).
Figure 2.6 - Early design of a Mass Spectrograph by J.J. Thompson
400 500 600 700 800 900 1000 1100 1200 1300 1400 1500 1600 1700 1800 1900 2000 m/z 0 5 10 15 20 25 30 35 40 45 50 55 60 65 70 75 80 85 90 95 100 R e la ti v e A b u n d a n c e 870.33 446.83 892.50 457.83 689.42 914.50 850.33 479.75 924.17 492.25 585.42 721.42 985.42 766.08
MS has constantly progressed through various innovations and development, with the attribution of several MS-related Nobel Prizes. Some of these Nobel Prizes are listed below:
- 1922: the Nobel Prize of Chemistry is awarded to Francis William Aston “for his discovery, by means of his mass spectrograph, of isotopes, in a large number of non-radioactive elements, and for his enunciation of the whole-number rule”
- 1989: half of the Nobel Prize in Physics was awarded to Hans Dehmelt and Wolfgang Paul for the development of the ion trap technique in the 1950s and 1960s
- 2002: the Nobel Prize in Chemistry was awarded to John Bennett Fenn “for the development of electrospray ionization (ESI)” and Koichi Tanaka “for the development of soft laser desorption (SLD) and their application to the ionization of biological macromolecules, especially proteins.”
The general principle of Mass Spectrometry can mainly be represented by a three-step process: 1) ionization of the sample (ionization source)
2) m/z separation in time or space of the produced ions (mass analyzer)
3) ion detection and generation of the mass spectrum (detector and computer treatment) These three different steps are detailed in the following sections.
2.2.1. Ionization of the Sample
In a typical MS procedure, the analytes contained in a solid, liquid or gaseous sample are converted into ions by the ionization source to enter into the mass spectrometer operating in vacuo. During this process, the analytes acquire one or several charge(s) by different mechanisms including electron ejection or capture, (de)protonation, formation of charged adducts or direct transfer to the gas phase of an originally charged species. Depending on the ionization mechanism and the nature of the analyte, the ionization process leads to the formation of either positively or negatively charged ions.
A wide variety of ionization procedures are described and are often classified into hard and soft ionization methods, depending on the amount of energy required for the ionization of the analyte. In general, hard ionization methods such as Electron Impact (EI) are accompanied by substantial fragmentation of the analytes upon ionization. In the extreme case of Inductively Coupled Plasma Mass Spectrometry (ICP-MS), the harsh ionization provided by the plasma atomizes and ionizes the molecular species, leading to the elemental analysis of the sample. Alternatively, soft ionization procedures such as electrospray ionization (ESI) and matrix assisted ionization by laser desorption (MALDI) allow the preservation of entire molecular species. In some cases, large non-covalent assemblies such as DNA quadruplexes40 can even be transferred to the gas phase without
dissociation.
In the present work, the electrospray ionization (ESI) was used throughout the study for its well-suited properties for the direct hyphenation between CE and MS. For this reason, this type of ionization is further detailed in the following section.
2.2.1.1. Electrospray ionization (ESI)
The electrospray ionization was first described in 1984 by Fenn41 for the ionization of proteins.
Fenn and co-workers developed the electrospray interface for mass spectrometry based on the work of Dole and coworkers42 who generated gas-phase ions of macromolecules by spraying a
This ionization technique rapidly became one of the most widely used ionization technique due to its ability to perform qualitative and quantitative analyses on a wide variety of nonvolatile compounds ranging from small molecules to complex high mass biological structures. In this regard, ESI seems to be almost unlimited in the size of transferable molecules in the gas phase, as a study showed the ability of ESI to spray and ionize species up to 5 000 000 Da species with nearly 5000 charges ionized43. In addition, the ability to work at ambient pressure combined to the
possible direct hyphenation to liquid phase separation techniques such as liquid chromatography or capillary electrophoresis made ESI the most commonly equipped ion source on commercial instruments.
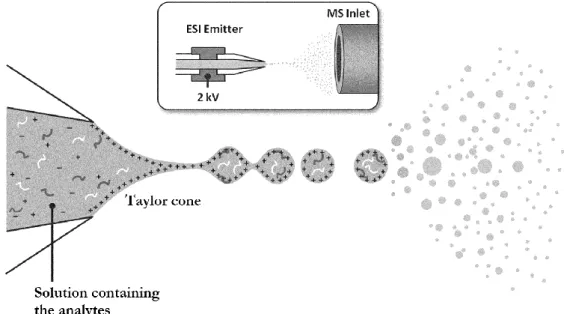
Typically, in ESI-MS, a solution containing the analytes is infused at atmospheric pressure through a thin metallic needle. A high electric potential (generally a few kV) is applied to the needle while the sample flows in the micro to milliliters per minute range to be constantly sprayed at the tip of the metallic needle and form highly charged droplets (i.e. nebulization). In the positive ion mode, the application of the electric potential (in this case, the capillary is set at a positive potential) causes an accumulation of positively charged ions in the solution at the tip. When the appropriate field is reached, the liquid shapes as a ‘‘Taylor cone’’ with a subsequent continuous production of droplets enriched in positive ions. This phenomenon is illustrated in Figure 2.7:
Figure 2.7 - Schematic representation of the Electrospray (ESI) process and the formation of the Taylor cone adapted from Hawkridge et al. 44
Once the droplets are produced in the gas phase, solvent evaporation occurs with a subsequent decrease in the droplet’s radius until the coulombic repulsions between the ions overcomes the surface tension of the droplet, threshold known as the “Rayleigh limit”45–47. This phenomenon leads
to the coulomb fission of the droplets and subsequently, smaller droplets are produced. As evaporation carries on, the daughter droplets also undergo coulomb fissions themselves, leading to a fast reduction in both size and charge of the droplets according to Dole’s model.
The transition between the first droplets to the single desolvated analyte is still a matter of debate. Classically, two mechanisms describe the production of desolvated ions in the gas phase from the droplets, as:
➢ Ion Evaporation Mechanism (IEM)48–50, proposed by Iribarne and Thomson states that
of the mass spectrometer) and before the Rayleigh limit is reached, solvated ions are ejected from the droplets due to the sufficiently high electric field at the surface of the droplet. ➢ Charged Residue Mechanism (CRM)42,51, proposed by Dole: as explained above, a series of
droplet fission events leads to a final droplet containing a single analyte molecule. The last solvent molecules evaporate until the ion is completely desolvated.
Figure 2.8 - Schematic illustration of the Ion Evaporation Mechanism and Charged Residue Mechanism leading to the production of desolvated ions during the ESI process (from
www.chromacademy.com/Electrospray-Ionization-ESI-for-LC-MS)
It is generally assumed that small ions are preferably transferred into the gas phase by the ion evaporation mechanism52–54 while larger ions tend to use the charged residue mechanism55,56. Other
models including a combination of charged residue with field emission57 or a chain ejection model58
(CEM) were also introduced for disordered polymers.
Because extensive solvent evaporation is required in ESI, typical solvents for electrospray ionization are prepared by mixing aqueous solutions with volatile organic solvents such as acetonitrile or methanol. Practically, one needs to notice that, in order to close the electrical circuit within the ESI source, electrons are also involved in the process. Consequently, oxidation (in the positive ion mode) or reduction (in the negative ion mode) of species present in the Taylor Cone also takes place during the ESI process. The current linked to this phenomenon is in the order of a few µA. Typical ESI flowrates range from 1 to 100 µL.min-1 but higher flowrates are sometimes
required for effective hyphenation to HPLC. Most of the time, the ESI process needs to be assisted by a (heated) desolvation gas for efficient desolvation of ions.
The introduction of nanoelectrospray59–61 (described in the following section), characterized by
much lower flowrates, is considered as the most efficient form of electrospray in terms of ionization efficiency. Indeed, the very low flowrate ensures higher ionization efficiency without the need for desolvation gas assistance. Nonetheless this statement is still under debate due to the introduction of other limitations, especially in the field of “native mass spectrometry”62.
2.2.1.2. Nanoelectrospray ionization (nanoESI)
This evolution of the electrospray technique was introduced by Mann and Wilm in 199660. The
term “nanoelectrospray” reflects the nanoliter per minute flowrate range and the size of the generated droplets, which is in the nanometer range instead of the classical micrometer range for ESI.
Indeed, in the conventional electrospray source, the typical flowrate is in the µL or sub-mL.min-1
contrast, the nanoelectrospray source uses a very small spraying orifice in combination with a very low flowrate. In its original form, the nanoelectrospray process directly dictates the flow and consequently, the flow operates without external pumping. The result is that the flow rate of such device is only a few dozen nL.min-1, generating primary droplets with an average diameter lower
than 200 nm, which yield gaseous ions in less fission events and desolvation.
The main advantage of nanoelectrospray is the improved ionization efficiency and ion transmission leading to an improvement in terms of the limit of detection. A recent work by El-Faramawy et al. showed64 that the efficiency of the nanoelectrospray ionization followed an almost linear increase
when the flowrate was lowered from 1,000 to 4 nL.min-1, with a maximum efficiency of about 1%.
In addition, the improved desolvation due to the very low flow rates alleviates the need for nebulizing gas.
Because the droplet fission processes are not critically different between ESI and nanoESI, the major difference originates from processes associated with the dispersion of the liquid into charged droplets and the size of the initial droplets. In general, the main reasons are:
- A time scale influence: as the larger droplets require at least one additional fission event to reach the necessary size for ion release to occur, the formation of ions happens later when starting with initially larger droplets
- A solvent evaporation influence: the solvent contained in the initial droplet need to sufficiently evaporate to reach the necessary charge density for fission to occur. This evaporation results in an increase in both analyte and salt in the droplet. As a result, more fissions mean higher salt concentration in the final droplets.
- A last but not least phenomenon is the use of nanoESI, especially with CE or nano-liquid chromatography has a higher sample-to-volume ratio, which affects the physicochemical properties of the liquid phase being sprayed.
As a result, nanoelectrospray generally provides a higher tolerance towards salt concentration60,61
due to the minimization of ion suppression and matrix effects, which can be problematic using conventional ESI.
Finally, it should be stressed out that the development of nanoelectrospray is still an ongoing process, mainly due to the key role of the emitter for an efficient nanoelectrospray. Indeed, the emitter tip architecture heavily impacts the Taylor cone formation and optimal parameters for efficient nanoelectrospray need to be carefully selected.
2.2.2. m/z analysis
After the production of the gas-phase ions by the ion source, these ionic species are separated according to their mass-to-charge ratios (m/z) by the mass analyzer. As a consequence, multiply charged species (such as those produced by the ESI process for example) present m/z ratios that are fractions of their actual masses.
The ions are either space-resolved or time-resolved according to the hardware of the mass analyzer. There is a relatively large variety of mass analyzers, which are all based on the use of static or dynamic electric and/or magnetic fields. The characteristics of a specific mass analyzer lie in the way it uses these fields to measure the m/z ratio of ions. Naturally, each setup has advantages and drawbacks that need to be carefully considered for a specific application. Intrinsic properties including ion beam versus ion trapping modes, continuous versus pulsed analysis, low versus high kinetic energies are also important parameters that needs to be considered for a particular
application. For example, trapping systems are particularly suited for multiple stage tandem mass spectrometry (MSn). Alternatively, high resolution mass spectrometers (such as FT-ICR and
Orbitraps) provide exact masses and fine isotopic structures that are interesting for the characterization of unknown analytes65,66. The counterpart to the high mass resolving power is
usually a lower ion transmission efficiency leading to a worse detection limit of the mass analyzer. A great strength of MS lies in the constant development and improvement of mass analyzers. The best example of the continuous development is the introduction on the market of a new type of mass analyzer, the Orbitrap, in 2005. Additionally, the existing mass analyzers are constantly improved, leading to more reliable, better performing instruments. Another important trend in MS is the coupling between different mass analyzers into the same instrument to increase their versatility and allow tandem MS analysis to be performed. Some common hybrid instruments are the triple-quadrupole, the quadrupole time-of-flight or the ion trap–FT ion cyclotron resonance (ICR) mass spectrometer which all allow the MS analyst to obtain a mass spectrum resulting from the decomposition of an ion selected in the first analyzer.
In general, five major characteristics are used to assess the performance of a mass analyzer, which are:
- the mass range limit is the maximum m/z the mass analyzer can handle
- the dwell time and the scanning rate (or the analysis speed understood as the scan speed) is the rate at which the mass analyzer measures the m/z ratios over a particular mass range. It is expressed as the range of mass units per second or in mass units per millisecond. This property is critical when a separation method (such as CE and LC) is hyphenated to MS for an efficient sampling of the chromatographic or electrophoretic peaks. In this case, the scan speed needs to be fast enough to obtain a sufficient number of mass spectra per peak, which is expected to be equal or higher than 15 points per peak.
- the ion transmission efficiency is the fraction of ions reaching the detector compared to the total number of ions introduced inside the mass analyzer.
- the mass accuracy is the error (usually mean root square) of the m/z value measured by the mass analyzer typically provided in part per million (ppm). Practically, it is the difference between the measured experimental mass (mexperimental) and the theoretical mass (mtheoretical)
divided by the theoretical mass as expressed below:
mass accuracy =(mexperimental− mtheoretical) mtheoretical
(10)
The mass accuracy is essentially interlocked to the mass resolving power of the mass analyzer. High mass accuracy has important applications, especially for elemental composition for example.
- the resolving power is linked to the ability of a mass analyzer to distinguish close m/z values. Although various definitions of the resolving power exist, it is generally admitted that if ∆m is the smallest mass difference for which two peaks with masses m and m + ∆m are resolved, the definition of the resolving power (R) is R = m/∆m. Alternatively, the resolving power can also be defined for an apparently isolated peak. In this case, the resolution is calculated using the peak width ∆m at x % of valley of the peak height (which is generally taken to be 50 % and ∆m is then referred as the “full width at half maximum” (FWHM). Low or high resolving power usually refers to a value that is equal or greater than about 10,000 (FWHM), respectively. However, there is no exact limit between these two terms. Nowadays, the terms of ultra-high resolving power and even extreme resolving
power were introduced due to the very last development of the mass analyzers such as the Orbitrap and the dynamically harmonized ion cyclotron resonance (ParaCellTM).
The importance of resolution can be directly viewed in Figure 2.9, where different resolutions (provided by different mass analyzers) are directly compared on the same species:
Figure 2.9 - Influence of the mass resolving power (FWHM) on the spectrum obtained for the same species on its 4+ charge state. From top to down: Triple Quadrupole (TQ) or ion trap spectrum at resolution 2,000; Time-Of-Flight (TOF) spectrum at resolution 20,000; Orbitrap spectrum at 60,000 at resolution and Fourier Transform – Ion
Cyclotron Resonance (FT-ICR) spectrum at resolution 200,000 (from De Hoofman and Stroobant 67)
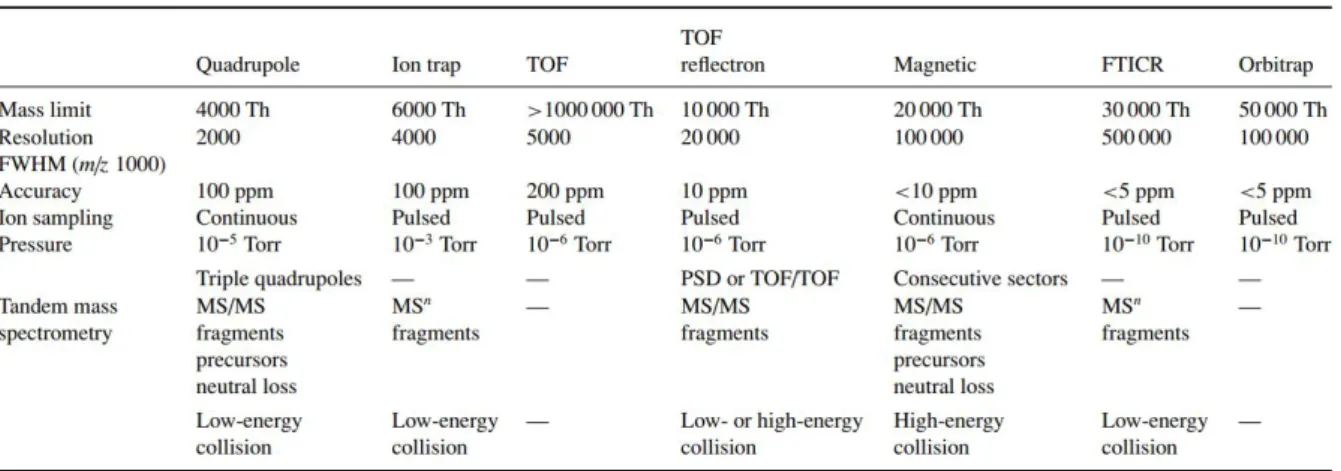
De Hoffmann and Stroobant reviewed the major characteristics of the different mass analyzers available in 2007, as demonstrated in Table 2.2:
Table 2.2 - Various available mass analyzers and their respective characteristic features (from De Hoofman and Stroobant 67)
Because this thesis mainly relied on the application of High-Resolution Mass Spectrometry (HR-MS), only the FT-ICR, Orbitrap and TOF mass analyzers were used throughout the work. For this reason, these particular mass analyzers are further detailed in the following sections.
2.2.2.1. The Fourier Transform - Ion Cyclotron Resonance (FT-ICR) Mass Analyzer The Fourier Transform – Ion Cyclotron Resonance (FT-ICR) mass analyzer uses strong magnetic fields to confine ions within a cell referred as the “Ion Cyclotronic Resonance” cell or ICR cell. In this setup, the ion velocity is kept low in combination with a strong magnetic field to confine the ion on a circular trajectory, therefore referred as “ion cyclotron” or “Penning trap”. The equations related to the ion’s motion are described below. For a particular ion, a balance between a centripetal force (due to the magnetic field) and a centrifugal force (due to the angular velocity of the ion) is created in the ICR cell:
Fcentripetal = q. v. B (11)
Fcentrifugal =m. v 2
r (12) Where q is the charge of the ion (C)
vis the velocity of the ion (m.s-1)
B is the intensity of the magnetic field (T) m is the mass of the ion (kg)
r is the radius of the circular trajectory (m)
The balance of these two forces (combination of equations 11 and 12) results in a stable trajectory of the ion: q. v. B =m. v 2 r or q. B = m. v r (13)
The frequency of the circular trajectory of the ion (f in Hz or s-1) within the ICR cell is then given
by equation 14:
f = v
2π. r (14)
And finally, the angular velocity of the ion (ω in rad.s-1) is given by equation 15:
ω = 2π. f =v r =
q
m. B (15)
Equation 15 shows the direct link between the angular velocity (ω) or the angular frequency (f) of a particular ion and its ratio B×(q/m). Even though the angular frequency and the angular moment are not directly dependent on the ion’s velocity, the radius of its trajectory increases when its velocity increases. When the appropriate excitation energy frequency is applied within the ICR cell, the radius of its trajectory becomes larger than the cell’s dimension and the ion is ejected out of the cell.
Practically, the ICR cell is typically a box (whose geometry is not necessarily cubic) of a few centimeters side which is inserted into a strong magnetic field. The magnetic field is produced by a superconductive magnet which typically yields values around several Tesla (T). For example, the instrument used in this study, the LTQ-FT Ultra Hybrid from Thermo Finnigan, provides a 7T magnetic field but magnets as powerful as 24 T were already tested by 199968.
In FT-ICR mass analyzers, the masses of the ions are deduced by the measurement of their respective angular frequencies. For a 3T magnetic field, the ion cyclotron frequency is 1.65 MHz at 28Da and 11.5 kHz at 4000Da, highlighting the wide range of frequencies that needs to be
measured. Once the frequencies are measured, they are converted into a mass spectrum by use of Fourier transforms or related techniques.
2.2.2.1.1. Ion Cyclotron Resonance
Once a particular ion is in the ICR cell, the irradiation of the ICR cell with an electromagnetic wave that has the same frequency than the ion results in a resonant absorption of this wave, where energy is transferred from the exciting wave to the ion. This energy transfer results in an increase of the ion’s kinetic energy and thus, an increased radius of its trajectory.
The circulation of ions close to the walls of the ICR cell induces an alternative “image current” that can be measured. The principle of ICR cell is then to alternate excitation phases where ions with a specific mass are resonantly targeted by the exciting wave and detection phases where the image current of the excited ions is detected. Efficient detection requires the ions of a given mass to circulate as tight packets on their own orbits, which can be achieved by pulsed excitations.
2.2.2.1.2. Fourier Transform - Mass Spectrometry
The principle of this technique is to simultaneously excite all ions present in the ICR cell by a fast wave (approximatively 1µs) containing a large frequency range. As a result, all ions contained in the ICR cell are simultaneously excited and the increase in the radius of their trajectories bring them close to the detection walls in phase. Then, the resulting image current from the coherently excited trapped ions is detected by the detection plates and converted from the time domain to the frequency domain using Fourier transform. These frequencies are finally used to obtain the mass spectrum as depicted in Figure 2.10:
Figure 2.10 - Conversion of the frequencies (transient signal) detected in an ICR cell by Fourier transform to the corresponding mass spectrum from De Hoofman and Stroobant 67
The excitation of all ions contained in the ICR under a magnetic field B0 cell with a broad-band
radiation with the same energy (provided by the same V0 potential) for the same duration Texc
results in the coherent excitation of all ions to the same orbit. Consequently, the optimization of the excitation wave parameters allows generating the appropriate radius (close to the detection plates) for the efficient detection of the image current:
r =V0. Texc
This equation, demonstrated by Marshall and co-workers69, shows that the radius is indeed
independent of the m/z ratio. However, the cyclotronic frequency of each ion is characteristic of its mass. Thus, broadband excitation using the same voltage at each frequency will propel all the ions onto the same radius, but at frequencies depending on their m/z ratios.
Because the technique is based on a Fourier transform, the resolution of this mass analyzer is linked to the observation time (relaxation time) of the ions within the ICR cell. In the gas phase, the relaxation time is highly dependent on the vacuum quality and on the stability of the ions. If the vacuum value is too low, collisions with residual gas molecules slow down the ions and their motion become incoherent.
To achieve high mass resolving power, a very high vacuum is required in the ICR cell (about 10-5
– 10-6Pa), which is an important limitation to the technique. According to the mass resolving power
applied for the analysis, FTMS can record one mass spectrum in a time window between one and a few dozen seconds. In extreme cases (such as resolution of 500,000 or 1,000,000 and above), the acquisition (dwell time) of one mass spectrum can last more than 1 minute. As a result, this feature is critical when hyphenation with a separation technique is considered.
The dynamic range of such instrument is generally limited due to coulombic repulsions between the ions but these instruments are sufficiently sensitive to detect about 10 ions in the ICR cell. FT-ICR instruments play an important role in the study of gas phase reaction because they enable observation of ions over long time spans. It is also possible to selectively isolate species of interest through intense irradiation at resonance frequencies to only keep a particular m/z of interest for further gas phase investigation. As a result, the high-resolution study of gas phase reactions including slow fragmentation processes70, equilibria between ionic species71 and ion–molecule
reactions72 can be performed by FT-ICR instruments.
Finally, the possibility to select a particular ion of a given m/z in the ICR cell offers a great advantage for MS/MS and MSn experiments. Because the detection is performed in a
non-destructive way, fragmentation experiments can be performed on the same ions that were used for detection. As result, alternance of a phase where the m/z analysis is performed with a phase where a particular m/z is isolated and fragmented (by the use of a collision gas in another mass analyzer, electron capture or by UVPD or IR irradiation) can lead to high-resolution MSn data with the same
pool of ions from the source as the detection is not destructive. 2.2.2.2. The Orbitrap Mass Analyzer
Until recently, FT-MS was exclusively used to refer to FT-ICR mass spectrometry. The combination of the high stability and uniformity of the superconductive magnets with the high accuracy of frequency measurements turned FT-ICR as the most efficient MS-based technique in terms of mass resolving power and mass accuracy. The introduction of ESI and MALDI for the analysis of sometimes large biological molecules turned this ability into an increasing important feature. Furthermore, this trend was also accompanied by an increase in the complexity of the analyzed samples and performance of separation techniques prior to the MS analysis.
These ever-increasing demands for more efficient mass analyzers created the conditions for the appearance of a new type of mass analyzer: the Orbitrap. Similarly to the FT-ICR, the orbitrap is an electrostatic ion trap that uses the Fourier transform to obtain mass spectra. This analyzer was introduced by Makarov as patents73 and scientific literature74 by the end of the 90’s, early 2000.