HAL Id: hal-01108927
https://hal.archives-ouvertes.fr/hal-01108927
Submitted on 19 Feb 2015
HAL is a multi-disciplinary open access archive for the deposit and dissemination of sci-entific research documents, whether they are pub-lished or not. The documents may come from teaching and research institutions in France or abroad, or from public or private research centers.
L’archive ouverte pluridisciplinaire HAL, est destinée au dépôt et à la diffusion de documents scientifiques de niveau recherche, publiés ou non, émanant des établissements d’enseignement et de recherche français ou étrangers, des laboratoires publics ou privés.
Spectroscopic properties of newly flux grown and highly
Yb3+-doped cubic RE2O3 (RE=Y, Gd, Lu) laser
crystals
Matias Velázquez, Philippe Veber, Gabriel Buşe, Yannick Petit, Philippe
Goldner, Veronique Jubera, Daniel Rytz, Anaël Jaffres, Mark Peltz, Volker
Wesemann, et al.
To cite this version:
Matias Velázquez, Philippe Veber, Gabriel Buşe, Yannick Petit, Philippe Goldner, et al.. Spectroscopic properties of newly flux grown and highly Yb3+-doped cubic RE2O3 (RE=Y, Gd, Lu) laser crystals. Optical Materials, Elsevier, 2015, 39, pp.258-264. �10.1016/j.optmat.2014.11.037�. �hal-01108927�
Spectroscopic properties of newly flux grown and highly Yb
3+-doped cubic RE
2
O
3(RE = Y, Gd,
Lu) laser crystals
Matias Velázquez*a, Philippe Vebera, Gabriel Buşea, Yannick Petita, Philippe Goldnerb, Véronique Juberaa, Daniel Rytzc,
Anaël Jaffresb, Mark Peltzc, Volker Wesemannc, Patrick Aschehoughb, Gérard Akab
aCNRS, Université de Bordeaux, ICMCB, UPR 9048, 87 avenue du Dr. A. Schweitzer, 33608 Pessac cedex, France b PSL Research University, Chimie ParisTech – CNRS, Institut de Recherche de Chimie Paris, 75005 Paris, France cFee-GmbH, Struthstrasse 2, 55743 Idar-Oberstein, Germany
Abstract : We have developed laser grade and highly Yb3+-doped cubic rare-earth sesquioxides (RE
2O3, RE = Y, Gd, Lu)
single crystals by means of a newly designed high-temperature solution growth method which gives them spectroscopic properties different from those obtained by high-temperature solidification methods. Absorption and emission cross sections, visible anti-Stokes emission, fluorescence decays of the new cubic Gd2O3:Yb3+ single crystals are presented and
compared to those of Y2O3:Yb3+ and Lu2O3:Yb3+ crystals. The case of cubic Gd2O3:Yb3+ is particularly interesting since its
basic spectroscopic properties have never been detailed and we were capable of achieving Yb-doping level as high as 20%.
1. Introduction
Since at least 20 years,1 the growth and development of laser grade cubic RE
2O3 (RE=Y,Gd,Lu,Sc) single crystals have been
proceeding apace [1-5]. In 2010, a successful power scaling of a single passively mode-locked thin-disk laser cavity was achieved with Lu2O3:Yb3+ crystals which delivered an average power of 141 W under diode pumping at 976 nm [4]. In
2011, it is an impressive 670 W output power that was obtained in CW regime also using thin disk technology with a Lu2O3:Yb3+ crystal [6]. Several methods have again been put forward these last three years to grow pure and RE’3+-doped
(RE’=Tm, Er or Yb) cubic RE2O3 (RE=Y, Lu or Sc) single crystals [2,5,7,8]. In this work, we present spectroscopic
characterizations of newly flux grown cubic and Yb3+-doped RE
2O3 (RE=Y,Gd,Lu) single crystals [5], focusing more
particularly on Lu2O3:Yb3+ and Y2O3:Yb3+ crystals, while also showing the heretofore unknown absorption, stimulated
emission and anti-Stokes emission spectra of highly-doped cubic Gd2O3:Yb3+ crystals. Our flux growth technique validated
with Y2O3:Yb3+ and Gd2O3:Yb3+ crystals laser operation, which exhibited laser efficiencies comparable to those of crystals
obtained by means of other growth techniques [9]. We emphasize that this flux growth process, which uses Li6RE(BO3)3
(RE=Y, Gd, Lu) as the solvent working at half the melting temperature of the corresponding RE2O3, allows to achieve
optimal doping for high-power laser applications, impedes the dissolution of OH- groups in the crystals, avoids the
reduction of Yb3+ ions into Yb2+ ones (and its resulting absorption lines around 600, 520 and 480 nm [10]), favours broader
absorption and emission lines. Such a broadness, as well as anti-Stokes emission spectra, are discussed within the scope of an exhaustive chemical analysis of Lu2O3:Yb3+ and Gd2O3:Yb3+ crystals by GDMS. Moreover, it is found that in Y2O3:Yb3+
crystals, up to an Y3+ substitution rate for Yb3+ cations of 6.5 %, this growth technique drastically hinders the formation
kinetics of Yb3+ pairs that would lead to a cooperative emission around 500 nm [10,11] detrimental to the fluorescence
quantum yield of the Yb3+ ions near infrared (NIR) emission.The intermetallic SmCo
5 was prepared by melting of
stoichiometric amounts of the constituent elements under a purified argon atmosphere in an induction levitation furnace. The purity of the starting materials was as follows: Sm, 99.9%; Co, 99.99%. Before milling, the powder was sieved at 100 μm in a dry-box. SmCo5 particles were obtained by grinding using a Fritsch P5 high-energy apparatus. The ratio weight of
ball over weight of sample is 15 and the rotation speed was fixed at 300 rpm. The diameter of the ball used for grinding is 10 mm. The applied pressure of H2 was 1.1 MPa.
2. Experimental
All the experimental details about the growth and characterization of the samples have been given elsewhere [5,12]. The Yb3+ contents were determined by EPMA/WDS over large facets and the following average compositions in the crystals
that were studied in this work are: Lu1.91Yb0.09O3, Lu1.86Yb0.14O3, Y1.87Yb0.13O3 and Gd1.72Yb0.28O3. So far, the highest
concentrations that we could achieve are Lu1.86Yb0.14O3, Y1.69Yb0.31O3 and Gd1.61Yb0.39O3, and we have not identified the
solubility limit. The ratio of final Yb3+ concentration in the crystals over initial Yb3+ concentration in the growth melt was
determined to be 2.1 in Gd2O3, 1.6 in Y2O3 and 0.9 in Lu2O3. Magnetic susceptibility was measured in field-cooled
mode using a Quantum Design SQUID MPMS XL magnetometer operated in the 4.2−354 K temperature range under an applied magnetic field of 5 mT. A high-temperature HEM-grown Lu1.965Yb0.035O3 crystal from Fee GmbH, of mass 185.7 mg,
and a flux-grown Lu1.86Yb0.14O3 crystal of mass 199.7 mg were mounted in a capsule placed in a straw. The negligibly small
diamagnetic contribution of the capsule was not subtracted from our data. Visible and NIR absorption spectra were recorded with a Varian Cary 5000 spectrophotometer. Continuous-wave emission spectra were collected at room temperature in the visible and NIR spectral range by exciting the sample between 910 and 954 nm, and recorded with a HORIBA Jobin Yvon spectrometer. Exhaustive trace element chemical analysis (75 elements except C, H, O, N) was performed by GDMS on a single crystal of composition Lu1.91Yb0.09O3, and another single crystal of composition
Gd1.72Yb0.28O3.
3. Experimental
3.1 Absorption and emission spectra, Yb3+ ions radiative lifetimes
The absorption and reciprocity method (RM)-calibrated emission spectra of Lu1.91Yb0.09O3 and Y1.87Yb0.13O3 single crystals
have been shown and interpreted elsewhere [5,12]. Yb3+-doped Gd
2O3 absorption spectrum is shown in Fig. 1. Calibration
in cross-section units was performed with a concentration of 3.6 1021 cm-3, that is, 14 % of Yb3+ cations substituted for
Gd3+ ones. Such a concentration is certainly much higher than the concentration that would optimize the experimental
lifetime. This optimum, resulting from the antagonistic effects of self-trapping and concentration quenching, was found to be 1.6 1020 cm-3 in Y
2O3:Yb3+ crystals [13]. The high substitution rate achieved in our crystals should permit to reduce
its thickness down to a few hundred microns, allowing for an efficient cooling while maintaining a high absorption yield under thin-disk laser operation. The fact that the 5-4 transition peaks at 1074 nm proves the cubic structure of the crystals, in which ¾ of the Gd3+ cations exhibit a C
2 point group symmetry and ¼ of them a C3i point group one. Indeed, in monoclinic
Gd2O3 crystals, this transition is shifted at ~1105 nm [14]. The inset in figure 1 shows an energy level diagram and the
transition lines actually observed are compatible with the expected crystal-field Yb3+-ion manifold splitting for the C 2-point
symmetry. The forced electric dipole contribution to this transition oscillator strength is much higher (ffED/fMD~11) in Gd 2O3
than in Y2O3 and Lu2O3 crystals [5]. The radiative lifetime calculated with this absorption spectra, taking a degeneracy ratio
of the 2F
5/2 and 2F7/2 multiplets g(2F5/2)/g(2F7/2)=¾ and an average wavelength ~950.8 nm, is about 0.495 ms. Such a small
value must be corrected by means of Auzel’s method [15]. Indeed, by calculating the oscillator strength and the spontaneous emission probability with, in his notations [15], =1.67 10-20 cm2, =1.417 10-20 cm2, =0.183 10-20 cm2, 0
cm2, and the energy level diagram given in figure 1’s inset to estimate each multiplet’s partition function, we find
g(2F
5/2)/g(2F7/2)1.49, hence a radiative lifetime 0.982 ms, slightly lower than the radiative lifetime estimated for
Y2O3:Yb3+ crystals (1.1 ms, [5,11,12]). The Yb3+-doped Gd2O3 emission spectrum shown in Fig. 1 was calibrated in
cross-section units by the method discussed by Payne et al. [16]. The radiative lifetime necessary to match the Fuchtbauer-Ladenburg (FL)-transformed spectrum with the reciprocity method (RM)-transformed one is ~67 % higher than the correct radiative lifetime determined above. The origin for such a discrepancy is likely to be due to a strong reabsorption effect, which was confirmed by varying the excitation wavelength at 910, 932 and 954 nm. The 53 emission line profiles in our crystals are different from those of Hraïech PhD thesis work [11], in the sense that they are broader (FWHM15.6 vs 13.7 nm in Y2O3:Yb3+ and FWHM15.1 vs 12.4 nm in Lu2O3:Yb3+ crystals [5,11,12]) and that we do not observe any covalence
effect on the cross-section peak value in Lu2O3 with respect to Y2O3 crystals.
The 54 emission line cross-section peak values also are much smaller and the FWHM higher in our samples than in hers [11]. Moreover, the 53 emission peak cross section is ~25% higher in Gd1.72Yb0.28O3 crystals than in Y1.87Yb0.13O3 and
Lu1.91Yb0.09O3 counterparts [5], which is likely to be due to some covalent effect. The transmission spectra measured in the
range 200-800 nm (Fig. 2) also establish the absence of absorption lines due to Yb2+ ions, likely to appear around 600, 520
and 480 nm [10]. FTIR spectra (Fig. 2) were devoid of any absorption line around 3 m in Lu2O3:Yb3+ crystals, and a small
one was detected in Y2O3:Yb3+ crystals which, once adequately corrected for Mie, Rayleigh and Urbach diffractions and
integrated, leads to an OH- concentration [5,11,12] of 2.2 1021 cm-3. Indeed, for the 0-3.4 1021 cm-3 OH--concentration
range in Y2O3:Yb3+ crystals, one can extract an approximate law from Hraïech PhD thesis work [11], nOH-(cm-3)6.9348 1019
A(cm-2), with A being the area below the absorption coefficient (cm-1) (versus wavenumbers (cm-1)) peak assigned to the
OH- groups absorption. In order to check the presence of Yb3+ in Lu
2O3 crystals, as well as that of possible other TM3+
contaminants (TM=transition metal), we measured the magnetic susceptibility, expressed in the MKSA units system, of two single crystals, one Lu1.86Yb0.14O3 flux-grown crystal and one HEM-grown Lu1.965Yb0.035O3 crystal from Fee GmbH (figure
The Lu1.86Yb0.14O3 flux-grown crystal exhibit a Curie-Weiss behavior from ~110 K to at least 354 K, with a Curie constant
C0.097 K and a paramagnetic Curie temperature p-43.1 K, showing that the overall magnetic couplings are
antiferromagnetic, and leading to an effective magnetic moment eff4.29 B/Yb3+. This value corresponds to 94.7% of
the theoretical free ion value. The discrepancy only slightly exceeds the error bar (~5%) and is likely to be due to the ionocovalent nature of the chemical bond. In the HEM-grown Lu1.965Yb0.035O3 crystal, it is not possible to identify a
temperature range broad enough to perform a Curie-Weiss fit. Instead of this, it looks like there are three successive linear segments of the inverse susceptibility over the same temperature range (from ~110 K to 354 K), which suggests that Yb3+ cations are distributed over several crystallographic sites which do not appear in the flux-grown crystal. In
addition, it is obvious that the Curie constant is weaker, which taking into account the weaker Yb concentration, suggests that their magnetic moment is higher than both the effective Yb3+ magnetic moment determined above and the
theoretical free ion value. As Yb2+ cations are isoelectronic with Lu3+ ones, they have no magnetic moment and display a
weak diamagnetic response to the magnetic field. Consequently, we are led to assume that this “multi Curie-Weiss” behavior might be due to the dissolution of paramagnetic impurities, such as Fe3+ (
free-ion5.95 B/Fe3+), Tm3+ (free-ion7.56
B/Tm3+), Gd3+ (free-ion7.94 B/Gd3+) or Er3+ (free-ion9.58 B/Er3+).
3.2 Yb3+-ions fluorescence decays and NIR fluorescence quantum yield
Yb3+-ions fluorescence decays under resonant excitation are exponential over three times the experimental lifetime (Fig.
4), which is 0.93 ms for Y2O3:Yb3+ and 1.02 ms for Lu2O3:Yb3+ single crystals. The former value, when inserted in the exp
versus [Yb3+] curve of Auzel [13], leads to an Yb3+-concentration value consistent with the Yb3+ ions concentrations
characterized by both X-ray diffraction and electron probe microanalysis[5], and turns out to be slightly lower than the highest values (~1 ms) found in the literature [10,11]. The latter value stands among the highest ones ever obtained in this family of crystals, suggesting that Lu2O3:Yb3+ single crystals are optimally doped [10,13]. The emexp storage parameter
around 1030 nm is on the order of magnitude of 7 10-24 cm2.s, that is, one order of magnitude lower than that of
state-of-the-art YAG:Nd3+ crystals at 1064 nm, but still likely to make these crystals competitive for energy storage with a view
to high average or peak output powers delivery in diode-pumped laser operation. The exponential fit is less convincing for the Gd2O3:Yb3+ crystal but however leads to an experimental lifetime 0.48 ms, which is likely to be due to the high
substitution rate. To explain the difference between the experimental and the radiative lifetimes, which leads for example to a fluorescence quantum yield of ~85 % in the Y2O3:Yb3+ crystals, one must consider a series of mechanisms competing
with the radiative one [11,17]. The non radiative multiphonon emission relaxation mechanism can be looked upon as negligible. As a matter of fact, for Y2O3:Yb3+ crystals, several classical and refined gap laws have been established [18-21],
and for E=9704 cm-1 [5], the probability for this mechanism is, to the maximum, ~10-4 s-1. Another mechanism which can
be discarded is that of radiative quenching by excitation of OH- vibrations. Indeed, for the OH- concentration determined
in our Y2O3:Yb3+ crystals, the decay time series of measurements as a function of proton content performed by Hraïech
[11] allows for an estimate of this mechanism’s probability 67 s-1. For the 7.1 1020 - 3.4 1021 cm-3 OH--concentration range
in Y2O3:Yb3+ crystals, one can extract from her measurements an approximate law, OH-(s)-2.1749 10-24 nOH-(cm-3) +
0.0199353, with -1
OH- the contribution of this mechanism to the total non radiative relaxation probability, assumed to be
independent on the other contributions.
3.3 Anti-Stokes (AS) emission spectra, Er3+ and Tm3+ impurity ions fluorescence transients
Looking for relevant mechanisms, such as Yb3+ pairs cooperative luminescence [22] and Yb-RE energy transfers by
upconversion (ETUs) [23-25] competing with the NIR radiative one [17], we carried out anti-Stokes emission spectroscopy on our crystals (Fig. 5). According to the purity assessment performed by means of mass spectroscopy by the raw powder suppliers for 5N Y2O3, 5N Gd2O3, 4N Lu2O3 and 4N or 3N8 Yb2O3 raw powders, the maximum impurity concentration that
we should expect in the initial loads that we prepared for growth runs are gathered in table 1. Figure 5 shows in the three crystals the typical AS emissions from Er3+ (4S
3/2, 4F9/2) and Tm3+ (1G4) ions in the visible range.
At an excitation power of ~1 mW, no AS emission from the Er3+ 2H
9/2 multiplet around 410 nm was observed [11],
suggesting a very low concentration of this ion. In the case of the Lu2O3:Yb3+ crystal a low Er concentration was indeed
found by GDMS analysis. No Li nor B traces are found at the ppm level in Yb2O3, Gd2O3 and Y2O3 starting products and yet
they were found in the final crystal in substantial amount (~3 1017 cm-3), which firmly establishes their dissolution in atomic
forms because their concentration ratio is not that expected from the flux composition. As these impurities were not found in Hraïech crystals [11], we believe they might constitute part of the explanation for the higher inhomogeneous broadening of the 5-3 and 5-4 emission lines observed in our crystal. Another contribution to the inhomogeneous broadening could lie in the elastic strain field arising from flux inclusions, especially in Y2O3:Yb3+ crystals where the
exhaustive GDMS chemical analysis was not possible. Table 1 suggests that our flux growth method has the ability to lower the Er, Tm, Nd, Dy and Fe contents of Lu2O3:Yb3+. The inset in Fig. 5 displays a zoom of the data in the blue-green
spectral range (500-525 nm) together with a convolution of the NIR spectrum by itself indicating the possible peaks likely to arise from cooperative luminescence from Yb3+ pairs (with characteristic lifetime
exp/2). This mechanism usually gives
emission lines in cubic Lu2O3:Yb3+ single crystals at 513 nm [10], 505 and 520 nm [11] and can be related to Yb3+ cluster
formation [26,27]. The absence of such cooperative emission lines in our measurements, even at excitation powers higher than 1 mW, suggests that Yb3+-ions pairs were not formed in the course of our crystal growth process. This might be a
result of hindered formation kinetics due to the fact that the crystals grow at half their melting point temperature, at least for Yb3+ substitution for RE3+ cations rates up to 6 %. As a matter of fact, in the case of Gd
2O3:Yb3+ crystals, the large
substitution rate achieved in this study makes the Yb-pairs formation unavoidable and a very broad emission is observed between 495 and 520 nm, where cooperative emission lines are expected (502 and 517 nm).
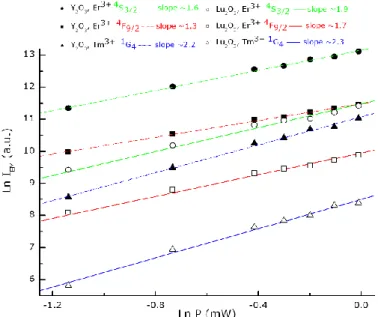
Ln-Ln plots of the AS emission intensity vs excitation power, far from saturation, are shown in Fig. 6 to evidence the two- and three-photon processes involved in the population of the Er3+4S
3/2 and 4F9/2 multiplets, and of the Tm3+1G4 multiplet.
As non radiative phonon emissions relaxations are also involved in these Yb-RE ETUs, there are some deviations from the expected 2 and 3 slopes. In the case of Tm3+ ions, the stronger deviation from the expected value may also arise from
other transfer or emission mechanisms simultaneously at play under these excitation conditions.
Er3+ (4S
3/2) and Tm3+ (1G4) fluorescence transients under non resonant excitation at 976 nm in Lu1.91Yb0.09O3, Y1.87Yb0.13O3 and
Gd1.72Yb0.28O3 crystals are shown in Fig. 7. They exhibit two main features: (i) an intensity rise with a finite characteristic time due to
the multiple photon absorptions, intermediate non radiative decays and Er3+4S
3/2 and Tm3+1G4 multiplets experimental lifetimes; (ii)
once the intensity maximum is reached, a non exponential decay with a decay time related to the Yb3+2F
5/2 multiplet lifetime (typically
exp/2). Since the rise time and the average decay times for both ions dissolved in these crystals are on the order of a few hundreds of
s, it is clear that under high excitation powers, or at high Er3+ and Tm3+ concentrations, such mechanisms are likely to deplete the
Yb3+2F
5/2 multiplet and to increase the heat load released in the crystal. As a first approach, we could fit these transients with
Buisson-Vial’s kinetic model [28] and find that Wrise7967 s-1 and Wdec1415 s-1 for the Er3+4S3/2 AS emission, and that Wrise2417 s-1 and
Wdec2406 s-1 for the Tm3+1G4 AS emission in lutetia crystals. In the case of Er3+4S3/2 fluorescence transient, the higher intensity slope
near t=0, as compared to that of Tm3+1G
4, may also mean that in the former ions a GSA+ESA sequence involving the Er3+4I11/2 multiplet
is efficient in feeding the 2H
11/2-4S3/2 levels, after a fast non radiative relaxation from the 4F7/2 multiplet by multiphonon emission.
3.4 RE3+ impurities partition in the crystals
The rare earth (above all Er, Tm, Nd and Dy) contents in our flux grown crystals probably give the beginnings of an explanation for the trend in laser performances obtained recently [9]. With a pumping wavelength P=977 nm, an
absorption yield of abs98 %, a pump beam diameter of P=60 µm and an output coupler of TOC=4 % in Gd1.72Yb0.28O3 and
of 6 % in Y1.87Yb0.13O3, the following thresholds and laser slopes in quasi continuous regime were obtained:
in Gd1.72Yb0.28O3, Pdp=729 mW, dp=33 %, PTi:Sa=464 mW, Ti:Sa=45 %, and in continuous regime dp=26 % (“dp” means
diode pump);
in Y1.87Yb0.13O3, Pdp=307 mW, dp=58 %, PTi:Sa=212 mW, Ti:Sa=66 %, and in continuous regime dp=51 %.
The main counterintuitive facts about our growth process are twofold: firstly, it permits to reach unprecedented substitution levels, secondly, it dissolves more Yb3+ cations in Gd
2O3 than in Y2O3, and more Yb3+ cations in Y2O3 than in
Lu2O3. Our growth experiments suggest that the solubility limit of Gd2O3 (main solute) in Li6Gd(BO3)3 (solvent) is higher
than that of Yb2O3 (secondary solute), and that the situation is reversed for Lu2O3 (main solute) in Li6Lu(BO3)3 (solvent), in
such proportions that compensate for solid state thermodynamics. As a matter of fact, in the TM impurity concentration range 1019 cm-3 and less, the Li
6Gd(BO3)3 solvent/Gd2O3 crystal partition equilibrium coefficient, k0, reads:
provided that the entropy changes upon dissolution of any TM2O3 in solid Gd2O3 and in liquid Li6Gd(BO3)3, and of Gd2O3 in
liquid Li6Gd(BO3)3, are mainly of vibrational origin. In this expression, LTB,sat and xLTB,sat stand for the activity coefficient and
limits ratio appears as the most important term which is likely to compensate for the “solid state thermodynamics” terms playing a role in the exponentials brackets [29]. S’s and H’s are entropy and enthalpy changes upon dissolution of Gd2O3
in liquid Li6Gd(BO3)3 or any TM2O3 in solid Gd2O3 or in liquid Li6Gd(BO3)3. Dissolution enthalpy changes in high temperature
melts are to be measured by drop calorimetry and cannot a priori be easily calculated. Ulat, G and r symbolize the lattice
energy change upon dissolution in the crystalline state between pure TM2O3 and pure Gd2O3, the Gd2O3 shear modulus
and the ionic radii of Gd3+ and TM3+ cations in the relevant coordination number, respectively. Since any TM3+ solubility
increases with native Schottky defects concentrations in solid Gd2O3 and in liquid Li6Gd(BO3)3, and the same occurs for
Gd3+ in liquid Li
6Gd(BO3)3, one understands that the lower the solubility limit of Gd2O3 in liquid Li6Gd(BO3)3 with respect
to that of any other TM2O3, the lower its contamination by any other TM will be. The ratio of Li over B concentrations
(~0.9 in Lu2O3 and ~4.6 in Gd2O3) clearly discards the presence of solvent inclusions in the investigated samples but the
effect of the solvent is evidenced. A logical consequence of this thermodynamic property of the Li6RE(BO3)3 (RE=Lu,Gd,Y)
solvent is that while Li6Lu(BO3)3 purifies Lu2O3:Yb3+ crystals in Er3+, Tm3+, Nd3+, Dy3+ and Fe3+ impurities, the Li6Gd(BO3)3
solvent contaminates Gd2O3:Yb3+ with the same elements, thus explaining the anti-Stokes emission transients and part of
the fluorescence quantum yield and closely related laser slopes.
4. Conclusions
We have shown that Yb3+-doped cubic RE
2O3 (RE=Y,Gd,Lu) single crystals grown by the widely spread flux method, using
an original and nontoxic solvent, and growth setup design operative in air and at half the melting temperature of these compounds, can be optimally doped for high-power laser applications, without OH- groups dissolution, without Yb3+ ions
reduction into Yb2+ ones and with broader absorption and emission lines in the NIR spectral range. Such a broadness, as
well as anti-Stokes emission spectra, were discussed within the scope of an exhaustive chemical analysis of the samples by GDMS which established that this flux growth process has the ability to purify the lutetia crystals for Er, Tm, Nd, Dy and Fe impurities but contaminates them with Li and B atoms. It is found that up to an Y3+ substitution rate of 6 % this
growth technique drastically hinders the formation kinetics of Yb3+ pairs that would lead to cooperative emission around
500 nm detrimental to the fluorescence quantum yield of the Yb3+ ions near infrared (NIR) emission. Yb3+ absorption and
stimulated emission cross sections in cubic Gd1.72Yb0.28O3 crystals at the zero phonon line were found to reach ~1.6 10-20
and 2.8 10-20 cm2, respectively, and the experimental lifetime ~0.48 ms. The trend in laser slopes is consistent with
fluorescence quantum yield and partly interpreted by means of GDMS trace element analysis.
Acknowledgments
The authors would like to thank the Aquitaine Region, the GIS “Advanced Materials in Aquitaine”, the “pôle de compétitivité” photonics in Aquitaine “Route des Lasers” and the French “Agence Nationale de la Recherche” (decision n° ANR 2010 JCJC 0909 01), for supporting this work.
References
1. A. Yoshikawa and V. Chani, MRS Bulletin, 34 (2009) 266.
2. A. Fukabori, V. Chani, K. Kamada, F. Moretti and A. Yoshikawa, Cryst. Growth & Des., 11 (2011) 2404.
3. R. Peters, C. Kränkel, K. Petermann and G. Huber, J. Cryst. Growth, 310 (2008) 1934.
4. C. Baer, C. Kränkel, C. J. Saraceno, O. H. Heckl, M. Golling, R. Peters, K. Petermann, T. Südmeyer, G. Huber and U. Keller, Opt. Lett., 35 (13) (2010) 2302.
5. P. Veber, M. Velázquez, V. Jubera, S. Pechev. and O. Viraphong, Cryst. Eng. Comm. 13 (16) (2011) 5220. 6. B. Weichelt, K. Wentsch, A. Voss, M. Abdou Ahmed, Th. Graf, Laser Phys. Lett., (2012) 110–115. 7. C. McMillen, D. Thomson, T. Tritt and J. Kolis, Cryst. Growth & Des., 11 (10) (2011) 4386. 8. A. Fukabori, V. Chani, K. Kamada, A. Yoshikawa, J. Cryst. Growth, 352 (2012) 124. 9. Laser demonstration with highly doped Yb3+-Gd
2O3 and Yb3+-Y2O3 crystals grown by an original flux method, Frédéric Druon,Matias
Velázquez, Philippe Veber,Sylvie Janicot, Oudomsack Viraphong, Gabriel Buşe, Marwan Abdou Ahmed, Thomas Graf, Daniel Rytz, Patrick
Georges, Optics Letters, 38 (20) (2013) 4146-4149.
10. V. Peters, Growth and spectroscopy of Ytterbium-doped sesquioxides, PhD thesis, University of Hamburg, Germany, (2001).
11. S. Hraïech, Monocristaux cubiques de sesquioxydes Ln2O3 (Ln=Y, Lu et Sc) et de fluorures CaF2 dopés par l’ion terre rare laser Yb3+ :
croissance, caractérisation structurale et spectroscopie, PhD thesis, University Claude Bernard of Lyon 1, France, (2007).
12. G. Buse, M. Velázquez, Ph. Veber. V. Jubera, Y. Petit, S. Péchev, O. Viraphong, R. Decourt, A. Jaffres, P. Aschehoug, G. Aka,
Proc. SPIE 8433, Laser Sources and Applications, 84331B (June 1, 2012). 13. F. Auzel, G. Baldacchini, L. Laversenne and G. Boulon, Opt. Mater., 24 (2003) 103.
15. F. Auzel, Ann. Télécom., 24 (5-6) (1969) 199.
16. S. A. Payne, L. L. Chase, K. L. Smith, W. L. Kway and W. F. Krupke, IEEE J. Quant. Elect., 28 (11) (1992) 2619. 17. G. Boulon, J. All. Comp. 451 (2008) 1.
18. C. K. Jørgensen, J. Phys. C7, S n° 12, t 48 (1987) 447. 19. M. J. Weber, Phys. Rev., 171 (1968) 283.
20. L. A. Riseberg and H. W. Moos, Phys. Rev., 174 (1968) 429.
21. J. M. F. Van Dijk and M. F. H. Schuurmans, J. Chem. Phys., 78 (9) (1983) 5317.
22. E. Nakazawa and S. Shionoya, “Cooperative luminescence in YbPO4”, Phys. Rev. Lett., 25 (25), (1970) 1710–1712.
23. F. Auzel, Proc. IEEE 61 (1973) 758.
24. F. Auzel, C. R. Acad. Sci. Paris, 262 (1966) 1016–1019. 25. F. Auzel, C. R. Acad. Sci. Paris, 263 (1966) 819–821.
26. B. Schaudel, P. Goldner, M. Prassas and F. Auzel, “Cooperative luminescence as a probe of clustering in Yb3+ doped glasses”, J. Alloys
Comp., 300 (2000) 443–449.
27. P. Goldner, B. Schaudel and M. Prassas, “Dependence of cooperative luminescence intensity on Yb3+ spatial distribution in crystals and
glasses”, Phys. Rev. B, 65 (5), (2002) 054103.
28. R. Buisson and J.-C. Vial, J. Physique-LETTRES, 42, (1981) L115-L118. 29. F. Rosenberger, H. G. Riveros, J. Chem. Phys., 60 (2) (1974) 668-673.
Fig. 1. Absorption and stimulated emission cross-sections of a cubic Gd1.72Yb0.28O3 crystal grown by the flux method. The
excitation wavelength of the Fuchtbauer-Ladenburg (FL)-calibrated spectrum was 932 nm. RM stands for reciprocity method.
Fig. 2. (a) Visible and near UV transmission, uncorrected for reflection losses, of the Yb3+-doped cubic gadolinia (t=3.02
mm) and lutetia (t=1.11 mm) crystals grown by the flux method. (b) FTIR spectra of Yb3+-doped cubic gadolinia, yttria and
lutetia crystals.
Fig. 3. MKSA magnetic susceptibility and inverse magnetic susceptibility of a Lu1.86Yb0.14O3 flux-grown crystal and an
HEM-grown Lu1.965Yb0.035O3 crystal. The blue dashed line is a guide to visualize the Curie-Weiss behavior or what could potentially
be interpreted in terms of such behavior.
Fig. 4. Yb3+ ions fluorescence decays in gadolinia, yttria and lutetia single crystals grown by the flux method, at
em=1030
Fig. 5. Room temperature anti-Stokes emission spectra of Y2O3:Yb3+ (a) Lu2O3:Yb3+ (b) and Gd2O3:Yb3+ (c) single crystals
Fig. 6. Ln-Ln plots of the anti-Stokes emission intensity dependency on excitation power in Y2O3:Yb3+ and Lu2O3:Yb3+ single
Fig. 7. Room temperature anti-Stokes fluorescence transients from levels 4S
3/2 of Er3+- and 1G4 of Tm3+-contaminations in
Yb3+-doped Lu