Remerciements
Je souhaite tout d’abord remercier Sombel Diaham qui a su m’insuffler la passion de la recherche lors de mon stage de recherche, me donnant la conviction nécessaire pour me lancer dans l’aventure de la thèse. J’ai apprécié tout au long de ces presque quatre années ton écoute, nos longues discussions et tout ce tu as pu m’apporter en tant qu’encadrant.
Cette thèse n’aurait sûrement pas été ce qu’elle est sans la présence de Zarel Valdez Nava. Sans lui pour me pousser toujours plus loin je n’aurai pas vécu bien des choses (les USA…). Si je ne devais retenir qu’une chose de ton encadrement, ce serait très certainement la touche de philosophie que tu m’as transmis. Pour tout cela, merci.
Même si son suivi n’est arrivé qu’un peu plus tard, je tiens à exprimer mes sincères remerciements à Lionel Laudebat, tu m’as fait me sentir bien moins seul avec mes simulations.
Je ne saurai parler de ma thèse sans citer Thierry Lebey, ta rigueur scientifique et tes remarques m’ont toujours poussé à me remettre en question, ce qui m’a toujours poussé à me surpasser. Je tiens aussi à t’exprimer ma gratitude pour l’attention particulière que tu as porté une fois ma thèse terminée.
Pour votre confiance et votre soutient à tous les quatre, je vous remercie très chaleureusement.
I would like to make a small break in English to sincerely thank Thomas Jones for having shared his dielectrophoretic passion with me. It was a great honor for me to work with you, I will always remind your kindness and what you brought to my work.
Je tiens à remercier sincèrement les membres de mon jury pour leur présence ainsi que pour les discussions autour de ma thèse.
Vous le savez déjà certainement, mais c’est avec regret que je vous ai quitté, merci à tous les membres du groupe MDCE pour votre gentillesse et la bonne humeur qui fait le cadre de ces années. Pour essayer d’être exhaustif, merci à Jean-Pascal, Marie-Laure, David, Nadine, Philippe, Sorin, Pierre, Vincent et Céline. Et bien sûr tous les docs passés et présents, François Trung, Thomas, Hélène, Lumeï, Zenjebil, Mateusz, Laurent, Thibaut, Louis, Cyril, Ana.
Un grand merci aux personnels techniques qui m’ont aidés lors de cette thèse, une pensée particulière pour les Stéphane et les Benoits.
J’ai comme l’impression d’oublier des gens… Ah oui ! Simon et Cedric, je ne sais pas comment vous remercier pour toutes ces années, les pauses, les déconnades et le Mulligans ? Peut-être en vous disant à très bientôt et bon courage pour vos thèses. (PS : supprimez les photos svp)
Pour tous ceux qui ne sont pas du labo mais qui ont entourés ma vie pendant ces années, merci à vous, ç’aurait été vraiment plus dure sans vous. Max, Yow, les copines, John, Pinpin, Alice, Mélanie, Quentin, les potes du foot, merci encore.
Pour mon frère, merci pour tout, et surtout pour la belle surprise le jour J. A très bientôt à vous trois. Je profite de ce moment pour remercier tous ceux qui sont venu me soutenir le jour de la soutenance, votre présence m’a fait chaud au cœur.
Je voudrais maintenant remercier ceux sans qui cette thèse n’aurait jamais vu le jour (et moi non plus), papa, maman, je vous exprime ma gratitude et mon amour pour tout ce que vous avez fait pour m’emmener là où j’en suis. Sans votre soutient et votre affection, rien de tout cela n’aurait était possible. A tout ceux que je n’ai pas cité, famille, amis, collègues mais à qui je pense, merci.
Foreword
The phenomenon of electric-field-induced particle chaining, and the analogous behavior of magnetic particle in a magnetic field, have intrigued and challenged physicists for many years. The literature contains experimental and theoretical contributions to this topic going back many years. On the experimental front, Muth, reporting the phenomenon in 1927, called the formations “pearl chains”. This highly descriptive term is still in today. On the theoretical front, modeling the chaining force presents difficulty, because as particles in an electric field approach each other, their electrostatic interactions become very rapidly stronger. Mathematical solutions must rely on cumbersome, slowly-converging series expressions.
Why should we be interested in the problem of particle chaining? One important application, the one that Guillaume Belijar has addressed, stems from the technology of smart, structured materials. For composites formulated from particulate dispensed in a matrix, critically important physico-chemical properties can be made strongly anisotropic by forming the particles into oriented chains. Examples include thermal and electrical conductivities and the dielectric constant. The potential significance of anisotropic media created via chaining was recognized long ago; more recently, with the explosion of interest in microscale systems, the range of applicability for such smart materials has burgeoned. Exploiting such enhancements requires a flexible, predictive tool placed in the hands of the engineers who wish to design composites for new applications.
Belijar has performed extensive simulations of the dynamics of dielectric particle chain formation, and has then employed the results to extract chain formation times and to predict the final (quasi)equilibrium morphologies of the chains. He has succeeded in this challenging endeavor by exploiting the effective moment method to calculate the interparticle forces that draw the particles together. The method works because, while interparticle force calculations are very computational resource-intensive when the particles in a large ensemble are touching or very close together, the far simpler dipole-dipole approximation suffices to represent the interactions during most of the time required for the particles to approach each other. A useful analogy might be comparing the time spent by a airplane in flight as the pilot responds to air traffic control instructions (tens of minutes) to the time needed to land the aircraft and bring it to a stop (tens of seconds).
This thesis opens doors for materials scientists and engineers who wish to design and create new, structured composites in a large range of applications. There remains much to learn about the fine details of electric-field-driven particle chain morphology and how it might subtly influence bulk properties, particularly conductivity; the simulation tool Belijar presents to us will assist in this work.
T. B. Jones
Rochester, New York (USA) November, 2016
Table of Contents
INTRODUCTION
I.
MATERIALS
IN
ELECTRICAL
ENGINEERING,
CURRENT
LIMITATIONS AND PROSPECTIVE DEVELOPMENTS
I.1.
Today’s materials ... 7
I.1.a. Materials in systems
... 7
I.1.b. Isotropic materials
... 11
I.1.c. Intermediate conclusion
... 16
I.2.
Emerging materials: anisotropic composites ... 17
I.2.a. Benefits of anisotropy
... 17
I.2.b. Methods for anisotropic composite processing
... 19
I.2.a. Terminology
... 27
I.3.
Conclusion ... 28
II.
DIELECTROPHORESIS: THEORETICAL DESCRIPTION
II.1.
Dielectrophoresis: a brief survey ... 33
II.1.b. Development of the theory and applications
... 34
II.2.
Physical phenomenon ... 39
II.2.a. Polarization
... 39
II.2.b. DEP induced by the electrodes geometry
... 40
II.2.c. DEP in chain formation
... 41
II.3.
Mathematical description ... 43
II.3.a. General form
... 43
II.3.b. Method of the effective dipole moment
... 45
II.3.c. Negative and positive DEP
... 46
II.4.
Modeling of chain formation under electric field... 47
II.4.a. Description of the existing ways to model particle chaining
... 48
II.4.b. Developed model
... 49
II.5.
Conclusion ... 53
III.
CHARACTERIZATION OF THE COMPOUNDS
III.1.
Measurement of the liquid properties ... 57
III.1.a. Principle of dielectric spectroscopy
... 57
III.1.b. Experimental setup
... 58
III.1.c. Dielectric spectroscopy on liquids
... 60
III.1.d. Measurement of the polymer resin viscosity
... 64
III.2.
Measurement of the powders properties ... 65
III.2.a. Estimation from bulk permittivity
... 65
III.2.b. Estimation from mixing rules
... 68
III.2.c. Theoretical description of the crossover frequency
... 71
III.3.
Perspectives ... 76
IV.
EXPERIMENTAL
STUDY
OF
ANISOTROPIC
COMPOSITE
FORMATION: ALIGNED FILLERS
IV.1.
Description of the setups and protocols ... 81
IV.1.a. Preparation of the epoxy/ceramic powder mixtures
... 81
IV.1.b. Experimental setup and protocol for optical observations
... 82
IV.1.c. Experimental setup and protocol for dielectric monitoring of the chaining
... 85
IV.2.
Monitoring the chain formation ... 87
IV.2.a. Evolution of the dielectric properties of the neat epoxy
... 87
IV.2.a. Combined optical and dielectric monitoring of particle chaining at low filler content
87
IV.2.b. Dielectric monitoring at high filler contents... 89
IV.3.
Characterization of the impact of the chaining... 92
IV.3.a. Influence of the process on the dielectric properties
... 92
IV.3.b. Influence of the filler content on the dielectric properties
... 94
IV.3.c. Observation of the composite structures
... 95
IV.4.
Conclusions and perspective ... 97
V.
MODELING THE CHAIN FORMATION AND THE STRUCTURE
IMPACT ON THE COMPOSITE PROPERTIES
V.1.
Dynamics of particle chaining ... 101
V.1.a. Study of the chain structure as a function of the filler content
... 101
V.2.
Computation of the composite dielectric properties: comparison with the
experimental measurements ... 107
V.2.a. Method to compute the composites dielectric properties
... 107
V.2.c. Impact of the volume fraction of particles
... 109
V.2.d. Impact of the particle properties
... 110
V.2.e. Impact of the resin properties
... 111
V.2.f. Impact of the electric field magnitude and waveform
... 113
V.3.
Conclusion and perspectives ... 114
VI.
PROSPECTIVE STUDY OF ANISOTROPIC COMPOSITE WITH
PERPENDICULARLY ORIENTED FILLERS
VI.1.
Context, theory and numerical study ... 119
VI.1.a. Context
... 119
VI.1.b. Mathematical model
... 121
VI.1.c. Determination of the experimental parameters through simulation
... 123
VI.2.
Formation of the composites ... 126
VI.2.a. Perpendicular orientation in liquid state
... 126
VI.2.b. Epoxy-Alumina composite
... 129
VI.2.c. Epoxy-Alumina-BaTiO3 three phase composite
... 131
VI.3.
Conclusion ... 133
VI.4.
Perspectives ... 133
VI.4.a. Perspectives for anisotropic composite with perpendicular orientation
... 133
VI.4.b. General Perspective
... 134
CONCLUSION
REFERENCES
Appendix A: Method to compute the impact of the dipoles on the electric field
Appendix B: Measurements of the electric losses of composites
NOMENCLATURE
Symbol Description
ac Alternating current
C Capacity [F]
D Electric displacement field [C/m²] DEP Dielectrophoresis / Dielectrophoretic
𝐸0 Amplitude (rms) of the external electric field [V/m]
𝜀 Permittivity tensor
𝜀0 Vacuum permittivity (8.854 10-12) [F/m]
𝜀𝑚 Medium dielectric constant
𝜀𝑝 Particle dielectric constant
EHD ElectroHydroDynamic
ER Electrorheology / Electrorheological Φ Electrostatic potential
FDEP Dielectrophoretic force
FEM Finite Element Method
∇ Gradient operator
k Spring constant
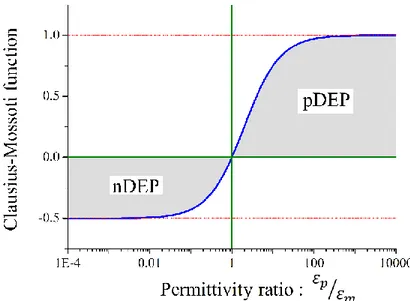
𝐾 Clausius-Mossoti functions
MST Maxwell Stress-Tensor
nDEP Negative Dielectrophoresis
p Dipole moment
peff Effective dipole moment
pDEP Positive Dielectrophoresis 𝑅 Spherical particle radius
ω Pulsation of the electric field [rad/s]
Introduction
1
INTRODUCTION
Materials in electrical engineering are characterized by the very wide variety of their nature and applications. Among them one finds polymers, ceramics, metals, and more. The range of properties, depending on the application, is also quite large, including electrical and thermal conductivity, permittivity, permeability, mechanical characteristics, and optical properties. The systems in which those materials operate can be the transportation of people and goods (cars, aircrafts, and trains), the transport of energy, but also smaller systems such as embedded systems and portable electronics. All of these systems are characterized by their own specific constraints, and material environments can present extreme temperatures (from very low in deep space to very high in aeronautics and power electronics), very high electric fields (in electronic devices at very small scales), extreme pressure (from very low in space to very high in petroleum exploration), reactive chemicals, etc. In almost all applications, the current trend is characterized by the rise of power densities that leads to ever-more severe constraints and smaller devices. This results in demand for increasingly robust materials featuring enhanced properties.
In the field of polymers, different strategies are explored to achieve such enhancements: research on new polymers and copolymers and the study of composites. Regarding the latter materials, the aim is to overcome matrix weaknesses by adding one or several types of fillers. The obtained composite presents a tradeoff between the matrix and filler properties. The types of properties that can be strengthened by the addition of fillers is almost unlimited, notably thermal, electrical, magnetic, mechanical, etc., depending on particle nature. Significant effort has been made to study the impact of particle nature, properties, size, aspect ratio, and dispersion on composite properties. Moreover, a complementary approach related to composites is to control the filler structure to adjust material properties. This is the rise of anisotropic composites.
Fiber-reinforced plastics are a well-known example of anisotropic composites with a polymeric matrix, in which glass or carbon fibers are arranged in specific directions to modify the composite’s mechanical properties. The fibers in these materials provide the stiffness lacked by the polymers. New materials have been developed to create anisotropic composites with properties other than mechanical properties. Perhaps the more relevant example is that of conductive materials made of a polymer matrix blended with carbon nanotubes.
The way to induce anisotropy is not unique, but generally implies one crucial step: the application of an external constraint before or during matrix polymerization. The nature of this constraint can be mechanical, magnetic, or electrical. The latter constraint has proven to be highly promising: easy to use, the ability to address many types of filler, harmless for the matrix, etc. However, among the large number studies, some issues still need to be addressed. The general methodology to elaborate anisotropic
2
composite relies on empirical studies, leading to a lack of knowledge regarding the impact of several parameters on material tailoring. Among those studies treating electric field structuring numerically, to the best of the author’s knowledge, none involve experimental validation directly.
The purpose of this thesis is to address the issues presented in the last paragraph, and more generally to propose strategies to elaborate anisotropic composites with fine control of material properties, in the intended directions.
This thesis dissertation is organized into six chapters. Each chapter is summarized below.
Chapter I
This chapter provides an overview of existing materials, focusing on polymeric materials (pure and as a matrix for the composite). The purpose of this chapter is to define the main properties of materials already used in electrical engineering, as well as their limitations. The first part is dedicated to pure and isotropic composites, with the second part exploring emerging anisotropic composites. Different methods to obtain anisotropy are presented, along with a discussion about their pros and cons.
Chapter II
The phenomenon of dielectrophoresis is presented in this chapter. First, a chronological review of the treatment of this force is addressed, followed by the main developments of theory and applications, not related only to the field of electrical engineering. A study of the physical phenomenon inherent to dielectrophoresis is then proposed. Lastly, the mathematical description of the DEP force is studied, as well as a numerical model of the structuration induced by this force.
Chapter III
Chapter III is dedicated to the characterization of the compounds used to elaborate the composites. In the first part, polymer matrices are characterized by dielectric spectroscopy. In the second part, high permittivity ceramic powders are studied. We explored a new way to characterize the intrinsic permittivity of ceramic particles, as the permittivity value is critical for implementing any model that uses DEP force.
Chapter IV
The experimental treatment of electric field-induced chaining is studied in chapter IV. The experimental setups and protocols are described in the first part. The second part presents the results for both optical and electrical monitoring of the structuration. Lastly, the materials are characterized electrically with a study on the impact of the process and filler concentration.
Introduction
3
This chapter offers a numerical simulation of the chain formation under an electric field. The obtained structures and structure changes are compared with both experimental and theoretical studies. Lastly, the evolution of permittivity, as a marker of composite structure, is discussed with respect to the impact of several parameters, and compared to experimental results.
Chapter VI
The last chapter is dedicated to studying a novel way to achieve anisotropy in the direction perpendicular to the electric field by aligning fillers. A theoretical explanation of the phenomenon is proposed and compared with experimental results. Several experimental implementations are then presented, emphasizing the possibilities offered by these new types of materials.
Lastly, a general conclusion summarizes the work performed and contributions to this thesis. Perspectives and impact of this work are also discussed.
Chapter I
Materials In Electrical Engineering,
Chapter I - Materials In Electrical Engineering, Current Limitations And Prospective Developments
7
I.
MATERIALS IN ELECTRICAL ENGINEERING,
CURRENT LIMITATIONS AND PROSPECTIVE
DEVELOPMENTS
The range of materials in electrical engineering applications is very wide, from conductors to insulators, and with materials presenting very specific properties (piezoelectric, pyroelectric, etc.), to others requiring basic functions such as electrical or thermal conductivity, permittivity, permeability, and more. The nature of these materials spans the entire spectrum, including polymers, ceramics, and metals. These materials can be either pure or composite, isotropic or anisotropic. Many advances have been made to obtain materials with enhanced properties to meet expectations for future technologies (increased power densities, severe external constraints, etc.). For their ease of use, implementation, and versatile properties, this study focuses on materials with a polymeric matrix (either pure or composite material), implementations, work in progress, and perspectives.
I.1.
Today’s materials
I.1.a.
Materials in systems
As mentioned above, the range of materials present in electrical engineering as well as the constraints they must endure, is very wide. This diversity is illustrated here through three conventional systems: power modules, power cables, and film capacitors.
Figure I-1: Power module scheme.
Power modules are an assembly of active components (chips), interconnections, and insulating layers. The assembly is encapsulated by gels and polymer resins. The purpose of this encapsulation is to ensure the electrical insulation between metallic parts, as well as to provide the assembly with a level of mechanical resistance. Current materials are not used for cooling because of the one-side cooling design adopted and the poor thermal conductivity of the gels/polymers. Generally, the chips are soldered to DBC (Direct Bonded Copper) substrates composed of a ceramic (generally alumina) with copper plates
8
on both sides. The ceramic serves several purposes: to withstand the electric field and to extract heat generated by the chips. Key issues for ceramics are their CTE (Coefficient of Thermal Expansion) mismatch with the copper, and their brittleness [1]. Another key layer is the TIM (Thermal Interface Material), which corresponds to a viscous liquid composite made of a polymeric matrix and high thermal conductivity fillers [2]. The purpose of the TIM is to decrease thermal resistance at the interface between the sink and the copper plate. Current TIM still presents relatively low thermal conductivity (i.e. under 4 W.m-1K-1). Another known issue is the possible drying of the TIM during ageing. It should be noted
that TIM is not supposed to ensure insulation, meaning that it is possible to use conductive fillers. Lastly, the power module enclosure corresponds to a hard plastic case, whose main purpose is to provide mechanical strength and allow electrical connections.
Throughout this first example, many different materials have been described with very specific functions. In addition to their intended purposes, all of these materials must be compatible with their environment. In order to minimize the risks of mechanical failure (such as those caused by thermal cycling), all the constituents should present a CTE as compatible as possible. The chips are the locations where heat is produced, so their surroundings can be subject to high operating temperatures (which are expected to increase due to the rise in power densities [3]). A very high electric field can be present locally in the area surrounding the chips and patterned copper (due to triple points and sharp edges). The encapsulating material and ceramic plate should therefore have high breakdown strength.
The second example of a system to be described is a power cable. Many varieties of this energy transport device can be found, from medium voltages to very high voltages (up to hundreds of kV), operating in AC or DC, and in many environments, in the air, ground, or underwater. Given the wide diversity, we will focus here on the example of a 3-phase high voltage cable.
Chapter I - Materials In Electrical Engineering, Current Limitations And Prospective Developments
9
Figure I-2: Example of the composition of a 3-phase high voltage AC cable.
The main purpose of the cable (i.e. transporting energy) is fulfilled by the three conductors (one for each phase), generally made of aluminum (light weight and low cost) or copper (higher conductivity). Three consecutive layers are found directly surrounding the conductors: a sandwich of XLPE between semi-conducting layers. The role of the XLPE is to ensure insulation while the semi-semi-conducting layers are present for electric field grading purposes to prevent partial discharges and reduce stress. The semi-conducting layer is generally made of polymers filled with carbon black. The insulating system must present the lowest losses possible. The outer PVC layer function is to protect the cable from external aggression, such as humidity and dust.
The materials in power cables are subjected to highly diverse constraints: they are in close contact with very high voltage; they are designed to withstand moderate temperature (up to 130 °C for a very short time). The most challenging aspect in cables is that, due to their high cost and the difficulty of maintenance, they are often designed to be in service for 40 years or more. The material aging in these conditions is quite complex to figure out due to water absorption, space charge formation (mostly in HVDC applications [4]), etc. Therefore, the materials used must be very stable over time. Examples of current research focus on understanding the space charge formation and on the replacement of carbon black fillers by carbon nanotubes to improve mechanical properties.
The final example is that of the capacitors. Here, we focused on film capacitors, i.e. where the dielectric material is a polymeric film. As polymers have low dielectric constants, capacity is increased by using large surface areas. The typical way to handle this large surface is with interdigitated electrodes as shown in Figure I-3.
10
Figure I-3: Scheme of interdigitated film capacitor.
Each electrode is separated from neighboring electrodes by a thin dielectric layer. The capacitance being directly proportional to the distance between electrodes, thinner dielectric layers lead to increased capacity but lower breakdown voltage. Many different polymers are used as dielectrics (polypropylene, polyethylene etc.), depending on parameters such as the operating voltage, temperature, the environment, and others.
Although this kind of capacitor design is common, many other designs exist according to the intended function (embedded capacitors, filtering, energy storage, electromechanical transducers, etc.). The nature of the constraints differs greatly, as capacitors can be operated under a variety of conditions, from low to high voltage, high temperature, in stationary or portable systems, etc. Current developments are related to developing materials presenting higher permittivity and lower losses. Many ongoing research projects are based on polymer/ferroelectric ceramic and polymer/conductive filler composites [5].
Figure I-4: Scheme of the heat flux (red arrows) and electric field (blue arrows) in (a) power module, (b) power cable, and (c) capacitor.
As a concluding remark, let us add that the systems presented have at least one point in common: all the materials used (pure or composite) have isotropic properties. However, the designs used often lead to flux directed preferentially in a single direction. For instance, the electric field is directed toward the electrodes in the capacitors; the heat flux is directed from the hot source (chip or conductor) to the cold source (sink or outer part of the cable) in power modules and cables (Figure I-4). This mismatch between material properties, and the direction of flux, open the possibility to enhance material properties by
Chapter I - Materials In Electrical Engineering, Current Limitations And Prospective Developments
11
better adapting them to their systems. In order to study this, today’s isotropic materials (pure and composite) are examined in the next section. Then we address anisotropic materials and the ways to induce anisotropy.
I.1.b.
Isotropic materials
Polymers (as matrix)
Polymers are used in electrical engineering for a wide range of applications that can generally be divided into two categories: insulation and dielectrics. The first category implies preventing the current from flowing between two electrodes with different electric potentials. Related applications include cable insulation (electrical transport, motors, busbar), passivation and packaging of electronic component, and printed circuit boards (PCB). The second category also implies low electrical conduction, this time for the purpose of energy storage. Generally, this term is also related to high polarizability, but polymers present a low dielectric constant. The associated application is for capacitors (energy storage, filtering). The lack of polarizability of polymers is compensated by their high dielectric strength. If large capacitance is required, it can be attained by implementing a large surface. Another application for polymers is their use as a chemical barrier. The range of properties for polymer materials is very broad. A partial summary is provided below in Table I-1.
Table I-1: Some general properties of polymers
Property General behavior Range Ref.
Density
[g.cm-3] Very low to low 0.84 – 2.35 [6]
Mechanical Young’s modulus
[GPa] Very soft to hard 1e-3 – 2.59 [7], [8]
Thermal
Conductivity
[W.m-1.K-1] Very low 0.1 – 1 [8]
Operating temperature
[°C] Very low to moderate -269 – 400 [9]
Glass transition
[°C] Very low to moderate -128 – 400 [9], [10]
Electrical
Resistivity
[Ω.m] High to very high 10
-3 – 1016 [11], [12]
Dielectric strength
[kV.cm-1] High to extremely high up to 10000 [13]
12
Some values in Table I-1 may seem unusual, but this is because more than just “conventional” polymers are taken into account. For example, very low values of resistivity are found in the case of conductive polymers, and higher values for permittivity in the case of copolymers.
The advantages of polymers include their ease of implementation (extrusion, molding, doctor blade, spin-coating, dip-coating etc.), high dielectric strength, low loss factor, chemical resistance, mechanical properties (compatibility with the substrate, shock resistance), and ability to serve as a barrier to moisture. Some resins are photosensitive, which allow using photolithographic techniques.
On the other hand, their disadvantages include their low thermal conductivity, relatively low operating temperature, and low permittivity (which actually can be advantageous in some applications). Also, the polymerization reaction is exothermal and can lead to thermal runaway.
Even if polymers present very interesting properties, some of their disadvantages are an obstacle for their use. That is one of the reasons why intense research has been conducted on composite materials with a polymeric matrix, to improve material performance or extend the range of polymer properties and applications.
Composites
A composite is a material comprising at least two distinct phases. The purpose of the composite is to compensate a weakness in one of its constituents by adding other compounds. Wood is an example of natural composite with a polymer matrix (lignin) conferring resistance in compression filled with cellulose resisting traction. There are numerous examples of artificial composites, such as concrete, fiber reinforced plastics, TIM, to name a few.
In the field of electrical engineering, most composites are made with a polymer as the matrix. There are few other materials that use other matrices, such as ceramic-metal (cermet) for resistor and capacitor applications.
When it comes to elaborating a composite, the strategy is to define the specifications related to the intended application and then choose the matrix and filler according to their properties. The matrix must be compatible with the processing method, while presenting properties approaching the intended requirements. The filler is then chosen according to the property to be enhanced/introduced. Various fillers are available, depending on the material nature (ceramic, polymer, metal etc.), size, and shape. Generally, the size of the filler ranges from a few nanometers to 100 μm, with the particle being spheroidal, ellipsoidal (needle, platelet), or fibrous. The size and shape of the particle are very important and must not be overlooked.
The following paragraphs present the general properties of different types of filler, along with examples of composite implementations.
Chapter I - Materials In Electrical Engineering, Current Limitations And Prospective Developments
13
Ceramic fillers
The variety of ceramic powders is very wide, from nanoscale to microscale. Almost all shapes are available. General properties of ceramics are presented in Table I-2.
The advantages of ceramic powders include high thermal conductivity as compared to polymers (ex. AlN), high permittivity (ex. BaTiO3), and support for very high operating temperatures. Ceramics can
also present properties almost entirely absent from polymers, such as piezoelectric (ex. PZT), pyroelectric (ex. PZT), non-linear resistivity (varistor effect) (ex. ZnO), and magnetic properties (ex. Fe2O3).
The disadvantages of ceramic powders include their density mismatch with polymers (sometimes leading to sedimentation) and lower dielectric strength than polymers.
Table I-2: Some general properties of ceramics.
Property General behavior Range Ref.
Density
[g.cm-3] Moderate to high 2.5 – 15.6 [16]
Mechanical Young’s modulus
[GPa] Very Hard 73 – 500 [16], [17]
Thermal Conductivity [W.m-1.K-1] Relatively high to extremely high 1 – 290 [17], [18] Operating temperature [°C] Very high 500 – 1700 [16] Electrical Resistivity [Ω.m] Low to high 10 -7 – 1012 [16] Dielec. strength [kV.mm-1] Medium to high 1 – 40 [16]
Permittivity Low to very high 4.1 – > 105 [16], [19], [20]
Some polymer/ceramic composites with very interesting properties have been elaborated. For example, Xu et al. reported an epoxy/AlN (60 vol%) with thermal conductivity of 11 W.m-1.K-1 [21]; Ishida et al.
reported a value of 32.5 W.m-1.K-1 for polybenzoxazine/BN (78.5 vol%) composite [22]. As for the
dielectric constant, 53.9 in permittivity at 1 kHz for PVDF/BaTiO3 (50 vol%) was achieved by Yu et al.
[23], but with relatively low dielectric strength, while Li et al. reported a P(VDF-CTFE)/ZrO2 (9.1
weight % ≈ 2 vol%) composite with relatively low permittivity but high dielectric strength, allowing them to reach high energy density (11.2 J.cm-3)[24]. Higher permittivity (738 at 100 Hz) can be
14
obtained, but at the cost of increased losses (1.8 at 100 Hz) [13]. A PVDF/PZT composite (50 vol%) reached a piezoelectric coefficient value pf 13.8 pC.N−1 [25].
Xie et al. presented an interesting result: they managed to obtain a poly(vinyl alcohol)/BN composite with 3.9 W.m-1.K-1 thermal conductivity at only 5.9 vol% [26]. This rather good result at such a low
filler concentration was attributed to the aspect ratio of the particles (platelet shape) and a partial orientation of the fillers due to the deposition method.
Another aspect of composite that is studied intensively is the ability to improve materials’ electrical performance. The major body of these works focuses on polymer/silica (SiO2) nanocomposites. It has
been showed that these materials can present increased dielectric strength [27], PD resistance [28], [29], and decreased leakage current density [30]. The dependence of the dielectric strength results appears to be very sensitive to particle size. The general trend is a higher dielectric strength with nanoparticles than with microparticles [31]. However, the addition of nanoparticles does not ensure an increase in the dielectric strength compared to the neat polymer.
It is important to note that most of the composites cited above present very high volume fraction of fillers, and in some cases, additional treatments such as surface modification of particles were used.
Metallic fillers
Some examples of polymer/metal nanocomposites can be found in literature. Silver nanoparticles were used with poly(o-toluidine) to obtain a composite with an electric conductivity of 1.28 S/cm [32]. Another application is the increase of thermal conductivity: Serkan Tekce et al. made a polyamide/copper (60 vol%) microcomposite reaching 11.57 W.m-1.K-1 [33]. This article also
emphasizes the importance of particle shape. Measurement of thermal conductivity (Figure I-5) showed that particles with a higher aspect ratio had greater influence on composite properties.
Chapter I - Materials In Electrical Engineering, Current Limitations And Prospective Developments
15
Figure I-5: Thermal conductivity of polyamide/copper composite as a function of filler concentration [33].
Allotropes of carbon fillers
The allotropic forms of carbon have met with great success in recent research with the development of carbon nanotubes (CNT) – single wall SWCNT and multi-wall MWCNT – and graphene (or graphene nanoplatelet GNP).
These nanoparticles with extraordinary properties are expected to lead to a breakthrough in composite materials. They also open the path to high-performance composites with low filler concentrations.
Table I-3 Some general properties of CNT and graphene monolayer.
Property CNT Ref. Graphene Ref.
Density
[g.cm-3] 1.33 – 1.4 [34] 2.0 [34]
Mechanical Young’s modulus
[GPa] 640 [35] 1000 - 2400 [36], [37] Thermal Conductivity [W.m-1.K-1] 1750 - 5800 [38] 3000 [34] Thermal stability [°C] 750 air 2800 vacuum [34] 650 air [39] Electrical Resistivity [Ω.m] 0.9×10 -6 [40] 50×10-6 [34]
16
Among the numerous examples of composites made with CNT or graphene, we can mention PMMA/MWCNT (4 weight % ≈ 3.5 vol%) reaching 4.4 W.m-1.K-1 [41], and polystyrene/graphene (2.4
vol%) nanocomposite with 1 S.m-1 [42]. These materials are representative of the strong impact of CNT
and graphene on material properties, even at very low filler content.
Carbon allotropes have numerous advantages: they are light in weight, and exhibit excellent mechanical, thermal, and electrical properties. Also, they are composed only of carbon, which is not a rare resource. However, many challenges make them complex to use. They are difficult to disperse and to stabilize in solution; their production is expensive; and the desired quality is not always achieved.
In parallel to graphene, many 2D particles are being developed, such as silicone [43] or monolayer MoS2
[44, p. 2].
I.1.c.
Intermediate conclusion
The list of materials mentioned in the previous paragraphs is merely a quick overview of the composites and properties that can be obtained. The materials were limited to two-phase composite, however, multiple phase composites can be found. In literature, other particles have seen growing interest, such as core-shell and Janus particles. The purpose of our review is to understand the general strategy for choosing the components used in a composite. The first step is to define the properties and their expected values needed for the intended application. The matrix should then be chosen according to its properties and the processing method. The choice of the particle is rather complex, as many types, sizes, and shapes are available. The first aspect to consider is the matrix property that needs to be enhanced, in order to determine what particle characteristics should be. Particle dimension is not a parameter to be neglected. Indeed, the effect of particle size can be extremely different, whether the particles are nanoscale or microscale. The example of dielectric strength is relevant to this extent; where microparticles tend to lower dielectric strength while nanoparticles can increase it. But it is important to note that nanoparticles are not always better than microparticles. Thus, one of the clues for obtaining suitable size is to determine whether the property to be enhanced relies on volume or on the surface properties of the particle. Tanaka attempted to give the general impact of nanoparticles on materials’ electrical properties (dielectric strength, permittivity etc.) [45]. An alternative choice can be a distribution of particle size, with distribution being used to reach a high filler concentration. The last parameter to choose is the particle shape (or aspect ratio). In many cases, particles exhibiting a high aspect ratio lead to better performance, as they reduce the quantity of interfaces, which are generally detrimental. In that respect, many recent studies focus on the modification of these polymer/particle interfaces through chemical treatment.
Chapter I - Materials In Electrical Engineering, Current Limitations And Prospective Developments
17
Although materials with very interesting properties were presented here, there are still some outstanding issues related to these kinds of composites. In many cases, the volume fraction of filler needed to obtain a material with the desired properties is very high (up to 80 or 90 vol%). This is a major drawback because at these filler concentrations, some of the matrix properties are modified radically. The viscosity of the mixture before being cured can be very high, which makes implementation impractical. When cured, mechanical flexibility is drastically reduced, which is not a good option for many applications. Thus, in order to improve composite performance again, it will be necessary to lower the volume fraction of filler without degrading the properties. This is one of the promises held by anisotropic composites.
I.2.
Emerging materials: anisotropic composites
Many applications require a given property mainly in one direction as demonstrated in section I.1.a. Despite that, all the materials mentioned in the section I.1 have something in common: their properties are isotropic, meaning that they present the same properties in every direction. This means that current materials and composites are not fully optimized for the systems in which they are used. One way of working towards matching materials to systems would be to make them anisotropic, that is, tailoring the material to obtain the appropriate property in the appropriate direction for a given application.
Figure I-6: Published items each year over the past 20 years with the keywords “anisotropic composite” [46].
The topic of anisotropic material has raised a growing interest over recent years, as can be seen in Figure I-6 (figure from [46]), reaching nearly 700 publications in 2015.
I.2.a.
Benefits of anisotropy
A simple example to explain the inherent benefit of anisotropy is the case of the capacitor. Let us consider a 1 mm side cube of permittivity 4. Inside the cube are placed 8 particles of permittivity 1000. Two different cases are studied, shown in Figure I-7. Numerical simulation performed using FEM [47]
18
allows computing capacitance in every direction. The computation method is described in detail in section V.2.a. The results are summarized in Table I-1.
Figure I-7: Geometry simulated for (a) isotropic composite and (b) anisotropic composite.
The result shows a clear enhancement of material capacity in the direction of the aligned spheres for the material in Figure I-7 (b). In the other directions, the capacity value is smaller than with the isotropic composite. Numerical evidence of this is also reported by Wang et al. [48].
Table I-4: Calculated capacitance of isotropic and anisotropic composite
Material
Axis (a) [fF] (b) [fF]
X 43 41
Y 43 41
Z 43 84
The first interest of anisotropy is therefore to improve a property in one direction compared to an isotropic composite at the same filler content, or to obtain the same property but at lower filler concentration. This example is a good illustration of the concept of a material matched to a system. In a capacitor, the high permittivity of the dielectric material is needed only in the direction of the applied field, making the material in Figure I-7 (b) more adapted for a capacitor application as long as the dielectric strength remains the same. The slight decrease in X and Y permittivity has no impact on material performance (capacitance) because the electric field should not be directed in these directions.
Another key aspect of this material was also reported by Wang et al and can be observed in Figure I-8. From this numerical simulation, the dielectric susceptibility of the isotropic composite tends to saturate when filler susceptibility equals 20 times that of the matrix. On the contrary, no saturation is observed for the anisotropic composite due to the continuous path of high permittivity phase in the direction of the electric field. This means, for example, that there is no interest of using particles with very high
Chapter I - Materials In Electrical Engineering, Current Limitations And Prospective Developments
19
permittivity for an isotropic composite, since the impact becomes negligible above 20 times the permittivity of the matrix. For an anisotropic composite, there is still an interest in using particles with very high permittivity.
Figure I-8: Reduced composite dielectric susceptibility as a function of the filler reduced dielectric susceptibility [48].
Of course, the real structures of composite materials are much more complex than these simulated structures.
I.2.b.
Methods for anisotropic composite processing
There are several ways to induce anisotropy in composites, each of them having its own advantages and disadvantages. The common point to all these methods is the application of an external constraint prior to, or during, matrix processing.
Mechanical/acoustic constraint
Several methods have been developed to elaborate an anisotropic composite by applying a mechanical constraint. It should be noted that the mechanical constraint does not lead to the assembly of particles in chains, but rather to the alignment of non-spherical particles in a preferential direction.
The examples of methods found in literature are extrusion [49] and uniaxial strain [50]. The obtained structures are shown in Figure I-9.
20
Figure I-9: Composite with mechanically aligned fillers. (a) BaTiO3 whiskers after heat removal of the polymer,
(b) PVDF/PZT (10 vol%) composite.
The use of acoustic waves to develop an anisotropic composite allows obtaining periodical structures and complex orientational behavior (Figure I-10). This method was demonstrated to work on a relatively large scale with the use of ultrasound. Contrary to mechanical methods, the use of spherical particles is not prohibited. Solid and liquid composites such as acrylic/polysiloxane, water/mica, water/polystyrene [51], water/polystyrene fiber [52], epoxy, polyester, silicone, and agar/glass [53] were obtained. To the best of the author’s knowledge, only the mechanical properties of the obtained composites were studied, demonstrating an improvement.
Table I-5: Mechanically-structured composite properties
Method Matrix Filler Filler content
(vol%) Property Value
Increase (%) Ref.
Extrusion PVDF BaTiO3 30 permittivity 90,72 104 [49]
Extrusion PVDF BaTiO3 30 piezo. coef. 13,7 [pm/V] 29 [49]
Strain release PVDF PZT 40 permittivity 45 80 [50]
Acoustic Polymer Glass 9.0 ± 2.0 mechanical
Chapter I - Materials In Electrical Engineering, Current Limitations And Prospective Developments
21
Figure I-10: Ultrasonically patterned composites. (a) epoxy/glass [53], (b) polyester/glass [53], (c) and (d) polystyrene fiber in water sugar solution [52].
The properties of anisotropic composites obtained with mechanical/acoustic constraints and the relative enhancement are summarized in Table I-5. The enhancements are compared to isotropic composite or anisotropic composite with perpendicular alignment.
The main advantage of mechanical constraints is their ability to work for large pieces.
Nevertheless, there is at least one disadvantage related to applying a mechanical constraint: it is often not compatible with in-situ tailoring of the material, as it would not be possible to apply a mechanical constraint in complex systems.
Electrical constraint
Tailoring composites under an electric field has been studied intensively over the past several decades. The terminology used is rather diverse and must be divided into two categories: assembly and alignment. The first term corresponds to particles connecting into chains in the direction of the applied electric field under dielectrophoretic force. The assembly phenomenon has several denominations, such as dielectrophoretic or electric field driven/assisted/induced assembly, chaining or pearl-chaining etc. The alignment of a particle corresponds to a non-spherical particle exhibiting a stable orientation (in the case of an ellipsoidal particle, one of its axes is aligned with the direction of the electric field) under the application of an external electric field. The alignment phenomenon also has several denominations, such as electro-orientation, electric field assisted/directed alignment/orientation. These two phenomena can be observed in AC and DC electric fields. For alignment, the use of DC leads to the long axis of the particle being parallel to the direction of the electric field.
22
Table I-6 summarizes a review of some developed anisotropic composites. The range of impacted properties is very wide: including permittivity, electrical and thermal conductivity, elastic modulus, optical transmittance. The range of matrix and fillers is also diverse. Several comments can be expressed regarding the data in this table. With respect to permittivity, the highest value is obtained with carbon nanofibers (CNF) as filler [54]. However, care should be taken regarding this result; CNFs are a conducting material, so even if the permittivity reaches very high value, the losses also increase dramatically. For the other materials, polydimethylsiloxane (PDMS) might not be the best choice as a matrix for energy density related applications, due to its very low permittivity (between 2.3 - 2.8) [55]. Matrices such as PVDF or copolymer can present higher permittivity. However, dielectric strength also needs to be high for such applications.
The electrical conductivity of anisotropic materials exhibits the most impressive results obtained [56]. More importantly, these results are reached at a very low filler concentration. The type of filler used is mostly CNT, GNP, or carbon fiber as conductive materials [56]–[58]. These particles also have the benefit of a high aspect ratio. Another interesting property of the obtained composites is their relatively high optical transmittance that is sometimes needed in some applications (e.g. solar panels).
It is important to note that the results of dielectric strength values presented in the Table I-6 [59], [60] are not representative of the typical properties of anisotropic materials. This is certainly due to the fact that here for the breakdown test the electric filed is directed normally to the direction of the chains.
The thermal conductivity results are still rather limited [61], [62], certainly due to the interface of polymer between particles acting as a thermal resistance.
This table is clearly non-exhaustive, and many other particles (e.g. Janus [63], gold nanoparticles [64]) and properties (pyroelectricity [65]) have been studied. Another type of composite that is important to mention is electrorheological fluid [66]. This composite is unusual in the sense that the matrix remains liquid. However, the same principle acts in these fluids, with the application of an electric field leading to the formation of chains in its direction, modifying the viscosity and mechanical properties of the liquid composite. This phenomenon has been studied intensively both experimentally and numerically [67], [68].
23
Table I-6: Review of anisotropic composites with associated properties. The increase is compared to isotropic composites at the same volume fraction.
Property Matrix Filler Filler content
(vol%) Value Increase Ref. Comment
Permittivity
PDMS BaTiO3 25 12.7 65 % [55]
PDMS BaTiO3 ≈ 11 9 41 % [69]
Epoxy CNF ≈ 3 ≈ 500 ×50 [54] High permittivity but increased losses
Electrical Conductivity
[S/m]
Acrylate SWCNT ≈ 0.03 10-4 ×10³ [57]
PSU MWCNT ≈ 0.5 10-1 ×10¹⁴ [58] Increase compared to pure polymer
Epoxy MWCNT ≈ 0.01 3.10-4 ×5.106 [70] Epoxy CNF ≈ 2 3.10-2 ×3 [56] GNP ≈ 2 10-5 ×5.103 Dielectric Strength [kV/mm]
PDMS BaTiO3 25 128 25 % [59] In the direction perpendicular to the chains
PE o-MMT 6 (wt%) 370 23 % [60] In the direction perpendicular to the chains
Thermal conductivity
[W.m-1.K-1]
Epoxy GNP ≈ 0.54 0.41 26 % [61]
Epoxy Aluminum 9.4 0.39 34 % [62] Particle are coated with Al2O3
Elastic modulus [GPa]
UDMA
/HDDMA SiO2 + ZrO2 57 8.3 12 % [71]
Optical
Transmittance Epoxy MWCNT ≈ 0.01 65 % ×2.6 [70]
24
Figure I-11: Electric field structured composites. (a) PDMS/BaTiO3 [55], (b) PDMS/BaTiO3 [69], (c)
epoxy/CNF [54], and (d) epoxy/GNP [61].
Images of some anisotropic composite presented in Table I-6 can be observed in Figure I-11. The difference in the structures between insulating (Figure I-11 (a) and (b)) and conductive (Figure I-11 (c) and (d)) particles is clear. As the electric potential is displaced at the end of the wires for conductive particles, it can lead to a very intense electric field locally resulting in tree formation.
The evolution of permittivity, and permittivity increase, as a function of filler concentration for two different composites, is shown in Figure I-12. The first observation is that permittivity increases with filler content, which seems logical. The second observation is that the permittivity increase compared to the isotropic composite starts by increasing at low filler content, reaching a maximum and then decreasing with filler content.
Chapter I - Materials In Electrical Engineering, Current Limitations And Prospective Developments
25 0 20 40 60 0 25 50 75 Permitt iv it y i n crea se (%)
Filler content (vol %)
Figure I-12: (a) Permittivity of anisotropic (structured) and isotropic (random) epoxy/PZT composite and (b) permittivity increase compared to isotropic composite, as a function of the volume fraction of filler (φ) [72].
The same observations can be made for other properties, such as the piezoelectric coefficient (Figure I-13). The difference in the piezoelectric coefficient increase is even larger, but no evidence of increase at low filler content was observed.
0 20 40 60 0 1000 2000 Permit ti v it y i n crea se (%)
Filler content (vol %)
Figure I-13: (a) piezoelectric coefficient (d33) and (b) piezoelectric coefficient increase compared to isotropic
composite as a function of the volume fraction of filler. Epoxy/PZT composite from ref. [72].
The behavior can be understood partially (at least concerning permittivity) from a circuit point of view. The simplest model for ideal anisotropic composite is two capacitors in parallel. For the isotropic composite, permittivity can be estimated thanks to a mixing law (more detailed explanation and study of mixing laws is provided in section III.2.b). The Lichtenecker equation was chosen here to model permittivity. The results are plotted in Figure I-14.
(a) (b)
(a) (b)
26 0 25 50 75 100 0 500 1000 1500 2000
Permit
ti
v
it
y
Filler content (vol %)
Isotropic (Lichtenecker) Anisotropic (Parallel circuit)
0 20 40 60 0 1000 2000
Perm
it
ti
v
it
y
i
n
crea
se (%)
Filler content (vol %)
Figure I-14: Theoretical prediction of permittivity, and permittivity increase, for ideal anisotropic and isotropic composite as a function of filler content.
A numerical estimation of the permittivity increase predicts a maximum of around 18 vol%, which is in good agreement with experimental measurements. This specific behavior is very important, as it reflects the fact that the beneficial impact of the anisotropic composite is preponderant at low filler concentration.
The advantage of the electric field structuring method is the ease of applying the voltage. Electrodes are already present in many systems, allowing “in situ” tailoring of the composite. With the only condition for chaining or alignment being a difference in the complex permittivity between the particle and matrix, this approach works for almost every matrix/particle pair.
The disadvantage of this method is the need for high voltages when the sample is thick, hence limiting the maximum possible thickness. Electrohydrodynamic flow induced by the electric field can also restrict the operating frequency range to chain/align. The obtained properties are sometimes small compared to that which can be expected, probably due to particle/matrix interface. This is well illustrated by comparing the experimental results in Figure I-12 to the theoretical results in Figure I-14. Another limitation is that the chaining/alignment is restricted to the direction of the applied electric field.
Magnetic constraint
Tailoring under electrical constraint was described in the previous section. A strong analogy exists between magnetic and electrical constraints. The equivalent of dielectrophoresis is magnetophoresis, and the equivalent for electro-orientation is magneto-orientation. The analogy between these mechanisms was addressed extensively by [73]. However, some differences are still encountered in magnetic tailoring, with the presence of a permanent magnet more frequently than its electric equivalent (electret) and the phenomenon of saturation.
Chapter I - Materials In Electrical Engineering, Current Limitations And Prospective Developments
27
Examples of composites structured using a magnetic field are summarized in Table I-7.
Table I-7: Magnetically structured composite properties
Matrix Filler Filler content Property Value Increase Ref. Silicone Ni silver coated 0.75 vol% Electrical conductivity 2.5×10⁻² [S/m] - [74] Optical transmittance > 90 % - PMMA Cobalt
nanowire 1 vol% Electrical conductivity 2 [S/m] ×4 [75]
Epoxy CNT 3 weight % Thermal conductivity 6.6 [W.m-1.K-1] 10 % [76]
PDMS Fe3O4 30 weight % Elastic modulus 10 [kPa] ×2.5 [77]
Most studies available in literature deal with CNT alignment. Transparent conductive materials seem to be the most frequent item.
Figure I-15: PMMA/Cobalt nanowire composite (a) isotropic and (b) magnetically chained/aligned [75].
The advantage of magnetic field structuring is that very good results are obtained with CNT-based particles.
However, the use of a magnetic field drastically restricts the possible type of particles, as compared to an electric field. In addition, the application of a magnetic field is more complex and in-situ structuration is almost impossible.
I.2.c.
Terminology
As used to present the above materials, the term anisotropic is commonly accepted to describe composites presenting different properties in different orthogonal directions. However, a more exact designation of the composites obtained under external constraint should be orthotropic composite: a subgroup of anisotropic composites. Indeed, the composites described in this section of the manuscript
28
present three orthogonal symmetry planes. The impact on the permittivity tensor is described in Table I-8.
Table I-8: Permittivity tensor of different material types
Anisotropic Orthotropic Isotropic
𝜀 = [ 𝜀𝑥𝑥 𝜀𝑥𝑦 𝜀𝑥𝑧 𝜀𝑦𝑥 𝜀𝑦𝑦 𝜀𝑦𝑧 𝜀𝑧𝑥 𝜀𝑧𝑦 𝜀𝑧𝑧 ] 𝜀 = [ 𝜀𝑥𝑥 0 0 0 𝜀𝑦𝑦 0 0 0 𝜀𝑧𝑧 ] 𝜀 = [ 𝜀 0 0 0 𝜀 0 0 0 𝜀 ] = 𝜀
However, since the term anisotropic is widely accepted by the scientific community, that term will continue to be used in this thesis dissertation to describe orthotropic composites.
I.3.
Conclusion
The main characteristics of the polymer-based materials used in electrical engineering have been presented throughout this first chapter. The properties of pure, isotropic, and anisotropic composites have been summarized. The latter materials have seen a growing interest over the past years. Among the three possible constraints to induce anisotropy in composites (mechanical, magnetic, and electrical), the tailoring of material by means of an electric field present some advantages. The most valuable assets are perhaps the possibility of in-situ tailoring, and being able to be adapt to systems without intrinsic modification (addition of electrodes). Taking into account these considerations, the electric field was selected in this work as the means to tailor composites.
However, regardless of its benefits, this tailoring method is not mature at this time. The enhancement of properties is proven, but somehow those properties fail to reach full expectations, far from the theoretical gain. An overview of the publications on electric field-structured materials shows that, currently, these materials are exclusively developed empirically. The typical method is to make the composite, vary some parameters (filler content, electric field magnitude and frequency), and characterize the obtained composites. While showing interesting outcome, this method is limited in terms of understanding the phenomena involved. Very few examples of monitoring the formation of anisotropic composites can be found in literature, whereas that aspect offers significant knowledge about the structuring phenomenon. Of course, some authors have tackled chaining/alignment theoretically and numerically, but without correlating it with the predictive elaboration of composite materials.
With these considerations in mind, the hypothesis of this work is that it should be possible, based on a predictive approach, to tailor the structure of a composite from isotropic to anisotropic when applying an electric field. To achieve this accurate control of material properties, several challenges first need to be addressed, as summarized in the following roadmap:
Chapter I - Materials In Electrical Engineering, Current Limitations And Prospective Developments
29
- Based on the theoretical study of the phenomena leading to filler structuration, the forces and parameters involved will be determined. A theoretical study should lead to the development of a structuration model.
- Once the physical parameters of the system are identified, their values need to be fully measured. This knowledge is essential both for experimental (to target experimental parameters) and numerical (as inputs of the model) investigation.
- The materials then need to be elaborated with online monitoring during their structuration. The physical parameter monitored must be related quantitatively to the numerical simulation in order to allow the comprehensive comparison between the model and the experiment.
- The obtained material will be characterized to confirm the accurate control of composite properties.
- Lastly, the model and the experiment results will be compared, while varying as many parameters as possible to reach a conclusion regarding the validity of the simulation.
Each of these points is addressed in this manuscript.
As a first step, we present in the next chapter, a survey of the force induced by the electric field, leading to the tailoring of filler structure, from historical development to theoretical and numerical description.
Chapter II
Dielectrophoresis:
Theoretical Description
Chapter II - Dielectrophoresis: Theoretical Description
33
II.
DIELECTROPHORESIS: THEORETICAL DESCRIPTION
A dielectric particle immersed in a dielectric medium, subject to a non-uniform electric field, will undergo a force: the dielectrophoretic (DEP) force. This force is the starting point of the formation of anisotropic composites under electric field. This phenomenon is studied in this chapter to understand the interaction between a particle and a non-uniform electric field, and to identify the key parameters involved.
II.1.
Dielectrophoresis: a brief survey
II.1.a.
Early descriptions
The first tracks of dielectrophoretic phenomena are generally attributed to Thales of Miletus, around 600 B.C. The trading routes brought a material called “electron” (𝜂𝜆𝜀𝜏𝜌𝜃𝜈), known today as amber. Even if the original text is missing, further documents report [78] that Thales succeeded in attracting fluff and other materials with a rod of amber rubbed with fur. The conclusion of this very early experiment was that a “magnet” (confusion was made between electrical and magnetic effects) had a soul because it was able to cause motion. The conclusion may seem amusing to us now, but behind this experiment lies the discovery of electrostatics and triboelectricity.
Figure 0-1: A piece of amber and fur [79].
Much later, in the 17th century, William Gilbert showed the interactions between drops of water and
electrified amber in his book “De Magnete” [80]. The distinction between magnetism and electrostatic was an important step forward of his work.
34
Figure 0-2: Drop of water attracted by amber rods [80].
In the middle of that same century, Winckler [81] and Priestley [82] studied the attractive forces acting upon organic matter. They are considered as the first people to describe the chaining of particles. The first step in the theoretical treatment of DEP followed Maxwell’s theories with a description of the equation of the force acting on a dielectric sphere subject to a non-uniform electric field [83].
Figure 0-3: (Left) elevation of a liquid in presence of a charged body. (Right) deviation of a water stream by charged rod [81].
II.1.b.
Development of the theory and applications
The first industrial application of DEP was attributed to Hatfield, with a patent application in 1921 and published in 1924, about the separation of substances through the use of an electrostatic field (Figure 0-4) [84].
Chapter II - Dielectrophoresis: Theoretical Description
35
Figure 0-4: Illustration from a patent of different devices for particle sorting [84].
The word “dielectrophoresis” was coined by Herbert Pohl in an article published in 1951, in which he described the successful removal of carbon black from polyvinyl chloride [85]. Twenty-seven years later, in his book “Dielectrophoresis, the behavior of neutral matter in nonuniform electric fields” [86], he gave the following definition of the phenomenon: “the translational motion of neutral matter caused by polarization effects in a non-uniform electric field”. While Pohl’s first interests were concerned with liquid filtration, he rapidly began to study dielectrophoresis with biological cells and particles. The early interest in the behavior of cells and living matter subject to an electric field (chains of fat particles [87], biological cells and bacteria [88], [89]) led to intensive study and use of DEP in biomedical sciences in the second half of the 20th century. The ability to sort biological cells without killing them has proven
to be of great interest. Among the numerous examples of how DEP is employed in this field, we can mention cell sorting and counting, driving and positioning single cells, cell characterization, etc. [90].
![Figure I-8: Reduced composite dielectric susceptibility as a function of the filler reduced dielectric susceptibility [48]](https://thumb-eu.123doks.com/thumbv2/123doknet/2180282.10478/34.892.252.634.212.556/figure-reduced-composite-dielectric-susceptibility-function-dielectric-susceptibility.webp)
![Figure 0-7: Potential applications for dielectrophoretically assembled composite materials, adapted from [95]](https://thumb-eu.123doks.com/thumbv2/123doknet/2180282.10478/52.892.257.637.114.490/figure-potential-applications-dielectrophoretically-assembled-composite-materials-adapted.webp)