HAL Id: tel-02010296
https://tel.archives-ouvertes.fr/tel-02010296
Submitted on 7 Feb 2019
HAL is a multi-disciplinary open access archive for the deposit and dissemination of sci-entific research documents, whether they are pub-lished or not. The documents may come from teaching and research institutions in France or abroad, or from public or private research centers.
L’archive ouverte pluridisciplinaire HAL, est destinée au dépôt et à la diffusion de documents scientifiques de niveau recherche, publiés ou non, émanant des établissements d’enseignement et de recherche français ou étrangers, des laboratoires publics ou privés.
Measurement of the J/ψ elliptic flow in Pb-Pb collisions
at √sNN=5.02TeV with the muon spectrometer of
ALICE at the LHC
Audrey Francisco
To cite this version:
Audrey Francisco. Measurement of the J/ψ elliptic flow in Pb-Pb collisions at √sNN=5.02TeV with the muon spectrometer of ALICE at the LHC. High Energy Physics - Experiment [hep-ex]. Ecole nationale supérieure Mines-Télécom Atlantique, 2018. English. �NNT : 2018IMTA0087�. �tel-02010296�
T
HESE DE DOCTORAT DE
L
’É
COLEN
ATIONALES
UPERIEUREM
INES-T
ELECOMA
TLANTIQUEB
RETAGNEP
AYS DE LAL
OIRE-
IMT
A
TLANTIQUEC
OMUEU
NIVERSITEB
RETAGNEL
OIREECOLE DOCTORALE N° 596 Matière, Molécules, Matériaux
Spécialité : Physique Subatomique et Instrumentation Nucléaire
Par
Audrey FRANCISCO
Composition du Jury :
Président : Pol-Bernard GOSSIAUX Professeur, IMT-Atlantique
Examinateurs : Javier CASTILLO CASTELLANOS Chercheur-Ingénieur, CEA
Manuel CALDERON DE LA BARÇA SANCHEZ Professeur, University of California Davis
Marielle CHARTIER Professeur, University of Liverpool
Silvia NICCOLAI Directeur de Recherche CNRS, Univ. Paris-Sud/Paris-Saclay
Dir. de thèse : Gines MARTINEZ GARCIA Directeur de Recherche CNRS, SUBATECH
Co-dir. de thèse : Laurent APHECETCHE Chargé de Recherche CNRS, SUBATECH
Guillaume BATIGNE Maître-Assistant, IMT-Atlantique
Measurement of the J/� elliptic flow in Pb-Pb collisions at √s
NN=5.02TeV
with the muon spectrometer of ALICE at the LHC
Thèse présentée et soutenue à Nantes le 24 Septembre 2018Unité de recherche : SUBATECH— UMR6457 Thèse N° : 2018IMTA0087
Remerciements
“There’s nothing you can do that can’t be done / Nothing you can sing that can’t be sung / Nothing you can say, but you can learn how to play the game / It’s easy / All you need is love.”
— John Lennon, Magical Mystery Tour (The Beatles)
Cette page est dédiée à tous ceux qui ont croisé mon chemin. Merci pour votre aide, votre confiance, vos encouragements, vos conseils, votre temps et votre inspiration.
Mes pensées s’orientent vers mes proches. Par pudeur et par souci de concision, je ne m’adresserai pas individuellement à chacun d’entre vous mais soyez assurés de ma re-connaissance. Je citerai ici mon cher directeur de thèse, l’ensemble du groupe plasma, le laboratoire Subatech, notamment les services administratifs et informatiques, les mem-bres de la collaboration ALICE, plus spécialement le groupe PWG-DQ et les équipes des upgrades ITS et MFT, et enfin mon jury de thèse, pour cette tâche chronophage.
Merci également à tous les yeux qui ont brillé en m’écoutant.
Enfin, merci à ceux qui ont renforcé ma détermination par leurs douces objurgations et lassitudes, vous ne mesurerez jamais l’importance de votre contribution.
Je souligne aussi le soutien et l’acceuil de la région Pays de la Loire, du CNRS, de l’IMT Atlantique, du laboratoire Subatech, de l’Université Bretagne-Loire, de la collaboration ALICE et du CERN qui ont permis la réalisation de cette thèse.
Gines Javi er Gui llaume Laur ent Diego Philippe Benjami n Astrid Mar ie Momo Lucile Erw ann Bar bar a Manuel Ale xan dr e Sonia Steph ane Cyrille Sar ah Nicole Prze mysla w Jana Loui s Zaida An dr y Luciano Paol o Mo nika Felix Hyeonjoong Cris tin a Barbara Alberto Br igi
tte Philippe
An ton Stef ano Hugo Javier Cv etan Ale xan dru Roberta Ionut Torsten Antoine Jaco po Jurgen Sarah Mas simi liano Jul ien Boris Cynthia Maxime Ro ssella Roy Mar ielle Manuel Silv ia Po l Lydi e Arn au d Sar y Nico Jero me Je an-Mi che l Pi erric k Khalil Dominiq ue Frédéric Pi erre Chris top he Agnes Frédéric Pierre Chris tophe Sophie St ép h an ie Tanja Sév erine Mar tin Gabriel Florian Iuri Mar ia Farah Is ab el le Sandrine Pa sc aline An ne Delphine Mi che lle Me hdi No a Lour des Da vid Geo rge Sophie Chris tine Mamie Papi Ja cq ue li ne Ak im Karine Au ré li e Léa Dou dou Fif i Sélim Mi ma Ch antal Joël Chris ta Je an-Ba ptiste Grégo u Laur a Zaz Mo ut Maman To to Papa Avó Lili Crémilde To nio Sylvia Jé rémy Manue Mano n Clémen t Evan Ha d i Rosi ta Ahmed Anouk Sami Zerr ouk Joy Ab dou Josiane D&L Avril Emi lia Patrick Clémen t Op hélie Charles Camille Elisa Mat the w FB Alice Dom Go ss saer t Picho n Urbain Thor ey HoudartBar bar y Mar tine t Magnani Po ussy Felicite Ka u sc h St ei n m etz Sautier Giuli ane tti Re ynau d Cholvy Aubert Jour dain Ledi eude ville Belda Bo rgazzi Guy Saleres Henry Petit Gervilli ers De vau x Tc h ed ry Pi o n Mélanie Mat hilde Schmitt Okja Daniel Laure Nadège Françoise Julien
À l’attention de mon entourage non-physicien :
Le terme « gypsy » ou « gipsy » est un mot anglais souvent désigné sous le terme de « gens du voyage » en France. Il fait généralement référence à une communauté d’individus dont le mode de vie a une origine nomade, bien que beaucoup soient aujourd’hui sédentaires. Le terme englobe plusieurs populations d’origines éthniques et de cultures différentes. Cette thèse ne raconte pas leur histoire.
I
N T R O D U C T I O N
Significant investments have been made to study the properties of the strong interaction, responsible for the stability of nuclei. Several experimental facilities and experiments have been devoted to the creation and observation of a deconfined state of matter, the Quark Gluon Plasma (QGP), where elementary building blocks of nuclei evolve quasi-freely. Heavy-ion collisions are unique tool to investigate this primordial state of the Universe and test Quantum ChromoDynamics (QCD) predictions. The A Large Ion Colliding Experiment (ALICE) experiment is a dedicated apparatus at the Large Hadron Collider (LHC).
The lifetime of the created QGP is very short ( ∼5–10 fm/c) and makes it impossible to observe it directly. Various observables are therefore measured to extract information about the deconfined state. Among them, anisotropic flow provides very useful results to extract the thermal properties of the system. Bound states of heavy quarks have been identified as ideal probes of the ALICE several decades ago. This thesis contains two parts:
the measurement of the J/ψ elliptic flow in Pb–Pb collisions at psNN= 5.02TeV with the
ALICE detector and the characterisation of CMOS sensors for the Muon Forward Tracker upgrade.
The first chapter of this thesis of offers a general introduction to the Quark-Gluon Plasma and its study through heavy-ion collisions. The second chapter describes the ALICE detector, dedicated to heavy-ion collision studies, and its future upgrade with details on the Muon Forward Tracker and the work performed for the characterisation study of the sensors. Chapter three is an overview of collective phenomena in the QGP with a summary of the main observations from A–A collisions, a brief discussion of the small-system results and a dedicated section on heavy flavours. The relevance of quarkonium states in the study of A–A collisions is discussed in chapter four. Experimental results and theoretical description of heavy-quark bound states are presented. The analysis performed during this thesis is detailed in the chapter 5. The J/ψ elliptic flow analysis was
performed at forward rapidity in Pb–Pb collisions at psNN= 5.02TeV through the dimuon
decay channel. The measurement was performed using the Event Plane method (using
either the 〈v2〉 or the dN/d∆φ technique) and the Scalar Product method. The azimuthal
dependence of J/ψ production is also investigated here for the first time. The results are discussed in the chapter 6 by comparing it to other measurements and theoretical predictions (when available) and drawing the conclusions about charm-quark flow at LHC. Future prospectives with the ALICE detector upgrade are also proposed here. The last chapter is a general conclusion over quarkonium results and the results obtained during this thesis.
C
O N T E N T S
Contents iii
1 Introduction to the Quark-Gluon Plasma 3
1.1 A deconfined state of matter . . . 3
1.1.1 Quantum ChromoDynamics . . . 3
1.1.2 The phase transition . . . 4
1.2 Heavy-ion collisions . . . 5
1.2.1 The Bjorken scenario . . . 6
1.2.2 Experimental signatures of the QGP . . . 7
2 Studying experimentally the QGP with ALICE 9 2.1 The LHC collider . . . 9
2.2 The ALICE detector . . . 11
2.2.1 The Inner Tracking System (ITS) . . . 11
2.2.2 Zero Degree Calorimeter (ZDC) . . . 11
2.2.3 The VZERO (V0) . . . 12
2.2.4 The TZERO (T0) . . . 12
2.2.5 The Time Projection Chamber (TPC) . . . 12
2.2.6 The muon arm . . . 12
2.2.7 Triggering System and Data Acquisition . . . 14
2.3 The Muon Forward Tracker upgrade . . . 16
2.3.1 Physics motivations . . . 16
2.3.2 Overview of the detector . . . 17
2.4 CMOS prototype characterisation . . . 22
2.4.1 Measurement techniques . . . 22
2.4.2 ALPIDE prototypes . . . 25
3 Elliptic flow 29 3.1 Azimuthal asymmetry . . . 29
3.2 Observations in A–A collisions . . . 30
3.3 Heavy-flavour results . . . 34
3.4 Collectivity in small systems . . . 39
4 Bound states of heavy quarks as a probe of the QGP 43 4.1 Relevance of heavy quarks in the QGP study . . . 43
4.2 Charmonium production . . . 44
4.2.1 Spectroscopy . . . 44
4.2.2 pp collisions: stringent pQCD test and A–A reference . . . 45
CONTENTS
4.3.1 Cold nuclear matter effects . . . 46
4.3.2 Hot medium effects . . . 46
4.4 Charmonium elliptic flow . . . 53
4.4.1 RHIC results . . . 53
4.4.2 LHC results at psNN= 2.76TeV . . . 54
4.5 Theoretical models . . . 59
5 Analysis 61 5.1 Azimuthal asymmetry analysis . . . 61
5.1.1 Dectector equalisation . . . 62
5.1.2 Event selection and implementation . . . 64
5.1.3 Resolution determination . . . 67
5.2 J/ψ elliptic flow extraction . . . 70
5.2.1 Event and track selections . . . 70
5.2.2 The dN/d∆φ method . . . 71
5.2.3 The mean v2method . . . 76
5.2.4 Acceptance and efficiency corrections . . . 80
5.3 Systematic uncertainties . . . 82
5.3.1 Signal extraction . . . 82
5.3.2 J/ψ reconstruction . . . 82
5.3.3 Flow vector equalisation . . . 84
5.3.4 Event plane resolution . . . 84
5.3.5 Event plane mixing . . . 85
5.4 Results . . . 88
5.4.1 Method comparison for v2extraction . . . 88
5.4.2 Impact of the detector η gap on the measurement . . . 88
5.4.3 Centrality dependence of the J/ψ v2 . . . 89
5.4.4 Rapidity dependence of the J/ψ v2 . . . 91
5.5 Flow method comparison . . . 93
5.5.1 Description of the scalar product method . . . 93
5.5.2 Comparison to the event plane method . . . 94
5.6 Angular dependence of the nuclear modification factor . . . 95
5.6.1 Data sample and selections . . . 95
5.6.2 RAAmeasurement . . . 96
5.6.3 Cross-checks with integrated sample results . . . 100
5.6.4 Investigating path-length scaling . . . 101
6 Discussion 107 6.1 J/ψ elliptic flow at forward rapidity . . . 107
6.1.1 Azimuthal dependence of J/ψ production . . . 108
6.1.2 Comparison with ALICE measurements at mid-rapidity . . . 110
6.1.3 Comparison to other experiments and lower beam energies . . . 110
6.1.4 Theoretical predictions . . . 112
6.2 Does charm quark thermalise at the LHC? . . . 116
6.2.1 What can be learned from the open charm comparison ? . . . 116
6.2.2 Results in p–Pb collisions . . . 118
6.3 Prospectives at the LHC . . . 120
6.3.1 Short term: LHC run3 . . . 120
CONTENTS
7 Conclusion 125
A Data sample I
B Analysis III
B.1 Flow vector equalisation for the V0C . . . III
B.2 Signal extraction . . . V
B.2.1 Fit function definitions . . . V
B.2.2 Fit function parameters . . . VI
B.3 Test results and numerical values . . . VII B.3.1 Results with the Event Plane method . . . VII B.3.2 Results with the Scalar Product method . . . XII
B.4 RAAvs path length . . . XIII
B.4.1 5-20% centrality range . . . XIII B.4.2 20-40% centrality range . . . XIV B.4.3 40-60% centrality range . . . XV B.5 Acceptance Efficiency . . . XVII B.6 Systematics . . . XVII
Acronyms XIX
List of Figures XXIII
List of Tables XXXI
C
H A P T E R
1
I
N T R O D U C T I O N T O T H E
Q
U A R K
- G
L U O N
P
L A S M A
“Only the most naive questions are truly serious."
— Milan Kundera, The Unbearable Lightness of Being
Heavy-ion collisions aim to study hadronic matter at high-energy densities. In this regime, QCD predicts a transition towards a deconfined state of matter, the QGP. This first chapter is a short introduction to color deconfinement, its evolution and endorsed probes for its study.
1.1 A deconfined state of matter
1.1.1 Quantum ChromoDynamics
The most successful theory to describe matter and its non-gravitational interactions is
theStandard Model of Particle Physics. This relativistic quantum field theory is based
on the gauge symmetry SU(3)C× SU(2)L× U(1)Y to describe each interaction.
Elemen-tary particles (see Fig. 1.1) are divided into fermions, with half-integer spin and following the Fermi–Dirac statistics, and bosons, with zero or integer spin and following the
Bose-Einstein statistics. Fermions are categorised intoquarks, building blocks of hadrons and
mesons, and leptons, insensitive to the strong interaction, along with their associated anti-particles. Fundamental interactions are mediated through the exchange of bosons:
the photon for the electromagnetic interaction, thegluon for the strong interaction, the
massive Z and W bosons for the weak interaction, and the Higgs boson for mass through the Higgs-Englert-Broot mechanism.
Within the Standard Model,Quantum Chromodynamics (QCD) [GW73,GW74] is the
theory of the strong interaction. Since not only quarks but also the strong-force mediator, the gluon, carry a color charge (red, blue, green, and corresponding anti-charges), the strong interaction is a non-abelian gauge theory with an SU(3) symmetry group. The QCD
coupling constant αsis represented on Fig. 1.2 as a function of the momentum transfer
Q. The strong force is a short-distance interaction (large Q2) as it becomes stronger at
large distances (small Q2). perturbative QCD (pQCD) can be applied at high-momentum
transfer (Q >ΛQCD ∼ 200 MeV) but calculations do not converge in the regime Q <ΛQCD.
Because of the self-interaction of the gluon, the creation of new quark-anti-quark pairs will be energetically favoured to increasing the distance between bound quarks. This property
is known asconfinement and translates into the impossibility to observe a single-color
CHAPTER 1. INTRODUCTION TO THE QUARK-GLUON PLASMA QU ARKS (spin 1/2) LEPT ONS (spin 1) GA UGE BOSONS (spin 1) S calar BOSONS (spin 0 ) mass → charge → ≈2.3 MeV/c2 2/3 ≈1. 28 GeV/c2 2/3 2/3≈173 GeV/c 2 ≈4.8 MeV/c2 -1/3 ≈95 GeV/c2 -1/3 -1/3≈4.2 GeV/c 2 ≈0.511 MeV/c2 -1 ≈106 MeV/c2 -1 -1 ≈1.78 GeV/c2 <2.2 eV/c2 0 <0.17 MeV/c2 0 0<15.5 MeV/c 2 0 0 0 0 ≈91.2 GeV/c2 0 ≈80.4 GeV/c2 ±1 ≈125 GeV/c2 0 up u c t d s b g � Z W H e �e μ �µ �� �
charm top gluon Higgs boson
photon Z boson W boson bottom strange down
electron muon tau
electron muon tau neutrino
neutrino neutrino
Figure 1.1 – Standard-model particles
Figure 1.2 – Evolution of the strong coupling constant αs as function of the the energy scale
Q [eaPDGte]
densities) should enable the formation of anew state of matter where quarks and gluons,
together referred to aspartons, would evolve towards the asymptotically free region: the
quark-gluon plasma [CP75b,Shu78].
1.1.2 The phase transition
A deconfined state can only be formed in the regime of high-energy density and
temper-ature [CP75a]. The nature and the order of the phase transition from hadronic matter
to a quark-gluon plasma (QGP) is still debated today. The phase diagram of matter is
presented on Fig. 1.3 as a function of temperature and chemical potential (µB). At low
tem-perature and µB, matter can be represented as a gas of hadrons. For a given µB, the phase
Lattice-CHAPTER 1. INTRODUCTION TO THE QUARK-GLUON PLASMA
QCD calculations predict a smooth crossover transition at zero chemical potential around
155 MeV [FJ16]. A phase transition should occur for positive chemical potential from a
critical point [FK04]. In the high µBregion, a color superconducting state is expected to
form [ASRS08].
Figure 1.3 – Sketch of the phase diagram of hadronic matter
While the QGP may have existed a few millionths of a second after the Big Bang, it
can only be observed today throughultra-relativistic heavy-ion collisions. Such a state
might also be found inside the core of neutron stars [CP75b]. In the context of recent
gravitational-wave observations generated by the merger of two neutron stars [A+16a],
the study of their properties could be useful to extract information on the state of the
matter [AFJ+11,HLPS10,HLPS13].
1.2 Heavy-ion collisions
Ultra-relativistic heavy-ion collisions provide a unique opportunity to study matter
proper-ties atextreme energy densities. Considerable theoretical and experimental investments
were supported in the last 30 years to create and understand deconfined matter. Power-ful machines have been developed both at the Brookhaven National Laboratory (BNL) in the USA, with the AGS Alternating Gradient Synchrotron (AGS) and now Relativistic Heavy-Ion Collider (RHIC), and at Centre Européen pour la Recherche Nucléaire (CERN) in Switzerland with the Super Proton Synchrotron (SPS) and the LHC (Large Hadron Collider).
If the temperature and the energy density reached during the collision are high enough,
a deconfined state could form. At the LHC, it is expected at lower µBthan the critical point.
The created hot medium can be referred to as a fireball. The evolution of the fireball is
CHAPTER 1. INTRODUCTION TO THE QUARK-GLUON PLASMA
1.2.1 The Bjorken scenario
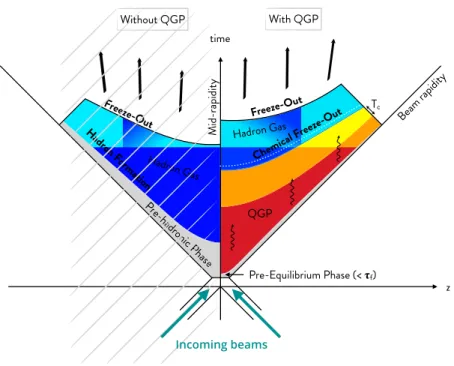
Before colliding, ultra-relativistic nuclei are Lorentz-contracted and therefore seen as flat instead of spherical in the center-of-mass system. The collision schematics is illustrated on Fig. 1.4 with (Right) or without (Left) the formation of a QGP. In the case where a phase transition occurs towards a deconfined state, its evolution follows several phases:
Pre-equilibrium state: If the crossing time of the nuclei is smaller than the time scale of
the strong interaction τstrong∼ 1/ΛQCD∼ 1 fm/c, parton interactions generate
parti-cles after the nuclei have already crossed each other. The crossing time is computed
from the nucleus radius R and the Lorentz factor γ as τcross= 2R/γ. In Pb–Pb
col-lisions at psNN= 5.02TeV, γ ∼ 2700 and R208Pb∼ 6.62 fm. Bjorken also assumes a
uniform distribution of the particle multiplicity as a function of the rapidity. Multiple partonic interactions with high-momentum transfer are occuring. The system is in a
pre-equilibrium state where inelastic scatterings possibly lead tothermalisation.
QGP phase and longitudinal expansion: If the energy density of the volume filled with particles is high enough, a deconfined state is formed. The formation of the QGP can be estimated as the time scale of the strong interaction and its size around 10–20 fm. After thermalisation, the QGP is expected to evolve like a fluid and is described through relativistic hydrodynamics. The QGP phase is estimated to survive between ∼ 5–10 fm/c. The system expands first longitudinally then in 3-dimensions.
Mixed phase: As the medium expands and cools down, partons hadronise and the system enters a mixed phase of hadron gas and QGP.
Hadronic gas: Once all quarks hadronise into partons, the expanding system can be described as a gas of hadrons.
Freeze-out: When the particle density is sufficiently low, interactions stop. The chemical freeze-out is reached when inelastic interactions cease and the relative abundances of hadrons are fixed. The kinetic freeze-out refers to the end of all elastic interactions and when particle momenta are fixed. The system keeps on expanding as particles travel in the vacuum.
In the case where the system size is too small or the number of participants too low, no QGP is formed. The non-equilibrium state will then evolve towards a hadronic gas after partons hadronise.
Several collision properties affect the system formation and evolution. Theenergy of
the collision (denoted psNNin the center-of-mass system) affects the initial energy density
of the QGP. The size, and therefore the nature, of the colliding nuclei (mainly Pb–Pb, S–U at SPS, Au–Au, Cu–Cu, U–U at RHIC, and Pb–Pb, Xe–Xe at the LHC) also impacts the number
of participants in the collision. Thenumber of participants 〈Npart〉, which corresponds to
the number of nucleons participating in the collision, provides an equivalent reference.
Alternatively, experiments use thecentrality observable of the collision. It refers to the
overlap region of the two colliding nuclei. Head-on, central collisions typically involve
more nucleons thanperipheral collisions. The centrality is computed from the impact
parameter b of the collision, the distance between the centres of the nuclei. The ALICE
collaboration estimates the centrality of collisions from the Glauber model [MRSS07] from
the collision volume and by describing nucleus-nucleus collisions as the superposition of independent binary nucleon-nucleon collisions. The full description of the method can
be found at [A+13b]. The system geometry can be studied through measurements with
CHAPTER 1. INTRODUCTION TO THE QUARK-GLUON PLASMA
time
z
M
id-rapidity Beam rapidity
Hadron G as Freeze-O ut H adr on F ormation Pre-hadr onic P hase QGP Chemical F reeze-O ut Hadron Gas Freeze-O ut T c Without QGP With QGP Pre-Equilibrium Phase (< �f) Incoming beams
Figure 1.4 – Space-time evolution of the system formed during heavy-ion collisions
1.2.2 Experimental signatures of the QGP
Because of the short lifetime of the deconfined state,no direct observation of it can be
performed. The properties of the system must be inferred from the final-state particles reaching the detectors. This specificity of heavy-ion physics creates a strong mutual depen-dence between theory and experiment as no conclusions can be drawn from observations alone. A wide range of probes have been proposed for the study and the characterisation of the QGP. Probes are usually divided according to their momentum scale into soft or hard probes.
Soft probes correspond to relatively small-momentum interactions and are the most abun-dant particles. They are produced along different stages of the collision and form the
bulk of the expanding fireball. The study of soft probes provides information on the
col-lective behaviour and thermodynamical properties of the medium (see Sec. 3). Within the statistical-model approach, the relative yields of light particles allow to extract the
temperature and the chemical potential of the freeze-out stage [ABMS09].Strangeness
en-hancement was among the first signatures of a QGP formation [RM82], as strange quarks
should be abundantly produced during the deconfined stage. Recent observations [A+17c]
suggest that strangeness enhancement is rather an indicator of the system equilibrium.
The production ofhard probes involves larger momentum scales and is therefore occurring
during the most energetic interactions, at the beginning of the collision. The modification of parton showers in the medium and the suppression of back-to-back correlations, known
asjet quenching, was first observed at RHIC [A+03a]. The measurement ofheavy-flavours
is also a key tool for the characterisation of the medium, further details can be found in Sec.4.1.
A single probe on its own cannot lead to the conclusion that a QGP has formed, as it might be independently explained by several models diverging on its interpretation.
Only aset of concomitant results can help understanding the medium formed during the
C
H A P T E R
2
S
T U D Y I N G E X P E R I M E N T A L L Y T H E
Q G P
W I T H
A L I C E
“In this world, there are things you can only do alone, and things you can only do with somebody else. It’s important to combine the two in just the right amount.”
— Haruki Murakami, After Dark
The conditions for the formation of a QGP are experimentally created through collisions of ultra-relativistic heavy ions. The chapter gives a brief description of the ALICE detector at the LHC which is dedicated to the study of heavy-ion collisions.
2.1 The LHC collider
The LHC [BCL+04] is currently the world’s largest and most powerful particle accelerator.
Based at CERN, it lies in a 50–100 m-deep tunnel beneath the Franco-Swiss border near Geneva in Switzerland. The first beam was steered at the end of 2008 in the 27-kilometres ring of superconducting magnets.
The LHC is optimised to deliverproton or ion beams. Protons are extracted from hydrogen
gas by applying an electric field to strip electrons. The beam then goes trough a complex of accelerators to gain more and more energy. The injection chain is illustrated on Fig. 2.1. Protons are first accelerated to the energy of 50 MeV via two linear accelerators (LINear ACcelerator (LINAC)-3 and LINAC-4). The beams reach the energy of 1.4 GeV in the Proton Synchrotron Booster (PSB)), 25 GeV in the Proton Synchrotron (PS) and 450 GeV in the SPS, which injects to the LHC. Ion beams can also be injected to the SPS, then to the LHC, after being stripped out of their electrons and accelerated through LINAC-3, Low-Energy
Injector Ring (LEIR) and PS. Lead (82Pb), or more recently Xenon (54Xe), ions are injected
and collided at the LHC. A ultra-high vacuum is required in the two beam pipes of the LHC where beams circulate in opposite directions and collide at six different locations corresponding to dedicated experiments:
, designed to study the properties of the QGP through heavy-ion collisions,
A Toroidal Lhc ApparatuS (ATLAS) and Compact Muon Solenoid (CMS) , general-purpose detectors, mainly investigating physics beyond the standard model through pp colli-sions
Large Hadron Collider beauty (LHCb) , designed to study the asymmetry between matter and anti-matter by focusing on beauty measurements
CHAPTER 2. STUDYING EXPERIMENTALLY THE QGP WITH ALICE
Figure 2.1 – CERN’s accelerator complex
TOTal cross section, Elastic scattering and diffraction dissociation Measurement at the LHC (TOTEM) focusing on proton physics.
The ATLAS, CMS and LHCb experiments have also a dedicated heavy-ion program and provide complementary observations to the A Large Ion Colliding Experiment (ALICE) results.
CHAPTER 2. STUDYING EXPERIMENTALLY THE QGP WITH ALICE
2.2 The ALICE detector
ALICE is the onlyheavy-ion dedicated experiment at the LHC. The Letter of Intent [CER93]
for the detector was submitted 25 years ago to the CERN LHC Committee, completed a few years later with several addenda formulated as technical propositions, including the
Muon Spectrometer [CER96] in 1996 to study quarkonia via their dimuon decays. The
collaboration gathers today over 1800 members in 42 countries.
This section describes the detector status during LHC run II and focuses on the
sub-detectors involved in the J/ψ v2analysis at forward rapidity. The 10000-ton apparatus is
composed of a central detector system at mid-rapidity and a muon arm at forward rapidity. The detector is made of several specific sub-detectors for the detection and the tracking of particles and decay products produced during the collision (see illustration on Fig. 2.5).
For a full description of the ALICE detector, please refer to [A+08]. A review of the detector
performances is also available here [A+14g].
2.2.1 The ITS
The ITS is a cylindrical vertex detector located around the beam pipe at the Interaction Point (IP). The reconstruction of primary vertices (and secondary if the decay length is larger than the 100 µm resolution of the detector) is performed by tracking particles through the 6 silicon layers divided into three sub-systems (see Fig.2.2). The two innermost layers compose the Silicon Pixel Detector (SPD), the two middle ones form the Silicon Drift Detector (SDD) and the two outermost layers compose the Silicon Strip Detector (SSD).
The ITS provides also an extended tracking with respect to the central-barrel for low-pT
tracks. The detector covers the pseudorapidity range |η| < 0.9.
SPD 3.9 - 7.6 cm SDD 15 - 23.9 cm SSD 38 - 43 cm
Figure 2.2 – The Inner Tracking System (ITS)
2.2.2 ZDC
The ZDC detector [CER99] consists of two types of calorimeters. Two sets of quartz-fiber
CHAPTER 2. STUDYING EXPERIMENTALLY THE QGP WITH ALICE
sides of the IP at z ± 116 m and measure the energy of spectator nucleons in order to determine the centrality of the collision. Two electromagnetic calorimeters (ZEM) at forward rapidity (at 7 m from the IP) provide an additional discrimination between the most central and peripheral events where the detected number of spectators crossing the hadronic calorimeters can be fairly similar due to the fragmentation of the nuclei.
2.2.3 The V0
The V0 detector [CER04] consists of two arrays of scintillators perpendicular to the beam
direction and located asymmetrically on each side at z = 340 cm (VZERO-A (V0A)) and z = -90 cm (VZERO-C (V0C)) of the IP. Both arrays are divided into four rings, each segmented into eight sectors. The V0 provides rejection of beam-gas events by measuring the time-of-flight difference between both arrays, and it is therefore used as a minimum-bias trigger. In addition, the detector can also provide an estimation of the luminosity, particle multiplicity, collision centrality, and event plane direction.
2.2.4 The T0
The T0 detector [CER04] has a similar geometry to the V0 as it is composed of two arrays
of detectors (T0A and T0C) located on both sides of the IP next to the V0 detectors (z = 350 cm and z = -70 cm). The arrays are made of 24 Cherenkov counters with a good time resolution (better than 50 ps), providing the collision signal for the Time Of Flight (TOF) detector, a precise determination of the vertex position (within 1.5 cm), an estimation of the particle multiplicity and a minimum-bias trigger.
2.2.5 The TPC
Tracking and particle identification at mid-rapidity are performed in the TPC [CER00]. The
TPC is located around the ITS (between z = ± 250 cm) and consists of a cylindrical volume
(87 < r < 247 cm) filled with a Ne − CO2(90–10 %) gas mixture for precise momentum and
dE/dx measurements of charged particles (see Fig. 2.3). The drift cage is completed by two read-out planes on the end caps. The active drift volume is divided by the central high-voltage electrode providing a field of 400 V/cm.
2.2.6 The muon arm
The Muon Spectrometer is a forward detector designed to detect muons with a polar angle of 171° < θ < 178° with respect to the beam axis and in the pseudo rapidity coverage -4 < η < -2.5. The main physics motivations are the study of open heavy flavours, quarkonia, electroweak bosons and low-mass mesons. The detector consists of a frontal absorber, ten planes of tracking chambers, a dipole magnet, a second absorber and 4 planes of trigger chambers as illustrated on Fig. 2.4.
The frontal absorber was developed to shield the spectrometer from the flux of charged hadrons and minimise the muonic background from π and K decays. It is located at 90 cm from the interaction point with a length of 4.13 m (∼ 10 interaction lengths). Its composi-tion was optimised to reduce multiple scatterings which affect the mass resolucomposi-tion of the spectrometer. Therefore, low-Z materials (Carbon) were chosen for the closest layers to the vertex and high-Z materials (Lead and polyethylene) at the rear end. The middle layers
CHAPTER 2. STUDYING EXPERIMENTALLY THE QGP WITH ALICE
ALI-PUB-108114
Figure 2.3 – Specific energy loss (dE/dx) in the TPC versus rigidity (momentum/charge) in 0–80 %
Pb–Pb collisions at psNN= 2.76TeV. The solid lines represent a parametrisation of the Bethe-Bloch
curve. Figure taken from [A+16i]
Figure 2.4 – Layout of the Muon Spectrometer in the (z,y) plane (Distances in mm). Figure taken
from [CER13a]
are made of concrete.
The tracking chambers consist of ten high-granularity Multi-Wire-Proportional
Cham-bers (MWPC) filled with a gas mixture of Argon (80%) and CO2(20%). The chambers are
arranged in five stations between z = -5.2 m and z = -14.4 m, achieving a spatial resolution of 100 µm in the bending plane.
The dipole magnet, covering the middle tracking station, provides an integral field of 3 Tm creating a magnetic field perpendicular to the beam axis, for particle momentum and charge determination.
CHAPTER 2. STUDYING EXPERIMENTALLY THE QGP WITH ALICE
the tracking chamber. Its purpose is to shield the trigger system from energetic hadrons and secondary particles.
The trigger system is made of four planes of 18 Resistive Plate Chamber (RPC) arranged in two stations (MT1 and MT2). The system triggers events containing at least one muon
with a pTabove an adjustable threshold.
2.2.7 Triggering System and Data Acquisition
The Central Trigger Processor (CTP) is a three-level architecture which triggers data acqui-sition system. It selects potentially interesting events and deals with detector latencies. Depending on the physics program, trigger classes are defined as the logical combination of several detector inputs. The first trigger inputs (L0) are sent by fast trigger detectors 1.2 µs after the collision (V0, T0, SPD, ElectroMagnetic Calorimeter (EMCal), PHoton Spectrom-eter (PHOS), and Muon Trigger (MTR)). If the conditions of the trigger class are fulfilled, the CTP sends a signal to the corresponding readout detectors. The second level (L1) corresponds to trigger inputs issued after some online calculations. The signal is issued with latency of 6.5 µs due to the computation time in the Transition Radiative Detector (TRD) and EMCal and the propagation times to the ZDC. The final level decision (L2) is taken about 100 µs after the collision corresponding to the TPC drift time. Detector data are sent subsequently to the ALICE Data AcQuisition (DAQ) system and to the High Level Trigger (HLT). The HLT filters and compresses data from a fast online reconstruction and the LHC bunch filling scheme. If all selection requirements are met, the event is registered to Permanent Data Storage (PDS). Recorded events are then processed and reconstructed after passing quality assurance to be ready for data analysis.
Several trigger classes are included in this analysis. The CMUL triggers are selected for J/ψ measurement via dimuon reconstruction. The other triggers are mainly used for normalisation purposes, as well as flow vector measurement and calibration.
Minimum Bias (MB) (CINT7-B-NOPF-MUFAST), defined as a logical AND of a signal in the V0A and a signal in the V0C
Dimuon unlike (CMUL7-B-NOPF-MUFAST), requiring at least two opposite-sign muons
above the low-pTmuon track cut ptriggerT > 1 GeV/c
Dimuon like (CMLL7-B-NOPF-MUFAST), requiring at least two same-sign muons above
the low-pTmuon track cut p
trigger
T > 1 GeV/c
MUSPB (CINT7-B-NOPF-CENT), defined as the combination of the single muon trigger and a logical OR of a signal in the V0A and a signal in the V0C
Thephysics selection is an offline selection of events based on timing information
CHAPTER 2. STUDYING EXPERIMENTALLY THE QGP WITH ALICE F ig u re 2.5 – T he ALICE app ar atus and it s su b detect ors
CHAPTER 2. STUDYING EXPERIMENTALLY THE QGP WITH ALICE
2.3 The Muon Forward Tracker upgrade
The ALICE detector is preparing for a challengingupgrade of several sub-systems during
the next shutdown [A+14d]. The strategy is aligned with the LHC luminosity increase of
Pb–Pb collisions. The future interaction rate is foreseen to reach 50 kHz in Pb–Pb
colli-sions, corresponding to an instantaneous luminosity of L = 6 cm−1s−2× 1027cm−1s−2,
and 200 kHz in pp and p–Pb collisions. To make the most of this unprecedented oper-ating conditions and enable the read-out of all interactions, several improvements and modifications of the current ALICE detector will be addressed. The upgrade consists of:
• asmaller beam pipe, reducing the radius from 29.8 mm down to 19.2 mm
• two new high resolution silicon trackers based on Complementary Metal–Oxide–Semiconductor
(CMOS) sensors
– the current ITS covering the mid-rapidity region will be replaced with seven layers of sensors for an improved tracking efficiency and resolution, particularly
at low pT, and an increased read-out rate [A+14c]
– a new tracker will be installed at forward rapidity to add vertexing capabilities to
the current Muon Spectrometer:the Muon Forward Tracker [CER13a,CER15]
• the replacement of the existing wire chambers in the TPC withGas Electron
Multi-plier (GEM) detectors and a new pipelined read-out electronics to operate in
contin-uous mode [CER13b]
• anupgraded read-out electronics of the TRD, TOF detector, and the Muon
Spec-trometer [AKR]
• a new integrated online-offline computing system (O2) to handle the expected
3.4 TB/s data flow and 100 GB/s data-to-storage rate [BKVV15] as detector read-out
will be activated either by a minimum bias trigger or in a continuous mode.
The upgrade will significantlyexpand the current capabilities of the apparatus. A
total of 10 nb−1 Pb–Pb collisions is expected to be collected. The statistical gain
com-bined with the enhanced capabilities of the detector will enable to address the next physics
program of ALICE, focusing onhigh-precision measurements of rare processes at low pT.
This section focuses on the Muon Forward Tracker upgrade and specifically on the characterisation of the detector sensor performed as part of this thesis.
2.3.1 Physics motivations
The addition of the Muon Forward Tracker (MFT) aims tofully exploit the kinematic
range of the Muon Spectrometer by addressing several intrinsic limitations. The physics program focuses on charmonium dynamics, heavy quark thermalisation and energy loss in the QGP, beauty physics and the study of chiral symmetry breaking and restoration through low-mass vector mesons. Currently, multiple scatterings in the frontal absorber and the distance of the spectrometer to the collision point smear out information on the primary vertex. The accessible track resolution by extrapolating from the spectrometer to match the MFT reconstructed tracks before the frontal absorber would benefit the study of open heavy flavours, quarkonium states and low mass dimuons.
CHAPTER 2. STUDYING EXPERIMENTALLY THE QGP WITH ALICE
The MFT upgrade project aims to address the current design limitations of the Muon Spectrometer:
• the background level in both single-muon and dimuon analyses by rejecting muons coming from semi-muonic decays of pions and kaons (particularly significant for
low masses and at low pT)
• the inclusive charmonium production by providing a reliable separation of prompt
and non-prompt J/ψ production down to zero pT
• open heavy flavour study down to pT∼ 2 GeV/c by separating charm and beauty
components without relying exclusively on model assumptions • the poor angular resolution for low masses (ω, φ mesons).
More details can be found in the Letter of Intent [CER13a] and the Technical Design
Report [CER15] of the MFT.
2.3.2 Overview of the detector
General layout and environment
The MFT will standbetween the interaction point and the frontal absorber of the muon
arm by surrounding the beam pipe (Fig.2.6). It consists of two half-cones made of 5 half-disks along the beam axis. The pseudo-rapidity acceptance will cover 3.6 < η < 2.45.
Figure 2.6 – MFT layout and position within the ALICE apparatus [CER15]
The detection sensors are soldered on vertical mechanical ladder structures with alu-minium strips to a flex printed circuit. Each half-disk contains 2 detection planes (front and back) and consists of 24 to 34 sensor ladders, a disk support, two PCB Printed Circuit Board (PCB) disks and a disk spacer. The geometrical characteristics of the MFT half-disks are reported in Tab. 2.1.
The highest hit density was estimated about 12.9 particles/mm2from central Pb–Pb
collisions at psNN= 5.5TeV. The accumulated radiation level over operation is expected
to reach up to 5.91 × 10¹²MeVneq/cm of non-ionizing energy loss and 380 krad of total
ionizing dose, including a safety factor of ten. Detector technology
To achieve the objectives of the physics program, the future MFT sensors must fulfil several specifications, reported in Tab. 2.2, established from Monte-Carlo simulations. To meet with the required low-material budget, the sensors are thinned down to 50 µm.
CHAPTER 2. STUDYING EXPERIMENTALLY THE QGP WITH ALICE Half-Disk 0 1 2 3 4 Full MFT Inner radius (mm) 25.0 25.0 25.0 38.2 39.2 -Outer radius (mm) 92.6 98.0 104.3 130.1 143.5 -z-position (mm) 460 493 531 687 768 -No. sensors 64 64 76 112 132 896 No. ladders 24 24 26 32 34 280
Table 2.1 – Geometrical details of the MFT half disks (radius, position, number of sensors and
number of ladders), table taken from [CER15]
Detection: Given the similar requirements of the ITS upgrade, the same sensor was selected, with a common R&D and characterisation effort between both ITS and MFT
teams. In addition, the MFT sensors will cover a much smaller surface (0.4 m2) compared
to the upgraded ITS (10.3 m2).
Parameter value spatial resolution 5 µm pixel pitch 25 µm detection efficiency > 99.5 % integration time 20 µs sensor thickness 50 µm power dissipation <150 mW/cm2
Table 2.2 – MFT sensor requirements
Many tracking devices involve silicon microstrip and pixel sensors with read-out
elec-tronics based onCMOS technology. The technology shows great features in terms of
granularity, material thickness, read-out speed, power consumption and radiation
hard-ness. CMOS Monolithic Active Pixel Sensor (MAPS) integrateboth sensor and read-out
electronics into a single detection device, allowing interface optimisation between the sensor and the read-out electronics. The main advantage with respect to hybrid pixels is
thelower material budget and power consumption but the radiation tolerance is limited.
MAPS pixel have already been implemented on a large scale with the Solenoidal Tracker At RHIC (STAR) PXL detector at RHIC in 2015 and research has been conducted for many years on this technology. The more restrictive requirements of the ITS/MFT detectors do not allow to use the same sensors as STAR, and a new chip was thus developed.
The TowerJazz 0.18 µm CMOS Imaging Sensor Process was selected for the future sensors.
The technology offers several advantages, starting with thehigh resistivity (> 1 kΩcm)
p-type epitaxial layer that provides an efficient charge collection and an improved
radia-tion tolerance through the possibility of applying areverse substrate bias to the collection
diode. A schematic cross section is illustrated on Fig. 2.7. Charged particles passing through the epitaxial layer produce electron-hole pairs along their path through many scattering processes in the absorbing material. In the case of charged particles heavier than the electron, the mean rate of energy loss is described by the Bethe-Bloch formula. The energy loss is a discrete stochastic process depending on the particle type and momentum. The formula can be corrected with additional terms such as density and shell corrections.
CHAPTER 2. STUDYING EXPERIMENTALLY THE QGP WITH ALICE
Created charges in the sensor volume are collected by the n-well diode electrodes (the depletion volume is represented in white on the schematic cross section).
Figure 2.7 – Schematic cross section of a CMOS pixel sensor using TowerJazz 0.18 µm CMOS Imaging
Process, figure taken from [A+14d]
The deep p-wells shielding p-channel Metal Oxide Semiconductor (PMOS) transistors together with the 6 metal layers allow the integration of the front-end circuitry with a
very low-power consumption (<40 mW/cm2). The pixel chip consists of 512 rows x 1024
columns of 27 x 29 µm2charge collection diodes on a single silicon die of about 15 mm×
30 mm.
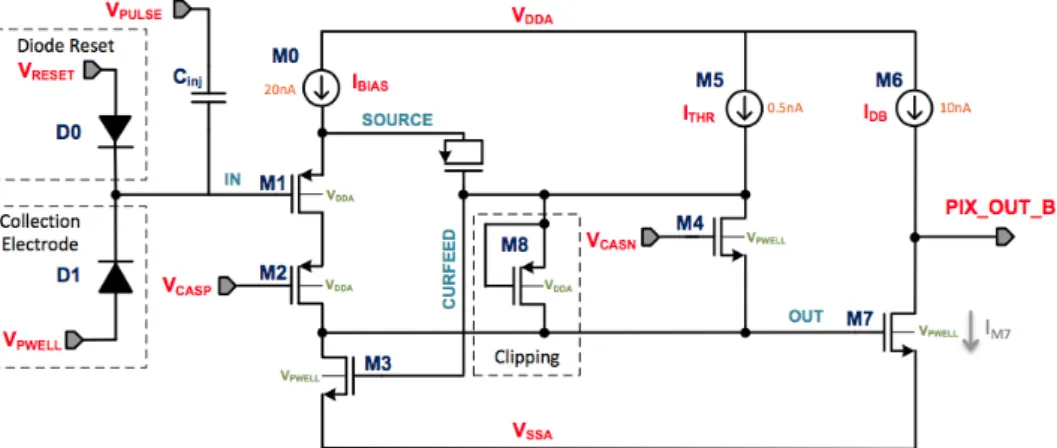
Front-end electronics: The surface electronics performs signal amplification, digitisa-tion and zero-suppression. The schematics of the matrix is illustrated on Fig. 2.8 with successive zooms onto the chip regions.
Epitaxial layer Low resistivity substrate
Peripheral circuitry Pixel matrix
Figure 2.8 – Layout of the final pixel matrix (Bottom), zoom over several pixels (Top Left), the pixel region (Middle) and the pixel geometry (Top Right)
The output signal is the PIX_OUT_B node which is high in static behaviour and becomes active when driven low. The dynamic behaviour of the analogue front-end can be described
CHAPTER 2. STUDYING EXPERIMENTALLY THE QGP WITH ALICE
capacitance Cinj) causes a potential drop at the IN node. The circuit is then divided into a
gain stage and a discrimination stage. The increase of source-to-gate voltage generates
an additional current to flow through the PMOS cascade (M1,M2) from the current source
IBIAS, charging the OUT node. The node is restored as the voltage becomes close to the gate
potential VCASNof the M4transistor and reduces its conductance. Thus the value of the
VCASNvoltage sets the baseline of the OUT potential. The current ITHRwill therefore flow
through the CURFEED node, opening the M3transistor and discharging the OUT node.
The duration of the restoration process and the pulse shape can be adjusted with the ITHR
current. A clipping mechanism was added to limit the pulse duration. Then the transistor
M7becomes conductive again and the CURFEED node is also restored. During the time
laps where the OUT potential is larger than the critical voltage of the M7n-channel Metal
Oxide Semiconductor (NMOS) transistor, the latter becomes conductive. If the current
from the bottom line (VSSA) exceeds the IDBcurrent, the PIX_OUT_B will be driven low and
becomes high again once the OUT node is discharged.
The front-end electronics is completed by a novel read-out approach, faster than the traditional rolling shutter architecture.
Figure 2.9 – Schematic drawing of the analogue front-end of the Prototype ALPIDE-3 (pALPIDE-3) chip
Diode geometry and reset mechanisms: Different geometries for the n-well collection diode were investigated with small-scale prototypes. Several diameters and spacings between the n-well and p-well with the selected octagonal shape were tested for the full-scale Prototype ALICE PIxel DEtector (pALPIDE) prototypes. Both distances are illustrated on Fig. 2.10 for both reset mechanisms. The front-end presents two implementations depending on the reset of the collection diode.
Read-out: A novel Address Encoder Reset Decoder (AERD) asynchronous circuit was implemented with respect to the traditional rolling-shutter architecture to achieve the low-power consumption, fast read-out and short integration time requirements. The AERD read-out is data-driven and is based on priority logic, reading only the hit pixels. It is arranged in double columns inside the matrix (see Fig. 2.11) and pixel outputs are treated by successive four-input blocks. This architecture loops over all hit pixels, and then encodes, propagates, and resets their addresses to the chip periphery, ensuring data-compression before storing information in the chip memory.
Data acquisition can be performed either in atriggered or a continuous integration
CHAPTER 2. STUDYING EXPERIMENTALLY THE QGP WITH ALICE
Figure 2.10 – Schematic view of a pALPIDE collection diode with a diode (Left) or PMOS (Right) reset mechanism
Figure 2.11 – Structure of the ALICE PIxel DEtector (ALPIDE) AERD circuit, figure taken from [Y+15]
acquisition window. Upon the end of the fixed-duration window (∼ 250 ns), the read-out of the pixel matrix is initiated and data are transferred to the memory blocks. In the continuous integration mode, the trigger is asynchronous from physics events. The acquisition window stays open between signals that trigger the matrix read-out.
CHAPTER 2. STUDYING EXPERIMENTALLY THE QGP WITH ALICE
Figure 2.12 – Illustration of the triggered (Left) and continuous integration (Right) read-out modes
with three in-pixel memory cells, figure taken from [Szc16]
2.4 CMOS prototype characterisation
The final sensor was the result of several years of R&D design and an extensive characteri-sation campaign.
2.4.1 Measurement techniques
About 300 prototypes were tested, both in the laboratory forsetting optimisation and
pulse-shape measurements and undertest beams in several facilities for measurements of
spatial resolution, detection efficiency, noise, charge collection efficiency, chip-by-chip variation effects and other external parameters (temperature, track multiplicity, irradiation, etc...).
Laboratory measurements
After production, the chips are checked for faults and characterised to find their optimal operation settings. Chips are wire-bonded to carrier boards and connected to read-out DAQ boards with usb ports for readout and control functionality (see Fig. 2.13).
Figure 2.13 – DAQ read-out board connected an ALPIDE chip
CHAPTER 2. STUDYING EXPERIMENTALLY THE QGP WITH ALICE
extract average values. The AlpideAnalysis software was developed to perform tests and analyse the results. Examples of tests are:
• Threshold and temporal noise: A charge can be injected into the preamplifier of
each pixel by applying a voltage step to the injection capacitance (Cinj). The injected
charge is increased to find the threshold to fire the pixel. The pixel noise is the width of the charge step (yellow width on Fig. 2.14, Left). Threshold variations between pixels are taken into account by performing threshold tests over several pixels for each sector of a prototype (see Fig. 2.14, Right). Several parameters affects the pixel
Figure 2.14 – (Left) Illustration of a threshold scan: number of hits as a function of the injected charge for a single pixel (black points) with a fit (red line), (Right) Example of threshold distribution for 1 % of pixels inside each sector of an pALPIDE-3 chip
response, all were studied to find the optimal values. For example, pixel threshold
and temporal noise depend on the values of the ITHRcurrent and the VCASNvoltage.
Fig. 2.15 illustrates the dependency on a 2D-map for a given sector.
Figure 2.15 – Example of 2D-maps of treshold (Left) and noise (Right) dependence versus the ITHR
and VCASNparameters
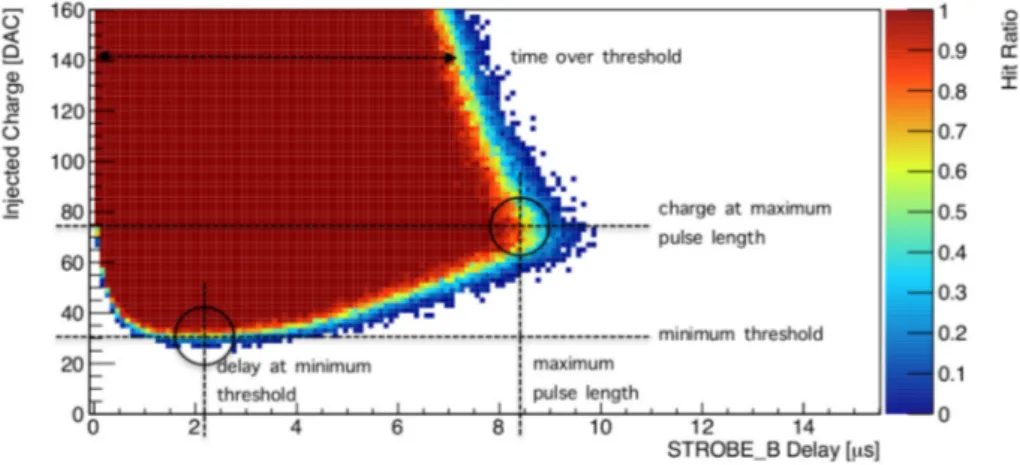
• Pulse shape: The strobe delay with respect to charge injection affects the hit-detection
probability. By scanning the pulse shape dependence as a function of the injected charge and the strobe delay, several characteristic parameters can be extracted.
• Noise occupancy: Some tests were conducted to measure the fake-hit rate of the
matrix. Masking a small fraction of noisy pixels reduces significantly the total fake-hit rate.
CHAPTER 2. STUDYING EXPERIMENTALLY THE QGP WITH ALICE
Figure 2.16 – Example of 2D-pulse-shape scan with definition of characteristic parameters
Test beam campaign
After optimisation of the pixel settings, the chip performances were tested into several
test-beam facilities, namely Beam Test Facility (BTF) in Frascati (450 MeV e−beam), Deutsches
Elektronen-Synchrotron (DESY) in Hamburg (5 GeV e−beam), Pohang Accelerator
Labora-tory (PAL) in Pohang (60 MeV e−beam), Synchrotron Light Research Institute (SLRI) in
Nakhon Ratchasima (1 GeV e−beam), PS at CERN (6 GeV π−beam),SPS at CERN (120 GeV
π−beam) and U—120M in ˇRež (300 MeV proton beam). Seven chips are placed inside an
experimental setup, named telescope, holding the chips in place. The middle three chips are tested (denoted Device Under Test (DUT)) and the others are used for the alignment. The telescope is illustrated on Fig. 2.17 containing chips connected to their DAQ boards. The beam configuration is set up and monitored with scintillators.
Figure 2.17 – (Left) Layout of the telescope and (Right) setup for test beam at PS (CERN)
Data were analysed within the EUTelescope framework (designed and supported by the DESY collaboration).This group of processors is used for DUT measurements and provides a full-featured infrastructure for analysis and reconstruction of data taken with pixel beam telescopes. The test-beam analysis was oriented towards detection efficiency, noise occupancy, spatial resolution, and cluster size. Examples can be found on Fig. 2.18. Other systematic studies were conducted. For example chip fluctuations were in-vestigated both through laboratory and test beam measurements to ensure a realistic description of the chip characteristics. The temperature dependency of the signal response
CHAPTER 2. STUDYING EXPERIMENTALLY THE QGP WITH ALICE
Figure 2.18 – (Left) Detection efficiency (in black, legend on the left) and fake hit rate (in red, legend on the right), (Right) spatial resolution (in black, legend on the left) and cluster size (in red, legend on the right) of ALPIDE chips with different irradation levels
was also characterised since the temperature of the chip rises during its operation to reach
∼ 25–30◦C. Some tests were also carried out with a cooling system on the chip and no
major variation was observed. The impact of dead pixels inside a matrix on the chip per-formances was also studied, masking a few noisy pixels was very successful and allows to significantly improve the overall performances of the chip. Applying back-bias voltage (up
to Vbb= − 6 V) also significantly improves the performances of the sensor (new chips do
not require to apply back-bias but a larger margin of operation is available, which might be exploited after irradiation).
2.4.2 ALPIDE prototypes
Several prototypes were developed to test and optimize the features of the final sensors. Full-scale prototypes were produced from 2014 (Prototype ALPIDE-1 (pALPIDE-1), Pro-totype ALPIDE-2 (pALPIDE-2) and pALPIDE-3). Tests were also conducted on irradiated chips to study the long-term behaviour of the chip in the expected radiation environment inside the ALICE detector. A complete description of the characterisation can be found at
[vHKR15,RSM16,VKSGO17,BAB16].
pALPIDE-1
The pixel matrix is divided into 4 sectors of 256x512 pixels with different spacing and/or reset mechanisms. The chip is 28.7 mm by 14.3 mm and its total thickness approximates 50 µm depending on the epitaxial layer. About 130 pALPIDE-1 prototypes were produced and tested with different epitaxial layer thickness. Increasing the epitaxial thickness en-larges the volume for charge generation (higher number of e–h pairs) but this also implies a larger diffusion volume. In terms of noise occupancy and detection efficiency, the sector 0 falls behind the others. The enhancing parameters are the diode reset and the larger spacing.
pALPIDE-2
In parallel, a second full-scale prototype was tested, featuring the final interface, the high-speed link excepted. To give more space for in-pixel circuitry, the pixel size was reduced. The matrix is divided into four sectors with different spacings, input transistor sizes and reset mechanisms (see Tab. 2.4). Different epitaxial layer properties (thickness) were tested. Pixels with a wider input transistor exhibit a lower fake-hit rate. The required performances after irradiation are met when applying back bias for 25 µm– and 30 µm–thick epitaxial
CHAPTER 2. STUDYING EXPERIMENTALLY THE QGP WITH ALICE
Sector Nwell diameter Spacing Pwell Reset
0 2 µm 1 µm 4 µm PMOS
1 2 µm 2 µm 6 µm PMOS
2 2 µm 2 µm 6 µm diode
3 2 µm 4 µm 10 µm PMOS
Table 2.3 – pALPIDE-1 sectors
layers. Comparisons of the different sectors show that larger spacing and input transistor are beneficial.
Sector Spacing Input transistor Reset
0 2 µm small PMOS
1 2 µm large PMOS
2 4 µm small PMOS
3 4 µm small diode
Table 2.4 – pALPIDE-2 sectors
pALPIDE-3
The last prototype was dedicated to the optimisation of the front-end electronics (see Tab. 2.5). The characterisation focused on 18–25 µm thickness. From the results of the previous prototypes, the sectors 3, 5 and 7 were specifically investigated, in particular for back bias performances. The decision criteria were the detection efficiency with respect to fake-hit-rate and the pulse shape. The chip contains the final high-speed connection and the three in-pixel hit buffers. A second version (Prototype ALPIDE-3b (pALPIDE-3b))
was produced with an increased input size and VCASPtransistors to reduce the Random
Telegraph Signal (RTS) noise.
Sector M3, M5, M6, M8 M9 M6 Clipping M1 Bulk Reset Spacing
0 optimized yes diode conn. AVDD diode 2 µm
1 optimized no diode conn. AVDD diode 2 µm
2 previous no diode conn. AVDD diode 2 µm
3 optimized yes VCLIP AVDD diode 2 µm
4 optimized yes VCLIP SOURCE diode 2 µm
5 optimized yes VCLIP SOURCE diode 3 µm
6 previous no diode conn. AVDD PMOS 2 µm
7 optimized yes VCLIP AVDD PMOS 2 µm
CHAPTER 2. STUDYING EXPERIMENTALLY THE QGP WITH ALICE
The final sensor
The pixel characterisation for the future ITS/MFT detectors was conducted over several months through small-scale and full-scale prototypes. A deep understanding of the pa-rameters influencing the chip behaviour – both from the collecting diode geometry, the epitaxial layers properties, and the front-end electronics – was achieved. The performances from all full-scale prototypes fall within the detector requirements, in particular in terms of detection efficiency, noise occupancy, spatial resolution and cluster size, even after irradiation. The recommendations for the final sensor correspond to the sector 5 of the 18 µm pALPIDE-3 chip with a diode reset, a 3 µm– spacing and optimized transistors. The
pixels have a large margin to operate with a back-bias at Vbb= −3V where the pulse shape
C
H A P T E R
3
E
L L I P T I C F L O W
“You live as long as you dance."
— Rudolph Nureyev
Studies of collective phenomena have greatly contributed to the description of the system created during high-energy nucleus-nucleus collisions. If the system is strongly
interacting, alocal thermal equilibrium should be established and maintained so that
the fireball evolution may be described as afluid undergoing collective motion [A+05b]
with ashort thermalisation time. The collective expansion of the created hot and dense
matter is developed from the initial pressure gradients and is particularly sensitive to the
interactions among constituents [Oll92]. One of the major and most suprising discoveries
in the field is the quantitative good description of heavy-ion collisions byrelativistic
hydrodynamics [RZ06], allowing to access theshear viscosity of the medium. An excellent
review of elliptic flow measurements from AGS to the first LHC run is available at [Sne11].
This chapter focuses on elliptic flow measurements. Heavy-ion collisions exhibit size-able azimuthal anisotropy coefficients, usually attributed to collective phenomena. Ini-tially associated to light flavours, these observations have recently been extended to the heavy-flavour sector. More surprising are the similar features observed in smaller collision systems, where no QGP is expected to form.
3.1 Azimuthal asymmetry
Anisotropic flow is thesystem response to the initial collision geometry as the two nuclei
collide. The final azimuthal anisotropies in the momentum distributions are thought to originate from the initial spatial asymmetry of the system and are developed through multiple interactions between the medium constituents at an early stage in the system evolution. The collision geometry varies with the impact parameter of the nuclei. In non-central collisions the overlap region of the two colliding nuclei is azimuthally asymmetric.
The symmetry plane of the initial geometry, referred to asreaction plane, is spanned by
the impact parameter vectors and the beam direction, as illustrated on Fig. 3.1. The initial geometry of the system is almond-shaped, and as it expands and cools down, the pressure gradients drive it towards a more symmetric shape (cf Fig. 3.2).
The particle momentum distribution with respect to the reaction plane can be
decom-posed into a Fourier series [VZ96] as:
Ed 3N d3p = 1 2π d2N pTdpTdy{1 + ∞ X n=1 2vncos(n(φ −ΨRP))}. (3.1)
CHAPTER 3. ELLIPTIC FLOW
Figure 3.1 – Illustration of the reaction plane
Figure 3.2 – Time evolution of the transverse energy-density profile for non-central heavy-ion
collisions [KH03]
For each flow harmonic, the corresponding nth flow coefficient can be experimentally
measured as the average over all particles in all events vn= 〈cos[n(φ −ΨRP)]〉. The first
coefficient corresponds to the direct flow and the second coefficient is called theelliptic
flow. The v2 coefficient is positive in the case where the in-plane region contains more
particles in the final particle distribution than the out-of-plane region. Higher harmonics are related to fluctuations in the initial parton distributions inside the nuclei, including the
triangular coefficient v3. Event-by-event fluctuations are studied through odd harmonics
(v3and v5).
The second harmonic is particularly sensitive to the equation-of-state, transport properties and early times of the system due to the geometry of the collision. Particle anisotropy can
also have a non-collective origin. For example high-pTparticles traverse a longer distance
moving out-of-plane than in-plane, thus out-of-plane particles should experience more scattering and energy loss.
3.2 Observations in A–A collisions
Experimental observations of elliptic flow were first performed at the BNL AGS [B+94,
B+97], at the CERN SPS [A+03d], and at RHIC [A+01a] and are addressed by all the current
heavy-ion physics programs. Flow studies usually focus on its dependence on centrality, particle transverse momentum, and mass. This section highlights some of the main results in A–A collisions.
The comparison of flow measurements at different facilities as a function of the
colli-sion energy is illustrated on Fig. 3.3 for semi-central collicolli-sions (integrated over the 20–30 % centrality range), where elliptic flow typically reaches its maximum value. The comparison
![Figure 2.7 – Schematic cross section of a CMOS pixel sensor using TowerJazz 0.18 µm CMOS Imaging Process, figure taken from [A + 14d]](https://thumb-eu.123doks.com/thumbv2/123doknet/7793562.260224/28.892.228.681.178.436/figure-schematic-section-sensor-towerjazz-imaging-process-figure.webp)


![Figure 3.12 – Comparison of elliptic-flow p T evolution for charm quarks, mesons and baryons [LM03] at RHIC with zero charm v 2 (labelled with v 2c = 0) or the same flow for charm and light quarks (unlabelled)](https://thumb-eu.123doks.com/thumbv2/123doknet/7793562.260224/46.892.240.672.642.951/figure-comparison-elliptic-evolution-quarks-baryons-labelled-unlabelled.webp)
![Figure 4.9 – J/ψ nuclear modification factor at forward rapidity as a function of the collision energy in different centrality ranges [A + 11c, A + 12e, A + 12c, A + 17d]](https://thumb-eu.123doks.com/thumbv2/123doknet/7793562.260224/60.892.170.747.571.969/figure-nuclear-modification-rapidity-function-collision-different-centrality.webp)
![Figure 4.13 – J/ψ v 2 at p s NN = 200GeV measured by STAR and compared to theoretical predictions and other particle measurements [A + 13d]](https://thumb-eu.123doks.com/thumbv2/123doknet/7793562.260224/63.892.190.669.125.724/figure-measured-star-compared-theoretical-predictions-particle-measurements.webp)
