HAL Id: hal-01418137
https://hal.archives-ouvertes.fr/hal-01418137
Submitted on 16 Dec 2016
HAL is a multi-disciplinary open access
archive for the deposit and dissemination of
sci-entific research documents, whether they are
pub-lished or not. The documents may come from
teaching and research institutions in France or
abroad, or from public or private research centers.
L’archive ouverte pluridisciplinaire HAL, est
destinée au dépôt et à la diffusion de documents
scientifiques de niveau recherche, publiés ou non,
émanant des établissements d’enseignement et de
recherche français ou étrangers, des laboratoires
publics ou privés.
A Deep Learning Approach for Hand Posture
Recognition from Depth Data
Thomas Kopinski, Fabian Sachara, Alexander Gepperth, Uwe Handmann
To cite this version:
Thomas Kopinski, Fabian Sachara, Alexander Gepperth, Uwe Handmann. A Deep Learning
Ap-proach for Hand Posture Recognition from Depth Data. International Conference on Artificial Neural
Networks (ICANN), 2016, Barcelona, Spain. pp.179 - 186, �10.1007/978-3-319-44781-0_22�.
�hal-01418137�
Recognition From Depth Data
Thomas Kopinski, Fabian Sachara, Alexander Gepperth, and Uwe Handmann
Hochschule Ruhr West, Computer Science Institute, L¨utzowstrasse 5, 46236 Bottrop, Germany
UIIS Lab and FLOWERS team, INRIA, Universit´e Paris-Saclay, 858 Blvd des Mar´echaux, 91762 Palaiseau, France {thomas.kopinski,fabian.sachara,uwe.handmann}@hs-rw.de
{alexander.gepperth}@ensta-paristech.fr
Abstract. Given the success of convolutional neural networks (CNNs) during recent years in numerous object recognition tasks, it seems logical to further extend their applicability to the treatment of three-dimensional data such as point clouds provided by depth sensors. To this end, we present an approach exploiting the CNN’s ability of automated feature generation and combine it with a novel 3D feature computation tech-nique, preserving local information contained in the data. Experiments are conducted on a large data set of 600.000 samples of hand postures obtained via ToF (time-of-flight) sensors from 20 different persons, af-ter an extensive parameaf-ter search in order to optimize network structure. Generalization performance, measured by a leave-one-person-out scheme, exceeds that of any other method presented for this specific task, bring-ing the error for some persons down to 1.5%.
Keywords: deep learning, hand posture recognition, 3D data
1
Introduction, context and related work
Making freehand gestures an efficient means of Human-Computer Interaction (HMI) is an important and simultaneously complex task, as the steadily in-creasing number of research studies demonstrates over the course of the last decade. The number of potential applications is growing due to the advent of low-cost off-the-shelf depth sensors. However, due to various reasons such as ac-tive illumination interference or noise in the process of data acquisition, robust learning methods are still an important requirement. The main advantages of ToF sensors are their high frame rate and robustness w.r.t. illumination condi-tions, hence their fields of application covers outdoor scenarios as well. However, recognizing hand gestures solely from 3D data is a non-trivial task which raises the question whether CNNs, which excel in object recognition tasks from RGB data, can perform just as well for this task.
When positioning this contribution in the broader field of object recognition from 3D data with CNNs, occupancy grids have been successfully applied, e.g.
2 Thomas Kopinski, Fabian Sachara, Alexander Gepperth, Uwe Handmann
in the field of mobile robotics, in order to create maps from potentially highly noisy data samples [1]. The basic idea is to have a representation of an evenly divided environment with the possibility of telling whether there is an object at a certain location. Maturana et al. [2] make use of this algorithm in order to create various kinds of occupancy grids, serving as input for their 3D-CNN implementation by either taking into account the amount of free space within the grid or not. 3D input is presented by Wu et al. [3] to a 3D-CNN in the form of a stacked 3D cube consisting of multiple frames acquired over time, which is convolved with a 3D kernel and applied to the problem of hand gesture recogni-tion.
In this contribution, we demonstrate how a data transformation step allows for fast and robust hand gesture recognition from depth data by CNNs. As these are primarily intended to process 2D data (e.g. images), their application to 3D data is is not straightforward at all: either one needs to create a feature com-putation method that transforms 3D data into 1d or 2D feature vectors, or the convolution structure of the network itself needs to be modified to handle 3D data directly (e.g., by 3D convolutions). Both approaches being feasible, we opt for the first possibility since 3D convolutions are very inefficient operations and real-time capability is important for our targeted HMI scneario. Given a complex hand gesture recognition problem of 10 different gestures obtained from a large number of individuals, we propose a particular feature transform of depth data to make them treatable by CNNs. The following sections give a description of our approach as well as the resulting network structure (Section 2). Experiments are conducted in two phases (cf. Section 3), determining the optimal parame-ter setting in an initial step and evaluating the optimal CNN’s performance in a second step. Section 4 concludes with a summary and an outlook on future work.
2
Network Architecture and Training
In order to be able to deal with three-dimensional input, this contribution presents an approach which transforms the raw 3D data into a format read-able by CNNs. The need for a fixed-size input requires a specific partitioning of the 3D input. Given an input of 3D data points (voxels) of arbitrary extension across all possible dimensions (also referred to as point cloud), we propose the subdivision of the entire cloud into cubes of fixed size. To this end, the maximal extension of the data points has to be calculated for the entire problem. This approach is explained in the following sections.
2.1 3D subdivision of point cloud input
In order to be able to work on 3D input data we employ a modified LeNet 5 implementation of the Theano library [4] with two convolutional layers. The input space is subdivided into n3hypercubes of fixed size. Each hypercube then contains a subset of data points from the original object. Depending on the
density of the cloud, a certain number of cubes remains empty. In order to avoid too many empty hypercubes, which form the input for the CNN, we stretch the data to fit into the raster. To this end, the input cloud is normalized to the range (0,1) on each axis. This guarantees the data to be evenly distributed over all hypercubes. The value contained within a hypercube is determined by the number of data points it contains.
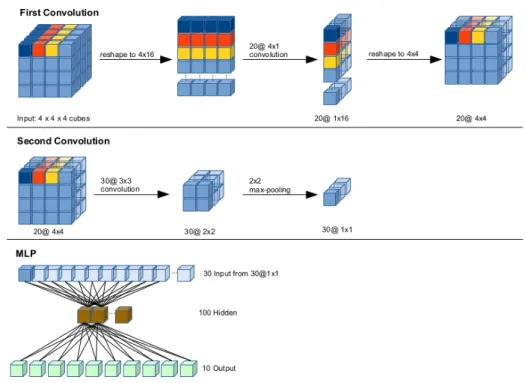
Each slice of the input vector, which will be described here on basis of an 8×8×8 sized example, has to be reshaped to fit a designated pattern: The vector is reshaped in a way that each row fed into the convolutional layer represents one (x-y) slice of depth data in the original, resulting in an input matrix of 8 × 64 (cf. Figure 1 showing this for the case of 43). This way, a convolutional kernel of
size 8 × 1 can be used to initially convolve the depth-axis, resulting in an 1 × 64 output of the first kernel. No max-pooling is used in this layer. The second layer reshapes this 1 × 64 output to 8 × 8, so that a 3 × 3 kernel can subsequently be utilized. This layer also implements 2 × 2 max-pooling, resulting in an output of 3 × 3. This output is then fed into the multilayer perceptron (MLP) layer of the convolutional net, which determines the output class.
Fig. 1. Setup of the CNN structure with two convolutional layers. Top row: First convolution step and reshaping. Center: Second convolution step and max-pooling. Bottom: MLP structure and input.
4 Thomas Kopinski, Fabian Sachara, Alexander Gepperth, Uwe Handmann
2.2 Training setup
Training is performed on a single GeForce GTX 780 Ti graphics card. The main limit here is the device’s memory capacity as our training/testing data set ex-ceeds it’s memory capability.
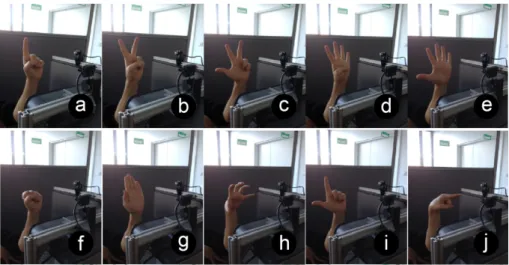
Fig. 2. The ten different hand postures from the REHAP data set.
Fig. 3. The resulting kernels from the first filter grouped together for each posture from the REHAP data set (compare with Figure 2). The first layer of the CNN produces 20 different kernels. All 20 kernels produced per gesture are grouped and presented in analogous order from left to right, top to bottom.
We evaluate our approach on the REHAP [5] data set consisting of 600.000 data samples obtained from 20 different persons, each posing for 10 different hand gestures (cf. Figure 2). Each of the gestures is represented by 3.000 snap-shots summing up to 30.000 data samples per person. This would result in the
transformation and storage of 570.000 data samples by the Theano lib during training for 19-on-1 cross-validation, including weights as well as the subsequent image transformation steps, which is more than the device can store during the training phase. The amount of data samples during training is therefore reduced to about 2.000 samples per gesture, each randomly taken from the whole sample set. This still yields significant total sample set of 380.000 hand poses for train-ing the net - more than enough to validate our approach.
Two different experiment runs are performed: An initial parameter search is started in order to determine the optimal setup for the CNN architecture. To this end, the whole data set is subsampled by randomly retrieving 100 data samples per person and pose, yielding 1000 samples per person for 10 randomly selected individuals. The number of test runs therefore amounts to:
n X i=0 ki1 m X j=0 k2j o X s=0 k1s o X s=0 k2s p X l=0 k2mp
Here, k1i and k2j denote the number of kernels within their respective layers. k1
s denotes a specific combination for the first layer, since we first transform the
input as described in Section 2.1 (cf. Figure 1). If k1
s= 0 this conforms to an 8×1
kernel with no max-pooling. If k1
s= 1 this corresponds to a 7×1 kernel with 2×1
max-pooling etc. k2
s defines the size of the second kernel while k mp
2 consequently
corresponds to the kernel size in the max-pooling layer. The resulting kernels from the first convolution layer are depicted in Figure 3.
3
Experiments and Results
The experiments are subdivided into two phases: In the first phase, the optimal parameters are determined by an extensive grid-search. This is followed by the second phase, namely the training and subsequent leave-one-out cross-validation test of the CNN on the REHAP dataset of 20 different persons.
3.1 Parameter Grid-Search
From the whole data set, 70% of the data samples are randomly subsampled for training and the remaining 30% are retained for validation during each itera-tion. Each data sample is transformed by the scheme described in the preceding section and subsequently presented to the CNN for training. In order to find the optimal parameters for the approach described in this paper, an extensive examination of the CNN’s peak performance was conducted. To this end, the parameter choice was set as follows:
6 Thomas Kopinski, Fabian Sachara, Alexander Gepperth, Uwe Handmann ki1∈ {5, 10, 15, 20} k2j ∈ {5, 10, 15, 20, 25, 30, 35, 40, 45, 50} k1s∈ [0, 7] k2s∈ [0, 7] k2mp∈ [1, 8]
This sums up to a total of 20.480 experiments, however as in some cases max-pooling is not possible to be conducted if the result of the preceding con-volution step is unsuitable, several steps have to be ignored. For instance, if the convolution of the preceding layer of 8 × 8 with a 3 × 3 kernel results in a 6 × 6 layer, max-pooling can only be performed with either a 6 × 6, 3 × 3, 2 × 2 or 1 × 1 kernel. Therefore, ignoring those invalid cases this results in ca. 5400 ex-periments conducted (training time was approx. 1 week).
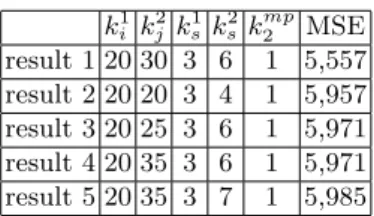
ki1k 2 j k 1 s ks2k2mpMSE result 1 20 30 3 6 1 5,557 result 2 20 20 3 4 1 5,957 result 3 20 25 3 6 1 5,971 result 4 20 35 3 6 1 5,971 result 5 20 35 3 7 1 5,985
Table 1. The top 5 results taken from all 5400 iterations of our parameter grid-search. The mean squared error averaged over all samples in the validation set drops to 5,5%.
The most significant insight of these experiments is the correlation of in-crease or dein-crease of the measured mean-squared error (MSE) values depending on the number of chosen kernels, the kernel size or kernel size for max-pooling. Unsurprisingly, MSE error drops if the number of kernels per layer is increased. However, increasing the k1
s parameter leads to an increase in MSE error. This
consequently means that we achieve optimal results for small values of k1 s, with
a small max-pooling value of kmp2 = 1 or kmp2 = 2. Best MSE scores achieved in this grid-search are 5.6% averaged across all samples in the testing set with the aforementioned parameters (cf. Table 1). Moreover, to achieve best results, the number of kernels usually should be chosen around 20 for the first convo-lution layer and around 25-35 for the second layer. Setting the parameters to the optimal values, a generalization test is conducted which is described in the subsequent section.
3.2 Leave-one-out Cross-validation
Choosing the best parameter setup from the grid-search in the preceding section yields improved results compared to approaches on the same data set achieved so far. With respect to the parameters presented in Table 1, we set k1
i = 20, k2j = 30,
k1
s= 3, ks2= 6, k mp
2 = 1. The results of our leave-one-out generalization tests are
presented in Table 2. For each column n the entry shows the MSE score retrieved on testing the CNN architecture on all data samples coming from person n and trained on all data samples except those from person n.
p1 p2 p3 p4 p5 p6 p7 p8 p9 p10 p11 p12 p13 p14 p15 p16 p17 p18 p19 p20 22,3 51,3 22,1 32,5 11,6 17,4 40,0 27,1 13,6 15,3 13,2 12,4 1,3 4,0 5,5 15,1 4,2 17,5 30,7 21,4 Table 2. The top row indicates the validation run performed for all samples from person n in the data set. The rounded MSE scores (in %)for the respective person are indicated in the bottom row per table entry. Training is performed on all persons but the one indicated in respective column while testing is the performed on the person indicated by the same column.
Hence this table shows the performance of the CNN on hand gestures per-formed by persons previously unknown to the net. Testing is perper-formed on all samples present for this person averaged over all gestures. Best results are ob-tained on persons 13,14 and 17 with error scores of 1,7%, 4,0% and 4,2% respec-tively. These are strong results given the aforementioned fact we are dealing with unseen data. Moreover, MSE errors are below the 20% mark for 12 persons and only increases significantly for 4 individuals, namely persons 2,4,7 and 19 with worst results achieved on person 2. This is highly respectably for a large and complex subsampled data set of 400.000 hand postures obtained from a highly noisy sensor.
4
Conclusion and Outlook
In this contribution a novel approach to training CNNs for the problem of hand gesture recognition from depth data is presented. Depth input from ToF sensors in normalized, stretched and subdivided into hypercubes and subsequently con-volved in a specifically tailored intermediate step as to be presentable to a CNN. An extensive parameter search is performed to yield the optimal setup for our net architecture. Around 5400 test runs conducted during this search over the course of one week show that the CNN peaks in performance for a large num-ber of kernels in the initial layers and small max-pooling kernels. Given these settings a leave-one-out cross-validation run is performed over the course of ap-prox. 14h demonstrating strong recognition results on previously unseen data. The main benefit of this contribution lies in its simple yet necessary subdivision and transformation of input data. Given the fact that we outperform previously
8 Thomas Kopinski, Fabian Sachara, Alexander Gepperth, Uwe Handmann
achieved results on this largescale data set, approximating error rates of 1,5% -4% for some persons and averaging around 15%-20% over all persons, this proves the validity of this approach. Future work will focus on the transferability of this approach onto problems of object recognition in the three-dimensional domain, in order to prove its general applicability. We strongly believe it can easily be ex-tended to other, similar tasks allowing for improved performance of CNNs under difficult circumstances. Moreover, we will further elaborate on faster parameter optimization techniques as well as improved data transformation steps.
References
1. Thrun, S. (2003). Learning occupancy grid maps with forward sensor models. Au-tonomous robots, 15(2), 111-127. ISO 690
2. Maturana, D., and Scherer, S. (2015, September). VoxNet: A 3D convolutional neural network for real-time object recognition. In Intelligent Robots and Systems (IROS), 2015 IEEE/RSJ International Conference on (pp. 922-928). IEEE. 3. Wu, D., and Shao, L. (2014, September). Deep dynamic neural networks for gesture
segmentation and recognition. In Computer Vision-ECCV 2014 Workshops (pp. 552-571). Springer International Publishing.
4. Bastien, F., Lamblin, P., Pascanu, R., Bergstra, J., Goodfellow, I., Bergeron, A., ... and Bengio, Y. (2012). Theano: new features and speed improvements. arXiv preprint arXiv:1211.5590.
5. REHAP, Large-scale data set for Recognition of Hand Postures, http://www.gepperth.net/alexander/postures.php