HAL Id: hal-00776470
https://hal-mines-paristech.archives-ouvertes.fr/hal-00776470
Submitted on 15 Jan 2013
HAL is a multi-disciplinary open access archive for the deposit and dissemination of sci-entific research documents, whether they are pub-lished or not. The documents may come from teaching and research institutions in France or abroad, or from public or private research centers.
L’archive ouverte pluridisciplinaire HAL, est destinée au dépôt et à la diffusion de documents scientifiques de niveau recherche, publiés ou non, émanant des établissements d’enseignement et de recherche français ou étrangers, des laboratoires publics ou privés.
A framework for modeling the consequences of the
propagation of automation degradation: application to
air traffic control systems
Eric Rigaud, Erik Hollnagel, Célia Martinie, Philippe Palanque, Alberto
Pasquini, Martina Ragosta, Sara Silvagni, Mark-Alexander Sujan
To cite this version:
Eric Rigaud, Erik Hollnagel, Célia Martinie, Philippe Palanque, Alberto Pasquini, et al.. A framework for modeling the consequences of the propagation of automation degradation: application to air traffic control systems. The Second SESAR Innovation Days, Nov 2012, Braunschweig, Germany. 8 p. -ISBN 978-2-87497-068-9. �hal-00776470�
propagation of automation degradation: application to
air traffic control systems
E. Rigaud3, E. Hollnagel3, C. Martinie1, P. Palanque1, A. Pasquini2, M. Ragosta1-2, S. Silvagni2, M. Sujan4 1
University Paul Sabatier, ICS-IRIT 118, route de Narbonne 31062 Toulouse Cedex 9 {martinie, palanque, ragosta}@irit.fr 2 DeepBlue Srl Piazza Buenos Aires 20,
00198 Roma - Italy {alberto.pasquini, martina.ragosta, sara.silvagni}@dblue.it 3 Mines-Paristech / ARMINES, CRC Rue Claude Daunesse,
B.P. 207 06904 Sophia Antipolis {erik.hollnagel, eric.rigaud}@mines-paristech.fr 4
Warwick Medical School University of Warwick
Coventry CV4 7AL UK
m-a.sujan@warwick.ac.uk
Foreword—This paper describes a project that is part of SESAR
Work Package E, which is addressing long-term and innovative research.
Abstract— This paper presents a modelling approach for
representing consequences of automation degradation in the context of a socio-technical network. This modelling approach involves two different notations: FRAM [8] and HAMSTERS [9]. In previous work [6] we have proposed a synergistic approach integrating these two views for describing the evolution of system performances under automation degradation. In the current paper we propose a more global approach encompassing the previous contribution and being specifically addressing the representation of consequences flowing from the occurrence of automation degradation. In this approach, four modelling levels of consequences are studied: direct consequences of automation propagation, consequences on the capacity to respond, consequences on resilience capacity and consequences on network performance. This stepwise refinement aims at acquiring and modelling additional information needed for being able to assess the consequences of automation degradation. The approach is exemplified on a case study in the domain of Air Traffic Management and more precisely Terminal Manoeuvre Area including an Arrival Manager (AMAN). Due to space constraints only the first level is fully presented.
Keywords-Automation degradation propagation, capacity to respond, resilience, network performance, ATC, AMAN
I. INTRODUCTION
The aim of this paper is to describe a first prototype of a modelling framework allowing the definition of various consequences of automation degradation propagation in a complex socio-technical network.
Objective of the modelling framework is to extend classical risk assessment modelling methods with the integration of four dimensions: human adaptation capacity, unwanted situations
respond capacity, resilience capacity and network. Results of the framework aims to be used during automation development phases or during deployment phases.
Paper is structured in three parts. The first part discusses automation degradation propagation in complex networks. The second part presents the modelling framework. The last part describes first result of the application of the first phases of the framework to the modelling of the Arrival Manager (AMAN) system.
II. AUTOMATION DEGRADATION PROPAGATION IN COMPLEX NETWORKS
The objective of the study is to define and develop a method aiming to support the design of a model of automation propagation in a network-based system. The purpose of this model is to support the identification of a set of consequences due to the occurrence of a failure mode of a specific automation on various conditions.
The modelling context is based on a network-based approach. A network is defined as a set of nodes interconnected by flows[1].
Different types of flows are considered. Flow can be physical, informational, logical, etc. In the context of ATC the main flow is aircrafts. Other flows are information exchange between nodes and aircraft responsibility transfer from one supervision entity to another.
Two types of nodes are considered. The first type is
container nodes which contain the entities that constitute the
flows of the network. In the context of ATC, airports and sectors can be considered as container nodes for flight flows. The second type of nodes is defined as supervision nodes. They are associated to one or several container nodes, and control the
flows and react to unwanted situations before they affect the performance of the system. In the context of ATC, Tower (TWR), Terminal Manoeuvre Area (TMA) and ACC sectors can be considered as supervision nodes.
Container nodes are characterized by a capacity of flow entities they can contain and some actions that can be performed: entering, exiting, moving, etc.
Supervision nodes are characterized by a set of responsibilities and a set of resources to perform them. Responsibilities are related to a set of obligations to respond to a set of situations arising with different frequency and to potential sources of perturbations. In the context of ATC, ACC nodes for example have to respond to events such as the distance between two flights below the minimum; a flight being delayed related to its schedule or a flight being short of fuel. Resources dedicated responses to the different types of situations can be operators such as Executive and Planner, and they can be automation such as radar, AMAN, etc.
The purpose of the modelling method is to represent the consequences of the failure of an automated system, how they propagate in the ATC system, and the different types of consequences on the nodes and the flows in the wider system.
Model is structured with four modelling levels aiming to model different dimensions of Large Scale Socio - Technical systems and associated consequences of automation degradation (cf. figure 1.).
Figure 1. Automation degradation consequences analysis modelling level.
The first modelling level is related to automation degradation impacts on operator’s performances. Level 1 consequences are the variability of actions performed by operators with the support of automation and the variability of operators human factors.
The second modelling level is related to operator’s capacity of respond to unwanted situations under their responsibilities. Level 2 consequences are impacts of level 1consequences variability on operators respond actions, on the consequences of the evolution of the unwanted situation and on operator’s human factors.
The third modelling level is related to node resilience capacity, that is to say the capacity of respond to regular,
irregular and without precedent unwanted situations under their responsibilities. Level 3 consequences are impacts of level 2 consequences variability on operators respond actions, on the consequences of the evolution of the unwanted situations and on operators human factors.
The fourth modelling level is related to network node resilience capacity. Level 4 consequences are impacts of level 3 consequences variability on resilience performance of network nodes interconnected with the node studied.
In order to structure automation degradation propagation consequences model, a generic propagation model is defined.
The generic propagation model aims to structure the representation of event susceptible to impacts the performance of systems and the propagation of their consequences. The model is constituted of a generic pattern structured with five concepts:
Initial Event. Initial event is the initiator of the propagation model. It can be automation degradation, human factors variability, clearance reception, etc. Targets. Targets are elements that are affected by the
variability of initial event. It can be human performance, unit performance, flight performance, etc.
Consequences. Consequences are impacts of initial event on targets. It's generally related to the increase or decrease of target properties (stress, fatigue, precision, delay etc.).
Environment. Environment is related to a set of dimensions others than initial event and targets that can affect the nature and the intensity of consequences. This generic model is applied to the four modelling levels in order to produce a generic automation degradation propagation model. This model will be the basement of the definition of SPAD modelling methodology. Next sections are dedicated to the presentation of this model.
A. Propagation of automation deradation on operators performances
The first level aims modelling automation degradation modes and their consequences on operator’s behaviour.
In this level, initial events are related to automation degradation modes. It can be partial or total realisation of function usually performed by automation [2] (information acquisition, information analysis, decision and action selection, action implementation, etc.). Targets are related to operator’s behaviours, which directly interact with automation in order achieving tasks. Behaviours can be defines with a set of adaptive modes related to operator’s reaction to the variability of his context of action. Environment dimensions are related to factors that can affect operator’s performances. It can be human related factors (stress, focus of attention, umber of task to be performed, etc.) or be related to context of action (work
Level 3. Node Resilience capacity Level 2. Respond capacity Level 1. Human - Automation interactions Level 4. Network nodes resilience capacity
Universe of possible consequences
conditions, presence of available time, crew collaboration quality, etc.) Consequences are related to the variability of the performance of the functions to be realised by operators with the support of automation such as precision of the results, delay to obtain the results and to operator’s human factors (stress, workload, etc.). Following table present a summary of the model (cf. TABLE I. ).
TABLE I. ADAPTATION OF PROPAGATION MODEL TO LEVEL 1
MODELLING LEVEL
Automation modelling level propagation model Initial event Automation degradation mode
Targets Operators behaviour
Environment Endogenous and exogenous factors that influence operators behaviours
Consequences Precision and duration of the execution of both automation and operators functions
Operators human factors
B. Propagation of level 1 consequences on capacity to respond
The second level aims modelling automation degradation level 1 consequences impact on associated respond capacity performance.
The capacity to respond can be decomposed into five processes [3]:
Detect that something has happened, Identify the event,
Recognize that the situation requires a response, Define the response,
Mobilize resources in order to respond.
The ability to respond can be influenced by several factors. Four factors can be considered related to the balance between elements required by the nature and the state of the event to be controlled and elements available:
Time available versus time required.
Resources available versus resources required. Competences available versus competences required. Information available versus information required. The balance between elements required and elements available has an influence on different dimensions such as duration or precision of the response or the operator’s capacities. The consequences of variability of those dimensions influence the life cycle of events to be controlled and associated consequences. If the correct response is not performed events may trigger unwanted consequences, and require other elements to be controlled.
In this level, initial events are related to Level 1 consequences. Targets are related to respond capacity performance variability factors. It can be time, resources, competences or information. Environment dimensions are
related to factors that can affect operator’s performances and situations to be responded consequences. Consequences are related to the variability of the performance of respond functions, to the variability of consequences of the situation to be controlled and the variability of operator’s human factors. Following table present a summary of the model (cf. TABLE II. ).
TABLE II. ADAPTATION OF PROPAGATION MODEL TO LEVEL 2
MODELLING LEVEL
Respond level propagation model
Initial event Precision and duration of the execution of both automation and operators functions
Operators human factors
Targets Respond capacity performance variability factors
Environment Endogenous and exogenous factors influencing
operators and situation to be respond variability. Area of responsibility of operators
Consequences Respond action consequences Situation to be respond consequences Operators human factors
C. Propagation of level 2 consequences on node resilience performance
The third level aims modelling automation degradation level 2 consequences impact on node resilience performance.
Node resilience performance can be define as the intrinsic ability “to adjust its functioning prior to, during, or following changes and disturbances, so that it can sustain required operations under both expected and unexpected conditions”[3].
Four major capabilities determine node resilience performance: ability to respond to both expected and unexpected events; ability to learn for unexpected situations to understand what can go wrong and for expected situation to understand what makes the system go right; ability to monitor the performance of the system in considering both lagging and leading indicators; ability to anticipate threats and opportunities that can be consequence of changes occurring in the system and it’s environment [3].
In order to characterize node resilience, the focus is on the capacity to respond. The node resilience model is structured in three complementary respond capacities related to the different types of situation that can occur [4]:
Capacity to respond to normal events. Normal events are situations related to the normal functioning of the system. Respond functions are based on the application of procedures, on behaviours learned during training sessions and on resources that are regularly checked. Capacity to respond to regular unexpected events.
Regular unexpected events are unwanted situations that have been anticipated by risk management systems, and for which prevention and protection barriers have been deployed. Respond functions are based on the application of procedures, on behaviours learned during training sessions and on resources that are regularly checked.
Capacity to respond to irregular unexpected events. Irregular unexpected events are unwanted situations that are known by the system, but where no adequate barriers exist to prevent and protect the system against them. Respond functions are based on the ability of operators to adjust their behaviour according to the requirements of the situation, their knowledge and available resources.
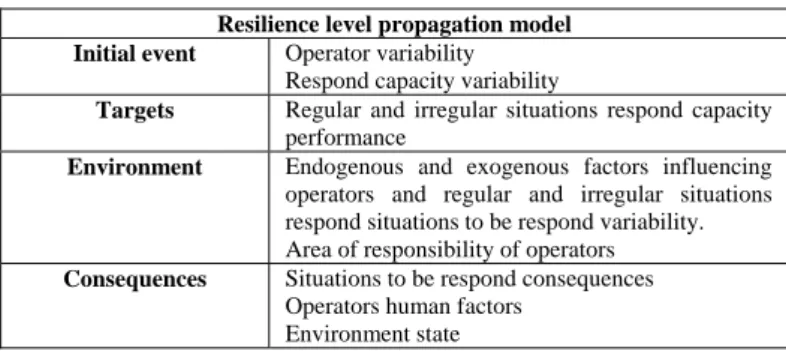
Level 3 is related to the study of impact of respond function that use studied automation variability on respond capacities to other situation that have to be controlled by the node. Initial events are related to Level 2 consequences. Targets are related to the other nodes respond capacities performance variability factors. Environment dimensions are related to factors that can affect operator’s performances and situations to be responded consequences. Consequences are related to the variability of the performance of all the respond functions, to the variability of consequences of all situations to be controlled and the variability of operator’s human factors. Following table present a summary of the model (cf. TABLE III. ).
TABLE III. ADAPTATION OF PROPAGATION MODEL TO LEVEL 3
MODELLING LEVEL
Resilience level propagation model Initial event Operator variability
Respond capacity variability
Targets Regular and irregular situations respond capacity performance
Environment Endogenous and exogenous factors influencing
operators and regular and irregular situations respond situations to be respond variability. Area of responsibility of operators
Consequences Situations to be respond consequences Operators human factors
Environment state
D. Propagation of level 3 consequences on nodes resilience performance
The fourth level aims modelling automation degradation level 3 consequences impact on resilience performance of nodes interconnected with the node studied.
The propagation of consequences depends on the nature of the interactions between the different nodes. Related to the modelling context, three types of relations can be considered:
Supervision node – Container node
interdependencies. This relation is related to the
impact of supervision node variability on the associated container node.
Supervision node – Supervision node
interdependencies. This relation is related to the
impact of supervision node variability on the supervision node directly or indirectly connected to it. Container node – Container node
interdependencies. This relation is related to the
impact of container node variability on the container nodes directly or indirectly connected to it.
Node interdependencies can be defined, among others, along several dimensions [5]:
Infrastructure characteristics: spatial, temporal, operational and/or organizational.
Type of interdependencies: physical, cyber, logical, geographic.
Coupling and response behaviour: loose/tight, linear/complex, adaptive, and inflexible.
Initial events are related to Level 3 consequences. Targets are related to the resilience performance of all the nodes interconnected with the studied node. Environment dimensions are related to factors that can affect nodes resilience performance. Consequences are related to the variability of the resilience performance of concerned node, to the variability of consequences of all situations to be controlled and the variability of container nodes (cf. TABLE IV. TABLE III. ).
TABLE IV. ADAPTATION OF PROPAGATION MODEL TO LEVEL 4
MODELLING LEVEL
LSSTS level propagation model
Initial event Node resilience performance variability
Targets Interconnected nodes resilience performance
Environment Environment variability Nodes responsibilities area zone
Consequences Node resilience performance Situations to be respond consequences Container node variability
Those four levels will be the basis of the definition of a modelling framework.
III. MODELING FRAMEWORK
Model presented in the previous section aims to be the basement of the definition of a modelling method allowing automation degradation consequences analysis. This objective requiresan interdisciplinary approach. The approach followed is based on the idea of federation of models. Different models related to specific dimensions of each level of analysis are interconnected by the means of a generic method.
This section aims to describe the modelling framework developed (see Figure 2). This development is based on the Functional Resonance Analysis Method (FRAM) framework [6][7][8]. FRAM is a functional-based modelling approach that aims to represent the dynamics of systems taking into account different dimensions of endogenous, exogenous and functional interdependences that may influence the performance of functions.
The method is structured with three generic phases: Context definition. The first phase consists in defining
the different elements that structure the context of the model: initial events, impacts, environment and consequences.
Functions definition. The second phase consists in describing functions that constitute the model. For each 4
function, global variables (environment and system properties), aspects (Input, Output, Control, Resources, Time and preconditions) and performance modes are described.
Propagation model definition. The third phase is related to the definition of the coupling relations between functions allowing the definition of the propagation mechanisms.
Figure 2. A process for modelling automation degradation propagation consequences
Following sections are related to the description of the adaptation of those three steps to the four modelling levels considered. Method phases are illustrated with information related to the study of AMAN. Arrival Manager (AMAN) is a ground based planning tool suggesting to the air traffic controller an arrival sequence of aircraft and providing support in establishing the optimal aircraft approach routes.
A. Modeling the direct consequences of automation degradation
The first level aims to support the modelling of the direct consequences of automation degradation on operator’s performances.
1) Context definition
The first phase of the method aims defining the modelling context. Level 1 context is related to information about automation, operators and the environment.
Automation is described with its name, functions performed, level of automation and functioning modes including degradation modes. Operator is described with a title, functions performed with the support of studied automation, endogenous variability factors and adaptive modes. Environment is described with a set of dimensions characterized with a label and a scale of variability.
The following table illustrated this context in the case of study of AMAN.
TABLE V. LEVEL 1 CONTEXT DEFINITION OF AMAN CASE STUDY
Level 1 context definition
Automation AMAN automation is decision and action selection type automation. It acquires information about traffic, infers the ideal arrival sequence and generates advisories if the gap between flight ideal and actual position is superior to accepted margin.
AMAN functioning modes considerated are :
- AMAN normal functioning. AMAN compute and display right information in a reasonable delay.
- AMAN malfunction. AMAN stops working.
- AMAN provides misleading information. AMAN display wrong information.
AMAN is semi-autonomous, two operators interact with it, Sequence Managers who supervise sequence list and eventually correct it and Executive who send clearances to flight according to information provided by AMAN.
Operators Executive operators aims managing the flow of traffic in their sectors with respect of sequence list.
Sequence Manager aims managing sequence list. Endogeneous dimensions of varibaility considered are training, workload, stress, focus of attention, number of tasks ans habit to AMAN.
Adaptive modes considered are: optimum; average and degraded.
Environment Working conditions Complexity of traffic Amount of traffic
Context will be use to define FRAM functions and coupling relationships.
2) Function definition
The second phase of the modelling method is related to the definition of FRAM based functions that constitute the model. The structure of the model depends on the level of automation of the system studied.
If the level of automation is autonomous, the model will be constituted of only one set of functions related to the automation functions. If the level is semi-autonomous, the model will be constituted of both automation and operator functions.
Definition of the function is realised by defining FRAM aspects (input, output, precondition, resources, time and control) for each function performed by automation and operators.
In the context of AMAN study, two functions are considerate: "Compute and display Sequence List" and "Compute and Display advisories". Two human functions are considerate. First is a function of the sequence manager: "Control adequacy between sequence list and current situation ". Second is a function of the executive: "Control adequacy between flight’s planned trajectory and flight actual trajectory". The following table presents information related to a function that has to be defined. Elements are illustrated with one of AMAN case study function.
TABLE VI. FRAM DESCRIPTION OF "CONTROL ADEQUACY BETWEEN FLIGHT PLANNED TRAJECTORY AND FLIGHT ACTUAL TRAJECTORY "
Control adequacy between flight planned trajectory and flight actual trajectory
Description
Executive monitor AMAN in order to identify if needed manoeuvre to be cleared to pilot
Aspects
Input(s) AMAN Advisories displayed
Output(s) Difference identified
Maneuver to be cleared defined
Precondition Traffic in an advanced state
Resource(s) AMAN, CWP, EXC_TMA
Control(s) Procedures
Time
Same work as to be achieved to both automation and operators relevant functions.
3) Propagation model definiton
The third phase consist in defining propagation model by linking each function and characterizing their variability model. A relation between automation degradation modes, operators’ variability (if the level of automation is semi-autonomous), environment variability and variability of the outputs of the functions is defined.
Automation functions variability model is related to the relation between degradation modes and automation functions outputs. Automation functions state model is related to the different degradation modes identified. For each degradation
modes, a value is associated to the different output of the functions. Following table describes this relation for one of AMAN functions.
TABLE VII. FRAM BASED VARIABILITY MODEL OF AMAN FUNCTIONS
AMAN functions variability model
Functioning modes Output values
Normal functioning
Information availlability (YES) Information precision (RIGHT) Information computing delay (Optimum)
Malfunctioning
Information availlability (NO) Information precision (-) Information computing delay (-) Misleading information
Information availlability (YES) Information precision (FALSE) Information computing delay (Optimum)
Operator’s functions variability model is related to the relation between performance context, adaptive mode and functions outputs.
Depending of the values of the different dimension of variability related to the operator, the environment and the coupling relation in particular coupling with automation functions an adaptive mode is selected. Following tables describes this relation for AMAN operator’s functions. First one is related to the list of dimension of variability taken in account.
TABLE VIII. FRAM BASED DIMENSION OF VARIABILITY LIST OF AMAN OPERATOR’S FUNCTIONS
Dimension of variability Endogenous dimension of variability
Habit to AMAN [High (10), Medium(5), Low] Training [High (10), Medium(5), Low] Workload [High (10), Medium(5), Low] Stress [High (10), Medium(5), Low] Focus of attention [High (10), Medium(5), Low] Number of tasks [High (10), Medium(5), Low]
Exogenous dimension of variability
Working conditions [High (10), Medium(5), Low] Complexity of traffic [High (10), Medium(5), Low] Amount of traffic [High (10), Medium(5), Low]
Coupling dimension of variability
AMAN Information Availlability [Yes, No] AMAN Information
precision [Right, False]
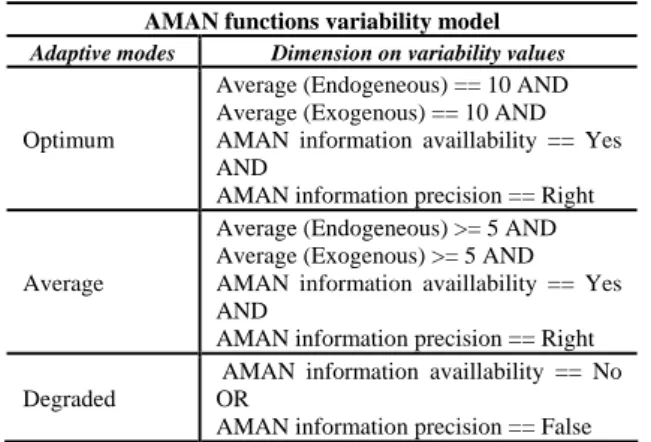
The second table is related to the relation between dimensions of variability average value and operator adaptation mode.
TABLE IX. FRAM BASED RELATION BETWEEN DIMENSION OF VARIABILITY VALUES AND ADAPTIVE MODES OF AMAN OPERATOR’S FUNCTION
AMAN functions variability model Adaptive modes Dimension on variability values
Optimum
Average (Endogeneous) == 10 AND Average (Exogenous) == 10 AND AMAN information availlability == Yes AND
AMAN information precision == Right Average
Average (Endogeneous) >= 5 AND Average (Exogenous) >= 5 AND AMAN information availlability == Yes AND
AMAN information precision == Right Degraded
AMAN information availlability == No OR
AMAN information precision == False
The third table is related to the relation between adaptive modes with values of function outputs.
TABLE X. FRAM BASED RELATION BETWEEN DIMENSION OF VARIABILITY VALUES AND ADAPTIVE MODES OF AMAN OPERATOR’S FUNCTION
AMAN functions variability model
Adaptive modes Output values
Optimum Precision (Optimum) Delay (Optimum) Average Precision (Average) Delay (Average) Degraded Precision (False) Delay (Late)
With the application of the relationships described with those three tables, automation degradation modes and environment are linked to operator’s behaviors.
This model will be the basement of the level 2 modelling activities.
B. Modeling Automation degradation consequences on the capacity to respond
The second level aims to support modelling of the propagation of the variability of level 1 model to the capacity of respond using the automation studied.
1) Step 1. Description of the capacity to respond context
The first phase is related to the definition of the capacity to respond context. This context is related to unwanted situation to be responded and respond capacity associated.
Unwanted situation to be responded is described with its name, a set of states related to its evolution, and for each states a performance profile (time required, resources required, competences required and knowledge required) required to keep the control of the situation.
Respond capacity is described with its name, description of the different functions (detect, identify, recognize, define respond and respond) and a set of respond modes related to the balance between performance profile required and performance profile available.
2) Step 2. Level 2 function definition.
Based on the context description, the level 1 functional model is extended to consider the respond capacity processes
and functions related to the events associated with the respond function.
A set of function is associated to the capacity of respond and coupled with Level 1 model. Two situations can occur. The first one, automation studied support partially or totally the respond capacity. The second one, automation studied is related to the situation to be responded. In the first case, respond function is split in order to consider level 1 functions. In the second case, one function related to the capacity of respond is considered and linked to the Level 1 model.
3) Step 3 Propagation model definiton.
Propagation model definition is realized with defining relationships between dimensions of variability (endogenous, exogenous and coupling) of respond function and four respond modes:
Strategic. Situations where the system as a time horizon and can look ahead at higher-level goals. Tactical. Situations where performance more or less
follows a known procedure or a rule.
Opportunistic. Situations where the salient features of the current context determine the next action
Scrambled. Situations where the choice of next action is basically random
This relation is defining by considering relations between available and required dimensions: resources, time, information and competences. The following rules are used to define the relationships:
In strategic control mode, dimensions required to perform functions is much superior to available dimensions
In tactical control mode, dimensions required to perform functions is just superior to available dimensions
In opportunistic control mode, dimensions required to perform functions is inferior to available dimensions In scrambled control mode, dimension required to
perform functions is much inferior to available dimension.
Then relationships between respond modes and respond functions output a characteristic is defined.
This model is used as a starting point for the definition of a model of level 3.
C. Modelling Automation degradation consequences on node resilience capacity
The third level aims to support modelling propagation of the variability of model of level 2 to the node resilience capacity.
1) Step 1. Resilience capacity description.
This first phase is related to the description of the information about the node resilience capacity. Information is related to the different events that the node have to deal with and respond function associated. Events are considering related to the following typology: normal events, regular unexpected events and irregular unexpected events. For each event consequences of an inadequate response (in time or in precision) are defined.
2) Step 2. Level 3 function definition.
Based on the description provided, model of level 2 is extended in considering the respond functions associated to the other events. Attention have to be made in the different coupling relation between the different respond capacity functions in order to model the interdependence between them (share of operators and/or resources, delay, priorities, etc.).
3) Step 3. Level 3 function variability model definition.
A FRAM based variability model of the level 3 functions is defined. Level 2 variability model definition step is applied to the several respond functions that constitute the model.
Once this method is applied, a FRAM model at level 3 is produced. This model can be used as a starting point for the definition of a model of level 4.
D. Modelling Automation degradation consequences on network performance
The fourth level aims to support modelling propagation of the variability of model of level 3 to the network performance.
1) Step 1. Network structure performance description.
This first phase is related to the description of network structure and performance. For each node that constitutes the network key performance indicators are defined. For each type of links between nodes (physical, cyber, geographic, etc.) a description is also provided.
2) Step 2. Level 4 function definition.
Based on the description provided, model of level 3 is extended in considering the functions and performance indicators of the nodes and the several links of connection.
3) Step 3. Level 4 function variability model definition.
A FRAM based variability model of the level 4 functions is defined. A relation between variability of node inputs, node performance model, and nodes output and environment variability is defined based on the variability model of level 3.
IV. CONCLUSION
The overall objective of the ongoing work presented in this paper is to define an overall design framework of automation degradation propagation in complex networks, and an associated method supporting the framework in order to study automation and more precisely automation degradation. A four
steps process has been presented in the current paper focusing on the modelling of consequences flowing from automation degradation. We have exemplified this process on a case study in the domain of Air Traffic Management showing how the refinement is performed and how additional information gathered is modelled. We also presented how automation degradation propagates and how information related to consequences is gathered and modelled in the context of that case study.
The next phases of the research work is related to the application of the other phases of the method to the AMAN case study in order to consolidate and to improve the method, and to be able to apply it to another case study in the area of RPAS (Remotely Piloted Aircraft Systems). The application of the process on these two case studies will allow us to confront the method and its associated framework to applications featuring different levels of automations according to Sheridan et al. classification [11].
ACKNOWLEDGMENT
This work is partly funded by Eurocontrol research network HALA! on Higher Automation Levels in Aviation and SESAR Work Package E, which is addressing long-term and innovative research.
REFERENCES
[1] Mitchell M., Complexity a guided tour, Oxforf university press, 2009. [2] Parasuraman R., Sheridan T. B., Wickens C.D., A model for Types and
Levels of Human Interaction with Automation, IEEE Transactions on Systems, Man, and Cybernetics - Part A: Systems and Humans, Vol 30, N03, May 2000
[3] Hollnagel E., Pariès J., Woods D. D., Wreathall J., Resilience Engineering in Practice; Ashgate Studies in Resilience Engineering, 2011
[4] Westrum R., A typology of resilience situations, in Hollnagel E., Woods D.D., Leveson N., Resilience Engineering Concepts and Precepts, Ashgate 2006
[5] Rinaldi S. M., Peerenboom J. P., Kelly T. K., "Identifying, Understanding and Analyzing Critical Infrastructure Interdepencies", IEEE Control Systems Magazine, 2001
[6] Martinie C., Palanque P., Pasquini A., Ragosta M., Rigaud E., Silvagni S., Using Complementary Models-Based Approaches for Representing and Analysing ATM Systems’ Variability, Proceeedings of the 2nd International Conference on Application and Theory of Automation in Command and Control Systems ATTACS12, London 2012.
[7] Hollnagel E., Barriers And Accident Prevention, Ashgate 2004
[8] Hollnagel E., FRAM: The Functional Resonance Analysis Method: Modelling Complex Socio-technical Systems, Ashgate Publishing Limited 2012
[9] Martinie C., Palanque P., Barboni E., Ragosta M.. Task-Model Based Assessment of Automation Levels: Application to Space Ground Segments . IEEE Int. Conf. on Systems, Man and Cybernetics, , IEEE Computer Society, 2011.
[10] Martinie C., Palanque P. & Winckler M. Structuring and Composition Mechanism to Address Scalability Issues in Task Models. IFIP TC13 INTERACT 2011 conference, Springer Verlag, LNCS.
[11] Sheridan, T.B., Verplanck, W.L. Human and computer control of undersea teleoperators. Technical report. Man-machine systems lab, Dept of Mechanical Engineering, MIT, Cambridge, MA, (1978).