HAL Id: hal-00728570
https://hal.archives-ouvertes.fr/hal-00728570
Submitted on 30 Aug 2012
HAL is a multi-disciplinary open access
archive for the deposit and dissemination of
sci-entific research documents, whether they are
pub-lished or not. The documents may come from
teaching and research institutions in France or
abroad, or from public or private research centers.
L’archive ouverte pluridisciplinaire HAL, est
destinée au dépôt et à la diffusion de documents
scientifiques de niveau recherche, publiés ou non,
émanant des établissements d’enseignement et de
recherche français ou étrangers, des laboratoires
publics ou privés.
A MODELLING FRAMEWORK FOR
PROCUREMENT OF A RETAIL DISTRIBUTION
SYSTEM WITH ECONOMIC AND
ENVIRONMENTAL GOALS
Marie Sawadogo, Nathalie Bostel, Pierre Dejax
To cite this version:
Marie Sawadogo, Nathalie Bostel, Pierre Dejax. A MODELLING FRAMEWORK FOR
PROCURE-MENT OF A RETAIL DISTRIBUTION SYSTEM WITH ECONOMIC AND ENVIRONPROCURE-MENTAL
GOALS. 9th International Conference on Modeling, Optimization & SIMulation, Jun 2012, Bordeaux,
France. �hal-00728570�
“Performance, interoperability and safety for sustainable development”
A MODELLING FRAMEWORK FOR PROCUREMENT OF A RETAIL
DISTRIBUTION SYSTEM WITH ECONOMIC AND ENVIRONMENTAL
GOALS
Nathalie BOSTEL IUT de Saint-Nazaire/ IRCCyN
Département GLT 58 rue Michel Ange, BP 420 44606 Saint-Nazaire Cedex - France
Nathalie.Bostel@univ-nantes.fr
Pierre DEJAX, Marie SAWADOGO Ecole des Mines de Nantes / IRCCyN Département Automatique Productique
4 rue Alfred kastler, BP 20722 44307, Nantes Cedex 3 – France Pierre.Dejax, marie.sawadogo@mines-nantes.fr
ABSTRACT: Reducing procurement costs as well as controlling greenhouse gas (GHG) emissions is becoming a
major concern for the retail industry. In order to support a retail company to optimize its procurement policy and coordination with its suppliers at the tactical planning level, we propose a multi-periodic, multi-product modeling framework for a three-level distribution system encompassing the suppliers, intermediate platforms and distribution centers. Different procurement and transport policies may be undertaken between the entities, such as direct shipment from the suppliers to the distribution centers or shipment through intermediate platforms. We have designed a generic MIP (Mixed Integer Programming) model with two objective functions to be considered (total shipment and storage cost, or CO2 emissions from transport). Solutions will be obtained using realistic data provided by a major French retail company.
KEYWORDS: Supply chain, Sustainable development, Transport network, Optimization, Retail industry.
1 INTRODUCTION
Transport is an essential component of the management of physical flows in supply chains, interfering from the sourcing of raw materials to the product distribution and to end customers. It also plays a key role in the delivery of products or other materials for systems with open or closed loop. Improving the efficiency of transport is a major issue in the supply chain management.
However, for many years, the performance of supply chains and transportation networks has been studied only in economic terms, especially with the objectives of cost minimization or profit maximization in a given context. Taking into account the uncertainty and the quality of service have been introduced gradually.
Nowadays, distribution activities are increasingly facing the challenges of sustainable development. Global sup-ply chains now span long distances and require signifi-cant use of fossil fuels to deliver goods to consumers (Venkat, 2003). Indeed, the transport sector is a major source of greenhouse gas (GHG) emissions. Internation-al studies highlight the need to find Internation-alternatives to reduce carbon footprint and other impacts from transportation systems. Impacts from freight transportation systems have increased; by 2050 global emissions from vehicle use might be 2.5 to 3 times as large as they were in 2000 (Transport Outlook, 2011). Furthermore, (Piecyk and McKinnon, 2010) studied three scenarios illustrating the trend of road freight carbon footprint. According to their
study, the carbon footprint of road freight sector will increase to 30.0 million tones of CO2 in 2020 (56%
above the present level), if no action is implemented to limit the phenomenon.
Therefore, actions must be taken to reduce the environ-mental impacts of these systems. Most of the studies highlight the need to reduce environmental impacts from road transport and to move toward more environmentally friendly transport systems.
Some actions have been taken relatively for sustainable development for freight transport and for city logistics. Among solutions, there is the need to use alternative transportation modes by promoting multimodal transpor-tation systems (Sawadogo and Anciaux, 2011) in order to reduce their environmental and societal impacts. Mul-timodality combined with a pooling system has been studied by (Pan et al., 2010) in order to reduce distribu-tion cost and CO2 emissions. Other alternatives for
re-ducing emissions from distribution systems are by alter-native fuels, eco-driving …
In this paper we address the problem of the tactical plan-ning of procurement and transport activities for the mul-tiproduct distribution system of a retail supply chain with economic and environmental goals. In order to do so, we propose a generic modeling framework for a three-level system covering suppliers, intermediate platforms ware-houses or distribution centers. We have designed a ge-neric model for multi-periodic planning of transport and storage activities allowing different transport policies
MOSIM’12 - June 06-08, 2012 - Bordeaux - France
and transportation modes. This model considers the total transport and logistics costs, and CO2 emissions from
transport in products distribution for a retail supply chain. It aims at investigating different distribution and transport policies on the basis of their economic and environmental impacts. We will also investigate the ecological impact of a given economic strategy. The ultimate goal is to provide to decision makers new dis-tribution canals and new disdis-tribution policies with less environmental impacts while reducing the distribution cost.
The paper is organized as follow: section 2 contains a literature review about of sustainable development issues in distribution systems. Section 3 is devoted to describ-ing our modeldescrib-ing approach and section 4 is about the perspectives for solving this model. Section 5 contains our conclusions and the expected extensions of our ap-proach.
2 SUSTAINABLE DEVELOPMENT FOR TRANSPORTATION NETWORKS DESIGN AND OPTIMIZATION
Traditionally, studies about supply chain management have been focused on supply chain design and planning mainly based on the economic issues (cost, time, quality of service...). A literature review on these models has been proposed by (Mula et al., 2010); they have present-ed a review of mathematical programming models for supply chains, considering both production and transport activities including supply chain structure, decision lev-els and modeling approaches. Regarding the transport planning, (Crainic and Laporte, 1997) identified the main problems related to freight transport planning as well as relevant operations research existing methods and models. More recent methodological advances in the transport planning area are presented in the book edited by (Barnhart and Laporte, 2007); the chapter presented by (Crainic and Kim, 2007) addresses the relevant meth-odological questions relative to the planning of transport operations at the national and regional levels, also ad-dressing multimodal transportation planning.
It is well-known that economic productivity remains the major concern of companies. Nevertheless, environmen-tal issues, particularly greenhouse gas emissions reduc-tion and energy consumpreduc-tion reducreduc-tion are increasingly at the heart of their policies. This is partly due to legisla-tive obligations (Kyoto protocol 1997, European com-mission regulations…), and partly due to the brand im-age that companies want to put forward.
So, the current state and trend of environmental degrada-tion implies a need for change in consumer and manufac-turing practices. There must be a fundamental change in the management of operations and distribution systems. We are seeing a move towards sustainability pointing out the need for integrating the three constituent parts
(so-cial, economic and environment) of sustainable devel-opment into supply chain management.
Green supply chain is defined as the integration of
envi-ronmental issues into the supply chain management, going from the sourcing to distribution of the product to customer, including reverse logistics. Some literature reviews about green supply chain management can be found in (Sarkis et al., 2011), (Beamon, 1999), (Srivastava, 2007). The impacts identified in these stud-ies are greenhouse gas emissions (CO2, NOx...), the
wastes, the noise emitted, and the degradation of ozone layer among others.
Sustainable Supply Chain incorporates the principle of green supply chain (Seuring and Müller, 2008) by inte-grating social and economic components of sustainable development. In the literature, many studies are present-ed about supply chains performance analysis and optimi-zation considering the sustainable development constitu-ent parts. Most of these studies focus on reducing the carbon footprint of distribution systems.
Up to now, social issues of distribution systems have been studied through corporate social responsibility (CSR) by implementing logistic social responsibility (LSR). (Ciliberti et al., 2008) presented a taxonomy of LSR practices underlying five areas, namely purchasing, social responsibility, sustainable transportation, sustain-able packaging, sustainsustain-able warehousing, and reverse logistics.
In their recent paper, (Chardine-Baumann and Botta-Genoulaz, 2011) proposed a framework for sustainable performance assessment in a supply chain. They pro-posed three models; the first one analyses the sustainable performance of a supply chain considering economic, social and environment criteria. The second model point out the relationships between some supply chain man-agement practices and a supply chain performance ma-trix. The third one is an analytical assessment model based on the Supply Chain Sustainable Performance (SCSP) matrix, which permits to determine the sustaina-ble performance profile of a supply chain.
Some models for computing the environmental and so-cial impacts of transportation systems can be found in (Janic, 2007). (Bektaş and Laporte, 2011) clearly show the possible diverging interests between minimizing the cost (particularly drivers cost), traveled distance and CO2
emissions. They use an objective function that incorpo-rates in particular the fuel costs, and the CO2 emissions
cost. But according to (Kohn and Brodin, 2007), there are many cases where even the operational or tactical decisions are inconsistent with the strategic objectives; they demonstrate that it is possible to improve simulta-neously costs, service and environmental impact.
Regarding the reduction of carbon footprint in distribu-tion systems, there are two main trends in the literature.
The first one considers the optimization and reduction of the environmental costs; for example, (Forkenbrock, 1999) proposed an evaluation model for computing in-ternal and exin-ternal costs of intermodal transport on one side and road transport on the other side, considering factors such as demand, capacity and vehicles filling rate as well as frequencies and apply it to a European transport case. His modeling concerns accidents cost, GHG emissions cost, and cost due to noise and public works (such as road building or maintenance).
The second trend aims at computing the real amount of CO2 emitted at each phase of the distribution process. To
this end, many studies have been conducted to compute emissions factors for transportation systems according to the transportation mode used; see for example Artemis (Joumard et al, 2007), or INFRAS-HBEFA (Rexeis et
al., 2009). According to these studies, the total emissions
depend on the emission factor and the activity data as follows:
Emissions = “activity data” x “emission factor”
Activity data means the amount of energy burned. The emission factor is the amount of CO2 generated by each
activity data, for example, tons of CO2 per tons of good
transported.
(DEFRA, 2005) proposes conversion tables between the quantity of fuel used and the quantity of emissions of CO2. Several units are used in order to measure the GHG
or CO2 emissions: Carbon equivalent, CO2 equivalent of
GHG or CO2 emissions only. Some European projects
have been devoted to the estimation and modeling of GHG emissions from transport: MEET (Hickmann et al., 1999), COST (Joumard et al., 1999) and (INFRAS, 2008).
There are some commercial softwares calculating the CO2 emissions of a distribution network based on these emission factors, but these evaluations are often made a priori or a posteriori, knowing all characteristics and flows of supply chain and transport system. On the con-trary, our approach aims at optimizing the supply chain and transport systems characteristics and the vehicles and goods flows in order to reduce costs and CO2 emis-sions in a decision making process.
In the retail industry, the global emissions from transpor-tation must encounter the emissions along the whole distribution process (from the supplier to the stores). In recent years, retailers have been implementing tech-niques for reducing environmental impacts at each level of their activity. These techniques involve pooling where different suppliers share the same distribution center; see for example (Pan et al., 2010). Other actions have been taken to optimize the loading factor of each transporta-tion mode used, by using different loading units, and conveying different products in the same load unit; this contributes for example to reducing the number of trucks
used. Some retailers implemented actions as using inland waterways for their transportation, using transportation modes with lower noise level or implementing green purchasing.
In conclusions of this state of art one can observe that a significant amount of work has already been devoted to green supply chain management in two directions: eval-uation of the economic and environmental impacts of activities, or the development of optimization models for decision making. In the distribution and retail sector, noticeable work with the optimization approach has been devoted to the consideration of cooperation among sup-pliers through pooling of resources in order to achieve a better productivity and reduce the environmental impacts of transport.
In our work, we develop a different approach focused on the redefinition of the procurement supply chain of a given distributor. We will focus on the environmental impacts abatement of the distribution system including transportation and the related procurement operations (cross-docking, storage). We will consider only the emissions of CO2 and the overall cost. The major
chal-lenge in this study is to strike a balance between envi-ronmental performance and maintenance of acceptable delivery, responsiveness, quality and costs.
3 PROBLEM DESCRIPTION AND FORMULATION
In our modeling framework, we consider the distribution of products in a retail supply chain. The studied network consists of four possible entities (figure 1):
• The supplier facility or warehouse
• The retailer platform
• The distribution center
• The stores
In this network, a set of platforms receive products from suppliers and then, the products are transported from platforms to each distribution center according to a min-imum known demand from the stores. In this paper, we will consider the products flows from suppliers to the platforms, and the distribution centers. The optimization of distribution of products from the distribution centers to the retail stores is out of the scope of our work.
We assume that the shipment of products from the sup-pliers’ warehouses to the platforms allows less than truck load transportation, while full truck load transportation between the platforms and distribution centers is im-posed as a general policy in order to increase efficiency. Multimodal transportation is allowed for the transporta-tion from platforms to distributransporta-tion centers, which can be done either by road or by train.
MOSIM’12 - June 06-08, 2012 - Bordeaux - France
Figure 1: Generic supply chain for retail activity
Our modeling approach will allow the testing of different alternative scenarios.
3.1 Hypothesis
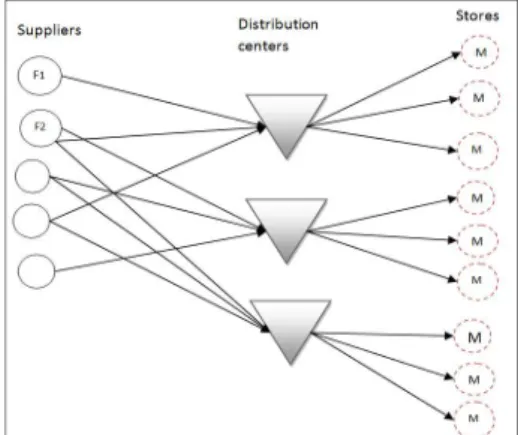
Figure 2 represents the generic distribution network underlying our modeling approach as described above.
Figure 2: Generic distribution network
• We consider the tactical planning of procure-ments and transport activities over a number of time periods (typically covers several weekly time periods).
• Several suppliers may offer the same product
• A given supplier may provides several products
• Products are shipped onto pallets
• Depending on the transportation links, two transportation modes may be considered: road and rail. Road transportation may use LTL (Less than Truck Load) or FTL (Full Truck Load) vehicles, while rail transportation is re-stricted to a minimum load.
• Transportation costs will distinguish costs ap-plied to full load means of transport and costs applied to pallets shipped by LTL mode.
• Retail stores are allocated to a specific distribu-tion center.
Due to the last hypothesis, the aggregated demand from the stores constitutes the demand of the corresponding distribution center. So, the minimum demand of product
from the distribution center at the period is . 3.2 Notations
Sets:
Set of platforms
Set of platforms delivering the distribution center Set of platforms delivered by supplier
Set of suppliers
Set of suppliers allocated to platform ;
=
Set of products
Set of products delivered by supplier Set of distribution centers
Set of time periods
Set of transportation mode (truck/train)
1 Set of less than truck load (LTL) transportation
modes
2 Set of full truck load (FTL) transportation modes 3 Set of rail transportation mode
1 Set of 1 transportation modes used from any entity
2 Set of 2 transportation modes used from any entity
3 Set of 3 transportation modes used from any entity
Type transportation modes used from any entity
Parameters
Transportation cost for a pallet by the mean of transport
Transportation cost for a full load means of transport
Cross-docking cost for a pallet at platform Handling cost for a pallet of product at distribu-tion center
ℎ Holding cost for a pallet of product at distribution
center
Travel distance between two entities and
! Capacity in pallets of means of transport ! " Storage capacity in pallets in the distribution
center Supplier warehouses Platforms Distribution centers Retail stores CO2 Not included
! Cross-docking capacity in pallets in the platform ! Capacity of supplier for product
! # $ Minimal allowed shipment by transportation mean
"0 Initial inventory of product in the distribution
center at period = 0
" Ending inventory of product in the distribution
center at period =
Aggregated demand for product of all the stores allocated to distribution center at period
Variables
" Inventory of product at the end of period in the
distribution center
& The number of pallets of product transported
from to using the means of transport at period The number of full load means of transport used between the entities and at the period
' The number of residual pallets in the less than truck
load means of transport
( Binary variable equal to 1 if there is a less than load
truck between and , 0 otherwise
3.3 Emissions factor calculation
The emissions factor aims to compute the amount of CO2
emitted by any transportation mode. The factor that we used depends on the number of pallets transported, the traveled distance and the truck loading factor.
This emissions factor retained is based on the MEET report (Hickman et al, 1999) and (Pan et al., 2011) with the following hypothesis: for road transportation, the vehicles are Heavy Duty Vehicles of 38 t, the average speed is 80 km/h, a road gradient of 0% is considered; the capacity of the trucks varies from 20 to 50 pallets depending on the product transported. We obtain the following formula:
)* #⁄ ,-. = 772 + 324 - (1)
where - is the loading factor with - =∈ [0,1].
Depending on the loading factor, we can compute two emission factors: one for the full load trucks )677 and one for empty trucks )8# 9. So, given these assump-tions for road transportation:
)677= 1,096 kg/km
)8# 9 = 0,772 kg/km
Considering these emissions factors, the travel distance and the truck load in terms of number of pallets, the amount of CO2 emitted is calculated by:
With d=distance, c=transport capacity in pallets,
x=number of pallets transported.
For rail transportation, the train considered here is an electric “short train”; the gross weight of short trains has been estimated to be around 500 - 600t, the average speed considered is 100km/h and the total capacity in pallets is 36 in each railcar with 13 railcars per train. Given these hypothesis, the emission factor for rail transport is:
)* #⁄ ,@. = 0.498 + 0.0014 @ (2)
where @ is the number of pallets transported. The emissions factors retained are:
)8# 9= 0,498 kg/km
)677 = 1,16 kg/km, considering a train with 13 railcars.
3.4 Model formulation
Two objective functions have been implemented into the generic model.
Objective 1: Cost minimization
The first objective is to minimize the total transportation cost for the overall network. This cost function takes into account the overall cost of the network; it involves the transportation cost between any suppliers and the plat-forms, the cross-docking cost in the platplat-forms, the trans-portation cost between the platforms and the distribution centers.
The generic cost function has five components and is given by F1:
C1 = D, 1 + 2 + 3 + + E.
∈F
,3.
Where:
• 1 is the transportation cost between suppliers
and platforms: 1 = D D D D G ' + H ∈IJ ∈KJ ,4. ∈LM ∈N
• 2 is the transportation cost between platforms
and distribution centers:
2 = D D D D ∈I ∈KM ∈O ∈N ,5.
• 3 is the transportation cost between suppliers
MOSIM’12 - June 06-08, 2012 - Bordeaux - France 3 = D D D D ∈IJ ∈KJ G ' + H ,6. ∈L ∈O
• is the cross-docking cost at platforms
= D D D D & ∈IJ ∈KJ ∈LM ∈N ,7.
• E is the operations costs at distribution centers E = D D D D & ∈I ∈KJ ∈L∪NR ∈O + D D ℎ " ∈I ∈O ,8.
The operations costs here represent the products han-dling cost including all the flow of products entering the distribution centers and the holding cost.
Objective 2: CO2 minimization
Objective function F2 computes the amount of CO2
emitted for the transportation between suppliers and platforms or distribution centers, and from platforms to distribution centers, using the expressions developed in section 3.3.
C2 = D,) 1 + ) 2 + ) 3.
∈F
,9.
Where,
•
) 1 is the amount of CO
2due to transportationbetween suppliers and platforms:
) 1 = D D D S T& S)677 !− )8# 9V
∈KJ ∈LM ∈N
+ )8# 9G + ( H WV ,10. •
) 2 is the amount of CO
2due to transportationbetween platforms and distribution centers:
) 2 = D D D & )677
∈KM
,11.
∈NR ∈N
•
) 3 is the amount of CO
2due to transportationbetween suppliers and distribution centers:
) 3 = D D D S T& S)677 !− )8# 9V ∈KJ ∈O ∈L + )8# 9G + ( HWV ,12. Constraints " XY+ D D & ∈KJ ∈L∪NR ≥ ∀ , , ,13.
D D & ∈KJ ∈L = D D & ∈KM ∈O ∀ , , ,14. D D & ∈KJ ∈NJ∪O ≤ ! ∀ , , ,15. D D D & ∈KM ∈I ≤ ! ∈LM ∀ , , 16. D " ∈I ≤ ! " ∀ , ,17. " ]= "0 ∀ , ,18. " F= " ∀ , ,19. " XY+ D D & ∈KJ ∈L∪NR − = " ∀ , , ,20. D & ∈I = ! + ' ∀ ∈ , ∈ ∪ , , ∈ 1 ,21. D & ∈I = ! ∀ ∈ , ∈ ∪ , , ∈ 2 ,22. D & ∈I = ! ∀ , , ∈ , ∈ 2 ,23. D & ∈I = ! + ' ∀ , , ∈ , ∈ 3 ,24. ' < ! ∀ , , , ∈ ,25. ' ≤ ! ∀ ∈ 3, , , ,26.
Constraint (13) is the retail stores demand satisfaction constraint which includes the quantity of products sup-plied to each distribution center and the total inventory at distribution center . Constraint (14) is the flow con-servation constraint at each platform. Constraints (15), (16) and (17) are the capacity constraints at respectively the supplier warehouse, the platform and the distribution center. Constraint (18) and (19) are resp. the inventory at period 0 and the inventory at the last period in distribu-tion center for each product . Constraint (20) is the inventory equilibrium constraint at distribution center . Constraints (21) and (24) are the transportation mode capacity constraints when moving from the supplier plant to the platform and respectively when moving from platform to distribution center. Constraints (22) and (23) are about the full truck or the train capacity constraints when moving from the platform and the distribution centers, where the number of non-fill loads is equal to zero. Constraint (25) insures that the number of residual
pallets is less than the means of transport v capacity. Constraint (26) insures the avoidance of non-filled trains.
3.5 Distribution scenarios analysis
The generic model presented above can be solved ac-cording to different scenarios corresponding to possible logistic policies that a retail company may want to eval-uate considering their costs and CO2 emissions impacts. We propose to study three complementary scenarios.
Scenario 1:
In this scenario, suppliers may either deliver their prod-ucts to platforms or directly to the distribution centers. This scenario corresponds to solving the full generic model (figure 2).
Scenario 2:
All the suppliers will ship their products directly to the distribution centers. Cross-docking platforms are not considered for shipment consolidation to the distribution centers (figure 3). Furthermore, the rail mode is no more considered.
Figure 3: Distribution network for scenario 2
The overall cost associated to this network corresponds to the transportation cost from the suppliers to the distri-bution centers and the storage cost at the distridistri-bution centers.
The cost function (1) becomes:
C1 = D, 3 + E.
∈F
,27.
The CO2 emissions are only relative to the transportation between the suppliers and the distribution centers. The emission function (8) becomes:
C2 = D ) 3
∈F
,28.
Where 3 and E are defined as in 3.3 equations (4) and (6). ) 3 is defined as in 3.4, equation (11). For this scenario, the objective functions are subjected to con-straints (13), (17), (18), (19), (20), (21) and (25).
Scenario 3:
All suppliers deliver their products through platforms. This scenario allows the consolidation of all the products from the suppliers into the platforms (figure 4). The resulting increased fret to be transported between the platforms and the distribution centers benefits of the FTL advantages and railroad transport may be considered.
Figure 4: Distribution network for scenario 3
For this scenario, the total cost includes the transporta-tion cost from supplier’s plants to the platforms, the cross-docking cost associated to the platforms, the trans-portation cost from the platforms to distribution centers and the total operations costs at each distribution center.
The cost function (1) becomes:
C1 = D, 1 + 2 + + E.
∈F
,29.
The amount of CO2 emitted (8) becomes therefore: C2 = D ) 1
∈F
+ ) 2 ,30.
Where 1, 2, and E are defined as in 3.3. ) 1 and ) 2 are defined as in 3.4. The objective functions are subjected to constraints (14), (15), (16), (21), (22), (23), (24), (25) and (26).
4 PROSPECTS FOR NUMER ICAL EXPERIMENTATIONS AND SOLVING Having two objective functions leads us to implement techniques that can encompass both these objectives. This model is currently being implemented on the case of a major French retail company.
We are implementing several solving options. We can distinguish two strategies: an economic strategy and an environmental strategy.
For the economic strategy, the first option is to optimize the cost function and then evaluate the amount of CO2
emissions resulting from the obtained solution. Then the amount of CO2 obtained will be used to define
con-straints limiting the CO2 emissions and the cost the cost is therefore optimized again.
MOSIM’12 - June 06-08, 2012 - Bordeaux - France
For the environmental strategy, the first step will to op-timize the environmental function F2 and to evaluate the economic result of an environmental strategy. The pro-curement cost corresponding to the obtained solution will used as a constraint in a second step where CO2
emissions will be optimized under cost constraints.
Another possibility is to use multiobjective optimization techniques and find a trade-off between the two objec-tives. A Pareto front will be then determined to analyze the compromise.
For solving the model according to the different scenari-os, we will either use a commercial MILP solver or de-velop a specific heuristics. Depending on the problem size and its complexity, we may have to apply some relaxations or include some valid inequalities.
This model will be implemented on a case study based on a retail network in France, using data and supply chain network from a major French retail company.
We are currently implementing the model using the CPLEX solver. Depending on their complexity and prob-lem sizes, the various scenarios exposed in section 3 will be solved either by CPLEX or will call for the develop-ment of specific heuristics.
5 CONCLUSION AND CURRENT WORK In this paper we have proposed a modeling framework for the determination of best procurement strategies in the retail distribution sector. To that purpose we have developed a generic optimization model taking into account economic as well as environmental goals. Three different scenarios corresponding to possible procure-ment policies have been proposed. Solving the model aims at determining the best procurement strategy de-pending on their impact in terms of cost and CO2 emis-sions.
Several directions may be determined for future works. The current model does not consider any requirement in terms of delivery frequencies from the suppliers, which favors the utilization of full load trucks. Including fre-quency requirements into the model will be more realis-tic. The model could be extended in order to allow the utilization of central warehouses as an alternative to the cross-docking platforms. In the economic function (F1) the LTL constant unitary cost for shipping pallets could be replaced by a more realistic term taking into account the size of the shipments. We also intend to include the emissions due to operations of the platforms and the distribution centers, in order for the emissions function (F2) to be more comprehensive. Finally, we could extend the network to include the retail stores. Delivery of products to the stores could be done directly from the corresponding distribution centers or using vehicle rout-ing. In this case, we would consider developing vehicle routing models with backhauls. Backhauling would
allow the collection of products from some nearby sup-pliers to avoid empty returns.
Preliminary results will be presented at the conference.
ACKNOWLEDGMENTS
This research is partially funded by the French ADEME agency through the FUSION CO2 project of the PREDIT 4 GO4 program under the convention n°10 66C 0027. The FUSION CO2 project has been labeled by the Competitiveness Cluster EMC2. The authors acknowledge the contribution of the retail company that has provided the industrial context of this research and the experimental data.
REFERENCES
Beamon B. M., 1999. Designing the Green Supply Chain. Logistics Information Management, Vol.12, N°4, p. 332-342.
Bektas T., Laporte G., 2011. The pollution-routing problem. Transportation Research Part B, 45(8), p. 1232–1250.
Chardine-Baumann E., Botta-Genoulaz V., 2011. A framework for sustainability performance assess-ment of supply-chain manageassess-ment practices. 41st
In-ternational Conference on Computers & Industrial Engineering (CIE 41), Los Angeles, California,
USA, October 23-26, CDRom Proceedings ISSN 2164-8670 (Online ISSN 2164-8689) p.98-103. Ciliberti F., Pontrandolfo P., Scozzi B., 2008. Logistics
social responsibility: Standard adoption and practices in Italian companies. Int. J. Production Economics 113, p. 88–106.
Crainic T.G., Laporte G., 1997. Planning models for freight transportation. European Journal of
Oper-ational Research, Vol. 97, p. 409-438.
Crainic T.G., Kim K.H., 2007. Intermodal transpor-tation, chapter 8 in Barnhart C. et Laporte G. (Eds.) (2007). Transportation, Handbook in Operations Re-search and Management Science, Vol. 14, North Holland, p. 467-538.
DEFRA 2005. Guidelines for company reporting on greenhouse gas emissions, London.
Forkenbrock D.J., 1999. External costs of intercity truck freight transportation, Transportation Research Part A: Policy and Practice, Vol. 33, p.505-526.
Hickman J., Hassel D., Joumard R., Samaras Z., Sorenson S., 1999. Methodology for calculating transport emissions and energy consumption. (Report
for the MEET Project). Transport Research Laboratory, Edinburgh,UK
INFRAS: Schreyer C., Schneider C., Maibach M., RothengatterW., Doll C., 2008. External Cost of Transport.
Janic M., 2007. Modelling the full costs of an intermodal and road freight transport network. Transportation
Joumard R., 1999. Methods of estimation of atmos-pheric emissions from transport: European scientist network and scientific state-of-the-art (Action COST
319 final report). INRETS report LTE9901.
Kohn C., Brodin H., 2008. Centralised distribution systems and the environment: how increased trans-port work can decrease the environmental impact of logistics, International Journal of Logistics Research
and Applications, 11(3), p. 229 - 245.
Mula J., Peidro D., Diaz-Madronero M., Vicens E. 2010. Mathematical programming models for supply chain production and transport planning. European Journal
of Operational Research, 204, p. 377–390.
Pan S., Ballot E., Fontane F., 2010. The reduction of greenhouse gas emissions from freight transport by pooling supply chains, International Journal of
Pro-duction Economics, doi:10.1016/j.ijpe.2010.10.023.
Piecyk, M.I., McKinnon, A.C., 2010. Forecasting the carbon footprint of road freight transport in 2020.
International Journal of Production Economics, Vol.
128, p.31-42.
Sarkis J., Zhu Q., Lai K., 2011. An organizational theoretic review of green supply chain management literature, International Journal of Production
Economics, doi:10.1016/j.ijpe.2010.11.010.
Sawadogo, M., Anciaux, D., Roy D., 2011. Sustainable Intermodal Freight by route choice with practicality constraints, Association for European Transport and
contributors 2011, European Transport Conference,
10 -12 October 2011, Glasgow, Scotland, UK. Seuring S., Müller M., 2008. From a literature review to
a conceptual framework for sustainable supply chain management, Journal of Cleaner Production, 16, p. 1688-1710.
Srivastava S.K., 2007. Green supply-chain manage-ment: A state-of-the-art literature review.
Internatio-nal JourInternatio-nal of Management Reviews 9(1): 53-80.
Transport Outlook 2011. Meeting the Needs of 9 Billion People. OECD-International Transport forum. Venkat K., 2003. Global Trade and Climate Change.