HAL Id: hal-03135433
https://hal.archives-ouvertes.fr/hal-03135433
Submitted on 8 Feb 2021
HAL is a multi-disciplinary open access
archive for the deposit and dissemination of
sci-entific research documents, whether they are
pub-lished or not. The documents may come from
teaching and research institutions in France or
abroad, or from public or private research centers.
L’archive ouverte pluridisciplinaire HAL, est
destinée au dépôt et à la diffusion de documents
scientifiques de niveau recherche, publiés ou non,
émanant des établissements d’enseignement et de
recherche français ou étrangers, des laboratoires
publics ou privés.
VR based Power Wheelchair Simulator: Usability
Evaluation through a Clinically Validated Task with
Regular Users
Guillaume Vailland, Louise Devigne, François Pasteau, Florian Nouviale,
Bastien Fraudet, Emilie Leblong, Marie Babel, Valérie Gouranton
To cite this version:
Guillaume Vailland, Louise Devigne, François Pasteau, Florian Nouviale, Bastien Fraudet, et al.. VR
based Power Wheelchair Simulator: Usability Evaluation through a Clinically Validated Task with
Regular Users. VR 2021 - IEEE Conference on Virtual Reality and 3D User Interfaces, Mar 2021,
Lisbon, Portugal. pp.1-8. �hal-03135433�
VR based Power Wheelchair Simulator: Usability Evaluation through a
Clinically Validated Task with Regular Users
Guillaume Vailland* Univ Rennes, INSA Rennes,
Inria, CNRS, Irisa, France
Louise Devigne† Univ Rennes, INSA Rennes,
Inria, CNRS, Irisa, France
Franc¸ois Pasteau‡ Univ Rennes, INSA Rennes,
Inria, CNRS, Irisa, France
Florian Nouviale§ Univ Rennes, INSA Rennes,
Inria, CNRS, Irisa, France
Bastien Fraudet¶
P ˆole Saint H ´elier Rehabilitation center, France
´
Emilie Leblong||
P ˆole Saint H ´elier Rehabilitation center, Irisa,
France
Marie Babel** Univ Rennes, INSA Rennes,
Inria, CNRS, Irisa, France
Val ´erie Gouranton††
Univ Rennes, INSA Rennes, Inria, CNRS, Irisa, France
ABSTRACT
Power wheelchairs are one of the main solutions for people with reduced mobility to maintain or regain autonomy and a comfortable and fulfilling life. However, driving a power wheelchair in a safe way is a difficult task that often requires training methods based on real-life situations. Although these methods are widely used in occupational therapy, they are often too complex to implement and unsuitable for some people with major difficulties. In this context, we collaborated with clinicians to develop a Virtual Reality based power wheelchair simulator. This simulator is an innovative training tool adapted to any type of situations and impairments. In this paper, we present a clinical study in which 29 power wheelchair regular users were asked to complete a clinically validated task designed by clinicians within two conditions: driving in a virtual environment with our simulator and driving in real conditions with a real power wheelchair. The objective of this study is to compare performances between the two conditions and to evaluate the Quality of Experi-ence provided by our simulator in terms of Sense of PresExperi-ence and Cybersickness. Results show that participants complete the tasks in a similar amount of time for both real and virtual conditions, using respectively a real power wheelchair and our simulator. Results also show that our simulator provides a high level of Sense of Presence and provokes only slight to moderate Cybersickness discomforts resulting in a valuable Quality of Experience.
1 INTRODUCTION
Over the last few years, Virtual Reality (VR) became a particularly effective tool to design immersive 3D worlds. In particular, VR allows the design of simulators that integrate accurate 3D models and allows the user to have virtual experiences that mimic real situations. These possibilities make VR a widespread tool to design simulators for entertainment, but also for many other purposes in particular in the medical field such as medical staff training or surgical training [5, 6, 30].
In the context of rehabilitation, VR simulation is promising and leads to the design of various innovations [11]. In fact, a VR ex-perience is not only adaptable and controllable, but is also entirely
*e-mail: [email protected] †e-mail: [email protected] ‡e-mail: [email protected] §e-mail: [email protected] ¶e-mail: [email protected] ||e-mail: [email protected] **e-mail: [email protected] ††e-mail: [email protected]
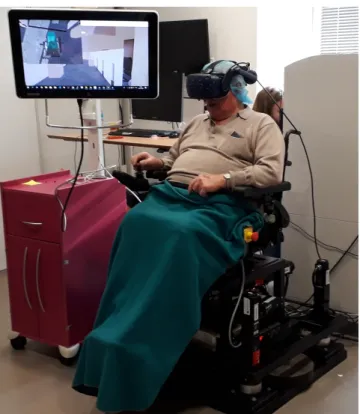
Figure 1: VR setup with our power wheelchair simulator. safe for the user. Moreover, a specific setup can easily be identically reproduced in order to standardize any tasks. These assets related to VR simulation induce interest from therapists as it could open-up new rehabilitative modalities for some patients who do not entirely benefit from to traditional rehabilitation programs.
In the case of power wheelchair navigation, VR simulation is investigated in many research projects. Indeed, several VR-based wheelchair simulators were designed in the past few years [2, 25]. These simulators have a plurality of purposes from dedicated algo-rithm testing to urban planning [10], but the majority of the proposed simulators aim to benefit from advantages of simulation flexibility, safety and reproducibility to provide an alternative training interface. The main challenge remains in building a consistent VR expe-rience for driving a wheelchair. Indeed, a good user Quality of Experience (QoE) requires the simulator to induce enough Sense Of Presence (SoP) [31]: the idea is to cease user conscious awareness thus allowing to consider VR experience as real life experience. In other terms the more the SoP, the more likely the user is to behave in a similar way to a real situation, the easier it is to transfer acquired skills when practicing in real-life in a similar environment [26].
Moreover, consistent, comfortable and efficient VR simulation also requires to reduce as much as possible Cybersickness effects induced by the motion in the virtual environment. Cybersickness is a type of motion sickness happening inside a VR experience and characterized by multiple discomforts from nausea to malaise. Although it has been recognized and studied for a longtime, Cybersickness cause is still debated [4]. One of the most supported theory is the Sensory Conflicts theory i.e cognitive mismatches especially between what user sees in the simulation and what user feels through its vestibu-lar system and proprioceptors [17]. Therefore, evaluating levels of Cybersickness and SoP is a key step of such a VR-based simulator design and assessment. It is also important to draw guidelines for future use in a rehabilitation context.
In our work, we proposed a VR-based power wheelchair simulator shown in Figure 1 for driving training purpose dedicated to first-time users with severe impairments [34]. The particularity of our simulator design is its motion platform that stimulates synchronously the user vestibular system, proprioceptors and the visual stimulus by generating consistent acceleration and deceleration with respect to user visuo-spatial information. In a previous study involving able-bodied participants [33], we demonstrated that SoP is improved by the use of a dedicated user vestibular system stimulation. However, this study did not integrate a consistent training scenario.
In this paper, we then present an experiment carried out with 29 power wheelchair regular users. This clinical study was approved by the Research Ethics Committee. Users were asked to complete a consistent driving task designed by clinicians in two conditions. The first condition consists in driving in the virtual environment by using our simulator, and the second condition consists in driving in a real environment by using a standard power wheelchair. The objective of this study is to compare user performance in both conditions as well as to assess the impact of our simulator on user SoP and Cybersickness.
The paper is organized as follows: after reviewing literature in section 2, the clinical user study procedure is detailed in section 3. Then, results presented in section 4 allow us to compare real and virtual user performance as well as to evaluate the QoE provided by our simulator in terms of SoP and Cybersickness before drawing guidelines for future work in section 5.
2 RELATEDWORKS
VR based power wheelchair simulators have emerged all around the world with different purposes [2]. Many of them aim to provide an alternative training and rehabilitation interface for multiple tasks, as VR offers crucial advantages over real environment training. In [22], authors performed an experiment on the ViEW simulator in a rehabil-itation center with 12 young patients. Their objective was to evaluate acquired skills through a custom level progression. Their simulator consists in a virtual environment displayed on a computer screen in which the user can control a virtual wheelchair while sitting on a chair. Their results show skill transfer from virtual experience to reality even though the ViEW simulator is only screen based and does not include a motion platform with vestibular or proprioceptors stimuli. Also, authors reported that the use of the ViEW simula-tor stimulated participant’s interest. Moreover, in [19], a power wheelchair simulator was tested with young children without disabil-ity. They proved that a brief amount of time using projector screen is sufficient for young children to improve their wheelchair navigation skills. Similar results with a screen-based simulator are presented in [1]. These screen-based systems have the advantage of being simple and cost-effective. However, user head movements and field of view (FOV) are limited by screen size. These limitations could have a negative impact on visual information taking, in particular for some maneuvers that require the user to look around. Furthermore, screen display can limit skill transfer by limiting the SoP felt during the virtual experience.
SoP is usually defined as a subjective phenomenon designating the impression of existing in a virtual world, of ”being there” in the simulation [31]. In a rehabilitation context, SoP is associated with the amount of knowledge transfer from a VR experience to real daily-life scenario and VR is designated as the medium able to support and to generate the highest SoP [26]. The more the SoP, the more likely the user is to behave in a similar way to a real situation and thus be inspired by their previous VR experiences to tackle similar real life experiences. SoP can be separated into several criteria such as realism, interactions and the feeling of incarnation, each impacted by several material and sensory factors [28]. For example, authors show in [37] that SoP increases when multiplying sensory modalities. Indeed, a study with the screen-based miWe simulator reported a low SoP experienced and associated it with a lack of motion feedback and depth perception [32]. As such, various researches proposed more immersive systems, starting with the use of a VR headset as vi-sual interface to provide depth perception and immersive FOV [8, 9] and the addition of other modalities like vibration motion feedback provided by a 6 degree of freedom motion platform [12]. Several re-searches also compared the use of different simulator configurations like in [14] with the VRSIM-2 simulator where the most immersive configuration allows raters to better evaluate user skills. In [23], authors present a new version of their simulator including a screen with a larger FOV . This enhancement was motivated by a power wheelchair user gaze study and aimed to improve user exploration behavior realism, and thus SoP. Furthermore, authors also observed an improvement regarding VR induced discomforts also known as Cybersickness.
Cybersickness is a type of motion sickness manifested by various symptoms such as nausea, sweating, dizziness etc [17]. Cybersick-ness causes are still discussed [4]. The two main theories supported by the literature are the Postural instability [36] and Sensory Con-flicts [17]. The Sensory ConCon-flicts theory supports the idea that Cybersickness is induced by cognitive mismatches occurring dur-ing the VR experiment [24]. For example, the differences between what user sees and feels i.e. the motion visually perceived com-pared to the actual physical immobility, are well known sources of cognitive mismatches. Cybersickness is considered as one of the main obstacle to VR as it can drastically alter the user QoE to the point of making the virtual experience unbearable [21]. In [13], authors proved that training efficiency was significantly better while using a VR headset display rather than a screen. However, they also noted that this display caused Cybersickness symptoms for the majority of participants. While the nature of the relation between SoP and Cybersickness is still being debated in the VR research community [35,37], we can consider that, above a certain level, such discomforts can limit user concentration and propensity to learn.
In previous work, we presented an innovative VR-based power wheelchair simulator which design and control aim to maximize SoP while reducing Cybersickness effects [34]. Indeed, we proved that the motion platform included in our simulator enhances SoP and reduces Cybersickness by delivering haptic and vestibular feed-back based on the virtual wheelchair motion [33]. However, we never compared the experience provided simulator to a real experi-ence with a real power wheelchair. Moreover, despite the numerous research on VR-based power wheelchair simulators, we observed a lack of studies of every simulators aspects with actual power wheelchair regular users. Yet, power wheelchair regular users are experts when it comes to real power wheelchair experience. The presented study aims then to provide a first overview of user per-formance comparison within a power wheelchair navigation task between VR and real conditions as well as to evaluate the QoE provided by our simulator in terms of SoP and Cybersickness in a clinical context.
3 USERSTUDY
3.1 Objective and Hypotheses
In this user study, the participants were asked to navigate and com-plete 3 different circuits of increasing difficulty within two condi-tions namely in a virtual environment with our simulator and in real conditions with a real power wheelchair. The proposed circuits have been designed by clinicians and clinically validated. The main objec-tives of this user study are to compare user performances conditions and to evaluate the QoE provided by our simulator. As authorized by the Research Ethics Committee, we enrolled people with neurologi-cal degenerative disorders who are used to drive a power wheelchair. In total, three different circuits of increasing difficulties have been completed by each participants. For each circuit, the participant per-formance was measured by completion time and the QoE provided by our simulator was assessed using subjective questionnaires on SoP and Cybersickness as well as objective measures regarding user motion and behavior. In order for our simulator to be efficient within contexts of clinical training and rehabilitation, it needs to provide a comfortable user experience similar to a real one. As such, users should perform the same task in a similar way in both conditions and should feel high SoP and low Cybersickness levels within the virtual condition using our simulator. As such, our main prior hypothesis for this clinical study only concerned performance and was defined as
H In a power wheelchair navigation clinically validated task, regu-lar users perform in the same way in virtual condition using our simulator as if they were in real condition with a real power wheelchair.
3.2 Apparatus
In addition to the variant driving task, the study involved a specific setup for each condition, detailed in the following sections.
3.2.1 Driving task
In order to investigate user performances in different situations, the driving task was the completion of 3 circuits of increasing difficulty. Each circuit has been designed by clinicians, providing a number of maneuvers and dimensions adapted to its level of difficulty. For example, circuit 1 consists of a short sequence of maneuvers in a wide corridor while circuit 3 includes a ramp and a moving obstacle in its long sequence of maneuvers as well as tighter turns in narrower corridors. These same circuits have already been used in a clinical study presented in [18] with their structure further detailed. For the sake of this study, the 3 circuits were identically reproduced in VR before being reevaluated and validated by therapists in both conditions real and virtual.
3.2.2 Real condition
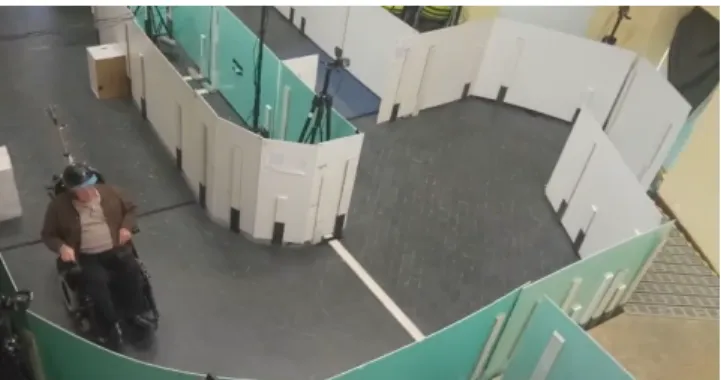
In the real condition, circuits were set up in a room at the rehabili-tation center that is usually used by clinicians for various training sessions. The circuits are made of light wooden panels that can move easily in case of collision. We used 2 Quickie Salsa M2 power wheelchairs. They were equipped with various sensors such as accelerometers and two different motion tracking systems i.e. Vicon and ULB allowing to record user head trajectory on the circuit as well as wheelchair trajectory, velocities and accelerations. The completion time was measured using manual chronometers. Par-ticipants QoE was assessed using the USE questionnaire with 30 questions grouped into 4 criteria and rated on a seven-point Likert rating scale [20]. Figure 2 illustrates the setup while one participant is performing circuit 3 in the real condition.
3.2.3 Virtual condition
To complete the task in the virtual condition, participants used our VR-based simulator presented in previous work [34]. This simu-lator is composed of a four degrees of freedom motion platform
Figure 2: Real setup with Quickie Salsa M2 power wheelchair.
that simulates a real power wheelchair behavior through accelera-tions rendering. Moreover, it was designed in collaboration with clinicians and can be adapted with any seat and control interfaces coming from a standard power wheelchair. Although the seat and control interface can be adapted for specific needs, they were the same for all participants of our study. In the virtual condition, we attached a seat and joystick from a Quickie Salsa M2 wheelchair. Participants wore an HTC Vive Pro VR headset which was cleaned and disinfected after each session. Regarding the virtual environ-ment, as previously stated, the room hosting the real circuits and the circuits themselves have been identically reproduced from real ones. The software nature of the simulator pipeline allowed us to record data such as user head trajectory and virtual wheelchair trajectory, velocities and accelerations. The QoE provided by our simulator was assessed through subjective questionnaires using the Simulator Sickness Questionnaire (SSQ) [15] and the Igroup Presence Ques-tionnaire (IPQ) [27]. Both quesQues-tionnaires are commonly used in literature. The IPQ is a 14 items questionnaire rated on a 7-point likert scale that subjectively measures SoP in terms of involvement, realism and spatial presence. The SSQ aims to evaluate Cybersick-ness symptoms level with 16 items rated on a scale from 0 to 3 and grouped into 3 main criteria namely nausea, occulomotor and disorientation. Furthermore, we evaluated Cybersickness participant susceptibility using the Motion Sickness Susceptibility Question-naire (MSSQ) [7]. The MSSQ contains 9 questions rated on a scale of 0 to 3 that tries to detect people who are more likely to experience discomforts during a VR experience. The completion time was also measured using manual chronometers and the participants QoE was also assessed using the USE questionnaire. Figure 1 illustrates the virtual setup while one participant is performing circuit 3.
3.3 Procedure
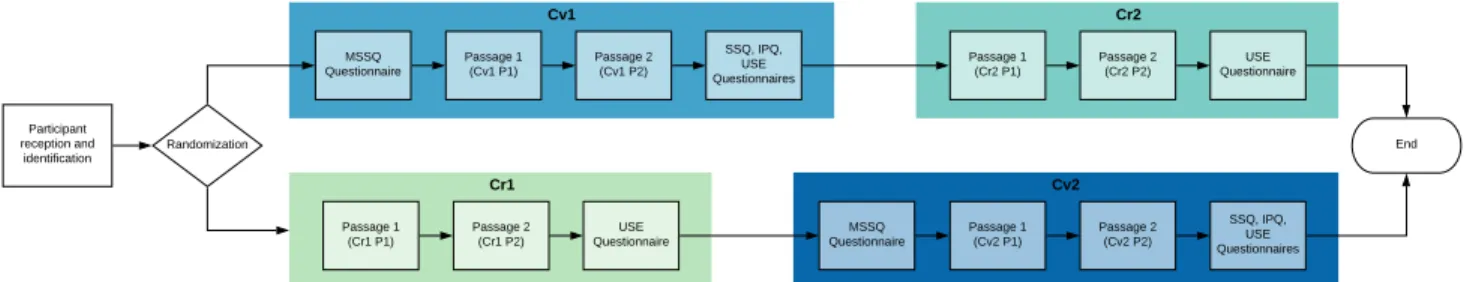
The entire study lasted 3 weeks at a rate of 2 days per week. In total, the 3 different circuits with increasing difficulties have been com-pleted 2 times in both virtual and real conditions. All circuits were reproduced identically in both conditions as shown in Figure 4 and Figure 5. The condition by which each participant started, between virtual and real, was randomized. As such, half of the participants started with the virtual condition using our simulator and the other half with the real condition using a real power wheelchair. In total we considered 4 different configurations Cv1, Cv2, Cr1and Cr2with the condition nature indicated by v for virtual and r for real and the digit to designate the order, either starting condition 1 or second condition 2. Note that every participant will only complete 2 con-figurations, either Cv1and Cr2or Cr1and Cv2. After each condition, real or virtual, participants filled in the USE Questionnaire. Study procedure is summarized in the Figure 3 flowchart. Finally, each condition had its own explanatory procedure, setup and equipment which are detailed in the following sections.
Participant reception and identification Randomization Passage 1 (Cv1 P1) Cv1 Passage 2 (Cv1 P2) MSSQ Questionnaire SSQ, IPQ, USE Questionnaires Passage 1 (Cr2 P1) Cr2 Passage 2 (Cr2 P2) USE Questionnaire End Passage 1 (Cv2 P1) Cv2 Passage 2 (Cv2 P2) MSSQ Questionnaire SSQ, IPQ, USE Questionnaires Passage 1 (Cr1 P1) Cr1 Passage 2 (Cr1 P2) USE Questionnaire
Figure 3: Flowchart of user study procedure. Each configuration of condition nature and order has its own color.
3.3.1 Real condition
In the real condition, the participants were first welcomed by at least 2 clinicians and 2 members of the research team who stayed throughout the session and who initially helped them adapt the power wheelchair seating to their specific needs. After settling comfortably, the participants navigated using the equipped power wheelchair in a room without circuit. Once the participants are accustomed to the equipped power wheelchair control, they were taken to the experimentation room where the task was explained to them. Then, the participants completed the circuit twice with a little break between both passages if needed.
Figure 4: Real circuit number 3 designed by clinicians.
Figure 5: Virtual circuit number 3 designed by clinicians.
3.3.2 Virtual condition
Before starting the virtual task, the participants had to complete the MSSQ as well as a small checklist to ensure they were in their usual state of fitness. The MSSQ contains 9 questions rated on a scale of 0 to 3 that tries to detect people who are more likely to experience discomforts during a VR experience. Then, clinicians adapted the simulator motion platform seating to the participants needs. After-wards, the task was explained to them just after a recognition time during which the participants navigate inside the virtual room with-out circuit in order to get accustomed to the VR setup and to allow clinicians to make the final adjustments. Once ready, participants completed the circuit twice with a little break between each passage
if needed. The participants were free to stop the experiment at any time. They were told to report any excessive discomfort and that an emergency stop button attached on the simulator was available at any moment. At all times, the participants were supervised and accompanied by at least one clinician and one member of the re-search team. The simulator parameters were exactly the same for every participant. During passages, silence was maintained in the room as much as possible to avoid distracting the participant. After both passages were completed, participants completed the subjective SSQ and IPQ questionnaires.
3.4 Participants
Conducting a study with people with disabilities is a challenge that is rarely overcome. In total 29 participants were screened by clini-cians to take part in this study. According to the inclusion criteria, participants have neurological degenerative disorders, physical char-acteristics (weight, size) compatible with the use of our simulator, benefit from a powered wheelchair prescription and used it for more than 3 months as their main means of locomotion. Thus, as power wheelchair regular users, they are the best able to complete the navi-gation task and evaluate our simulator provided QoE. Moreover, all participants were naive or novice to VR.
4 RESULTS ANDANALYSIS
We have selected the most relevant results for each aspects of this study and virtual experience i.e. the performance, the SoP and the Cybersickness. Furthermore, depending on the circuit and passage conditions, some participant data were discarded from final analysis. Thus, only 13 participants data remain for circuit 1, 28 for circuit 2 and 25 for circuit 3. Regarding the small number of participants selected for circuit 1 and its structural simplicity, we decided to exclude it from the study. Indeed, circuit 1 analysed data, in ad-dition to poorly differentiate participants, are too sparse to lead to significative and interpretable results.
Circuit 2 Circuit 3
Cr1vs Cv1 Cr1< Cv1 Cr1! < Cv1
Wilcoxon Rank Sum less test 3.3e-2 5.7e-2
Cr2vs Cv2 Cr2! 6= Cv2 Cr2! 6= Cv2
Kruskal-Wallis test 0.515 0.624
P1vs P2, virtual P1> P2 P1> P2
Wilcoxon Signed Rank paired test 1.3e-05 2.5e-4
P1vs P2, real P1! 6= P2 P1! 6= P2
Wilcoxon Signed Rank paired test 0.15 0.3
Table 1: Results of the different statistical tests performed. Symbols represent test hypothesis result with ! when test null hypothesis was rejected. For each test, the p-value is reported under each hypothesis.
T im e (i n s e c o n d s ) 80 100 120 140 160 180 200 220 240 Condition Cr1 Cv1
(a) First Condition Cr1vs Cv1
T im e (i n s e c o n d s ) 80 100 120 140 160 180 200 220 240 Condition Cr2 Cv2 (b) Second Condition Cr2vs Cv2
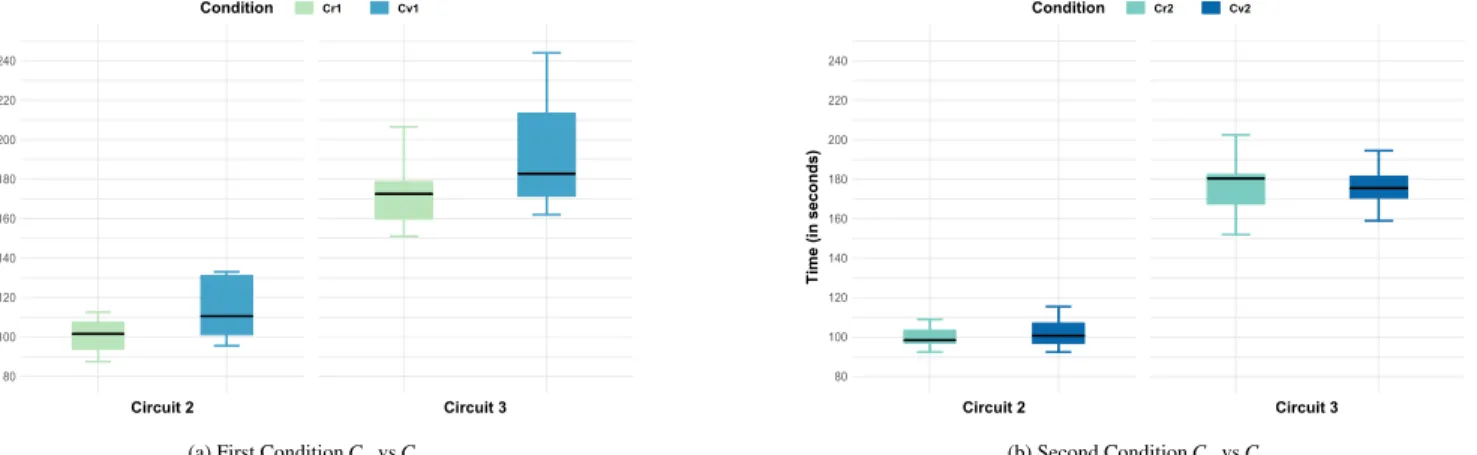
Figure 6: Mean circuit completion time for first condition (Cr1vs Cv1) and second condition (Cr2vs Cv2). Each configuration color correspond to procedure flowchart colors in Figure 3.
T im e (i n s e c o n d s ) 140 250 230 210 190 170 150 120 100 80 Passage Number 1 2
Figure 7: Circuit completion time in virtual condition Cv(Cv1∪ Cv2)
between first and second passage P1and P2
T im e (i n s e c o n d s ) 140 250 230 210 190 170 150 120 100 80 Passage Number 1 2
Figure 8: Time to complete circuit in real condition between first
and second passage P1and P2
4.1 Performance
First of all, we present the comparison results of performance in terms of completion time between real and virtual conditions. To avoid any training bias, we decided to sort the data by configura-tions, depending on its execution order. Indeed, after completing the task in the first condition, participants could have learned the circuit structure and performed accordingly in the second condi-tion. Sorting data by configuration and comparing only firstly and secondly executed conditions together allows us to eliminate any training bias if it exists. As such, Figure 6 shows the circuit mean
completion times observed for configurations Cv1 and Cr1 firstly
performed and for configurations Cv2and Cr2secondly performed.
On one hand, the Wilcoxon Rank Sum test (Table 1) reveals a signif-icant difference in participant performance according to the nature of the condition they start for circuit 2. Tackling a navigation task through VR for the first time with our simulator seems to be more difficult and leads to higher completion times. Indeed, completion time mean within Cv1is significantly higher which is visible in Fig-ure 6a. However, it exist no result nor interpretation for circuit 3 as data are not sufficient and differentiating enough to obtain sig-nificant results. On the other hand, the Kruskal-Wallis test (Table 1) statistically proves the significant similarity in mean completion time distribution for both circuits when performing the task in the second condition, whether real or virtual. This results are easily visible in their box plot representation in Figure 6b. Parametric tests could not be used as the time distribution in real condition was found to be non-normal using Shapiro-Wilk test. Kruskal-Wallis results show that participants performed similarly under both conditions in terms of completion time thus validating our hypothesis H. In order to evaluate a potential learning bias between the first and second passage in both virtual and real conditions, we performed paired analyses of completion times. By comparing results, we can visually observe in Figure 7 that the second passage completion times are generally lower than the first passage ones in the virtual condition whereas this completion times difference is less pronounced in the real condition as shown in Figure 8. This greater difference for the virtual condition was demonstrated using a Wilcoxon Signed Rank test on paired samples (Table 1) and shows a greater learning margin in this condition. This adaptation time and novelty aspect of VR might also explain the small difference in USE Questionnaire scores between both conditions as shown in Figure 9.
4.2 QoE
4.2.1 Cybersickness
Regarding Cybersickness, SSQ scores have been calculated using the SSQ reference paper guidelines and reported in Table 2. Based on the detailed SSQ Total Severity scores, no participant experienced severe Cybersickness and only one has a score above the moderate step value. Although the scores for each criterion are below their re-spective averages and correspond for the majority, in the worst-case, to discomforts deemed ”moderate”, the Total Severity score remains high when compared to literature. Authors in [3] report 2 studies with a Total Severity SSQ scores of 21.84 and 27.25 that resulted in a dropout rate of 23.23% and 71.43% respectively. According to our scores, our simulator dropout rate should lie somewhere between these two rates which are both too high to consider the frequent use
Figure 9: USE score means and standard deviations by criterion. Circuit 2 Circuit 3 Nausea 13.63 (16.3) 20.61 (25.49) Occulomotor 20.84 (22.84) 20.62 (22.48) Disorientation 17.9 (25.09) 27.28 (34.69) Total Severity 20.44 (22.45) 25.58 (25.52)
Table 2: SSQ Scores. Mean and (Standard Deviation)
Circuit 2 Circuit 3
Occulomotor 16.96 (16.89) 14.67 (15.83)
Disorientation 6.43 (10.02) 9.07 (15.4)
Total Severity 11.7 (12.58) 11.87 (13.56)
Table 3: VRSQ Scores. Mean and (Standard Deviation) SSQ scores remain low and are clearly lower than some other power wheelchair VR-based simulator SSQ ones such as in [13].
Furthermore, it is important to note that the SSQ rating scale is not entirely relevant in studies involving a non-trained population since this scale is based on studies with military personnel. An alternative way of assessing Cybersickness, based on the same questions and answers as the SSQ, has recently been proposed: the Virtual Reality Simulator Questionnaire (VRSQ) [16]. After being compared to the SSQ and its variants, this new rating scale proved to be more accurate and more relevant in particular with VR headsets as display interface [29]. The VRSQ score scales also have the advantage of being equivalent for each criterion, ranging from 0 to 100. In order to evaluate our simulator more precisely, VRSQ scores are shown in Table 3. Note that the change of scale between SSQ and VRSQ does not impact the level of discomfort felt during VR experiences but allows a more precise evaluation of Cybersickness especially when using a VR headset. For example, based on the detailed VRSQ Total Severity scores, 3 participants experienced moderate Cybersickness and no one experienced severe Cybersickness.
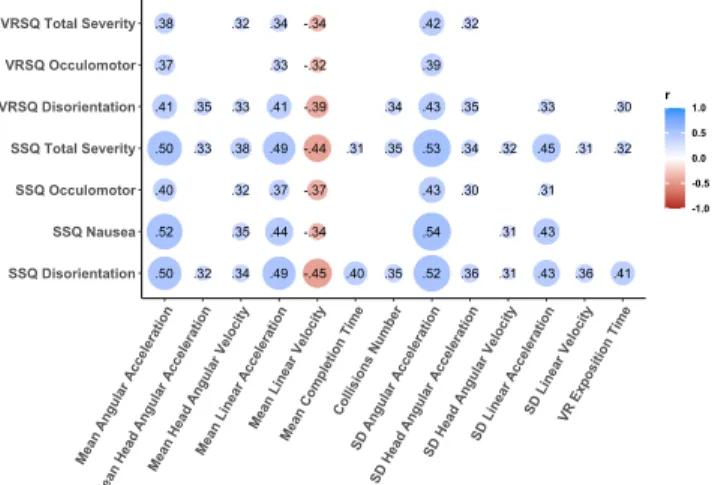
To further investigate Cybersickness causes, we tried to determine factors influencing SSQ and VRSQ scores among different measures such as power wheelchair and user head accelerations and velocities. Figure 10 exposes significant Spearman correlation tests results with a correlation coefficient greater than 0.3. Significant factors are represented on x axis and criterion on the y axis. Each disc is colored regarding the positive or negative nature of the correlation and its size varies according to the correlation coefficient value reported inside it. Every correlation displayed in Figure 10 are significant and are consistent with factors identified in the literature [17, 21, 35].
Figure 10: SSQ and VRSQ correlated factors. Factors are reported on x axis. SD stands for Standard Deviation. Each value inside a disc represents the correlation coefficient r. The color indicates positive (blue) or negative (red) correlation.
4.2.2 Sense of Presence
Finally, IPQ scores have been reported in Figure 11 and estimate our simulator performance in terms of SoP for this study. From Figure 11, we notice a great score for General Presence and Spatial Presence. Only the Involvement score is slightly under the average. Compared to literature, our simulator presents great IPQ scores, largely higher than the screen based simulator miWe [32] but still a little lower than scores reported by the two studies using the
SimCadRoMsimulator [8, 9].
Figure 11: IPQ score means and standard deviations by criterion
i.e.General Presence (GP), Involvement (Inv), Realism (Real) and
Spatial Presence (SP).
5 DISCUSSION
5.1 Overall Study
Overall, the study presents interesting results and represents one of the first real and virtual comparative study in a clinical context. Moreover, conducting a study with wheelchair regular users in a technological research field is a challenge rarely overcome. Yet, it was a mandatory step in the development of a user-centered simu-lator. The challenge of designing such a VR experience for people with disabilities, in particular with neurological disorders, is that they can be more sensitive to discomforts such as Cybersickness because of potential visual, visuo-spatial or cognitive impairments.
In fact, the majority of data disposal was due to faulty equipment or disruptive elements during passages such as loud sounds or soft-ware bugs. In the end, the main hypothesis H is validated based on performance comparison results shown in Figure 6. Indeed, the completion time distribution is similar in both the virtual and real conditions for secondly performed condition (Figure 6b). While performance differences in the first condition is only statistically significative for circuit 2, and no conclusion can be drawn without additional data for circuit 3. This observed difference can be ex-plained by the novelty of VR which can be a difficult technology to apprehend at first for beginners (Figure 6a). In fact, the participants first and second passages comparison under each condition shown in Figure 7 and Figure 8 reveals a greater learning margin in the virtual condition which supports the idea that VR requires an adaptation time. Furthermore, those performance results also show, in a limited measure, that a learning process has happened in a similar way under both conditions. Nonetheless, a more precise performance criterion than completion time could be used to further compare both virtual and real power wheelchair navigation. For example, performances could be assessed using the Power Mobility Road Test as in [14]. Also note that the reliability of subjective data, such as question-naire responses, can always be questioned. Objective measures such as skin conductance level for Cybersickness could also have been collected using systems like in [21]. However, such physiological measures would have required additional sensors considered too much disruptive for the participants by therapists and therefore not foreseen in the protocol approved by the Research Ethics Commit-tee. Finally, according to the USE Questionnaire scores reported in Figure 9 and oral feedback, participants were thrilled about the study, the simulator and the QoE. This study main limitation is the performance evaluation based only on completion time while other criterion could have been analysed such as power wheelchair and joystick trajectory. Comparative investigations including those crite-rion are planned, focusing on user behavior and consequences rather than only time performance.
5.2 Sense of Presence
Focusing on SoP, despite a high level of general presence, we notice an average level of involvement criterion. One way of improving this score would be to enhance the virtual environment by adding effects such as ambient sounds or by populating the virtual environment. An other improvement of the QoE would be limiting the external disturbances during the experiment, in particular the noises emitted by the motion platform itself [25]. Indeed, the involvement presence criterion is directly linked to the user susceptibility to forget the real world and concentrate on the virtual goal. Finally, although the relationship between SoP and Cybersickness is debated in the literature, it is conceivable that the discomforts felt by users have had a negative impact on this criterion, preventing them from com-pletely detaching themselves from the real world [37]. However, this theory could not be verified through statistical tests on the SoP and Cybersickness link, as related results were not significant.
5.3 Cybersickness
Regarding Cybersickness, results from both SSQ and VRSQ are more nuanced as the majority of participants still felt slight to mod-erate discomforts even though they were able to finish the tasks. While these discomforts could be explained by participants by self-induced Cybersickness [29], they are still too present to plan long sessions on our simulator.
One solution to enable the use of our simulator in its actual state in a clinical context would be to detect in advance or in real time people likely to feel too much discomfort. Detecting motion sickness susceptibility is the purpose of the MSSQ that has been fulfilled by each participant before performing the task in the virtual condition. However we did not report MSSQ results since even though, on
average, people with a higher MSSQ score have a higher SSQ score there is no statistically measurable cut-off value for the MSSQ score. Further studies focusing on the MSSQ and SSQ within this particular clinical context should be conducted to be able to precisely detect which person will not stand the VR experiment provided it is statistically validated. Otherwise, other tools or models to detect susceptibility or dropout could be considered such as the prediction dropout formula proposed in [3] or washout algorithms proposed in [4].
Regarding the potential Cybersickness causes, Figure 10 shows various leads to explore to reduce discomforts. For example, as the positive correlation between angular accelerations and Cybersick-ness suggests, we could diminish the maximal accelerations value or modify the motion platform cues. Nonetheless, some identified factors would require further investigation for the correlation to be fully understood. For example, the observable negative correlation between velocities and Cybersickness scores could be explained by the fact that higher velocities reduce completion time [35]. How-ever, in that case, similar correlations should also be observable when considering exposition time which is not what results suggest. Other techniques to reduce Cybersickness presented in the literature could be integrated into the simulator such as including more static reference points [38]. It is also possible to imagine shorter tasks with more progressive difficulty increase to allow more comfort-able and shorter learning sessions. Finally, as Cybersickness seems closely linked to the display interface, VR headsets will be compared to other display interfaces in future work to determine which one provokes less Cybersickness with our simulator.
6 CONCLUSION
In this paper we presented a study with regular power wheelchair users consisting in the completion of a clinically validated task with both our wheelchair simulator and a standard power wheelchair. The objective of this study was to compare user performance between both real and virtual conditions, as well as evaluate the QoE provided by the simulator in terms of SoP and Cybersickness. Conducting a study with regular users was a mandatory and challenging step in the development of a user-centered simulator. Overall, we proved that regular users are able to perform a clinically validated task in a similar way regarding the completion time, both with a VR based power wheelchair simulator and a real power wheelchair. We also assessed high levels of SoP through the IPQ resulting in a valuable QoE even though some improvements could be made to enhance the level of the SoP involvement criteria. If Cybersickness levels were also found to be high when compared to the literature, the investiga-tion on factors and related works allowed us to draw guidelines for future work in order to improve the simulator acceptability within a clinical context. However, we could already consider our simu-lator in other contexts such as algorithm testing or urban planning which require less VR exposition time to be effective. Finally, this study was the first clinical study in which people with disabilities and therefore end-users were able to use our simulator in a targeted context. All the participants feedback regarding the simulator and overall study was positive which is promising for the future.
ACKNOWLEDGMENTS
This work is carried out as part of the INTERREG VA FMA ADAPT project funded by the European Regional Development Fund (ERDF), and is partially funded by the Crowdbot Project, a European Union Horizon 2020 Project.
REFERENCES
[1] I. A. Adelola, S. L. Cox, and A. Rahman. Virtual environments for powered wheelchair learner drivers: Case studies. Technology and Disability, 21(3):97–106, 2009.
[2] S. Arlati, V. Colombo, G. Ferrigno, R. Sacchetti, and M. Sacco. Vir-tual reality-based wheelchair simulators: A scoping review. Assistive Technology, pages 1–12, 2019.
[3] S. A. Balk, M. A. Bertola, and V. W. Inman. Simulator Sickness Questionnaire: Twenty Years Later. In Driving Assessment Conference, 2013.
[4] Baris Aykent, Damien Paillot, Fr´ed´eric M´erienne, Zhou Fang, and Andras Kemeny. Study Of The Influence Of Different Washout Al-gorithms On Simulator Sickness For A Driving Simulation Task. In World Conference on Innovative Virtual Reality, pages 331–341, 2011. [5] C. Basdogan, M. Sedef, M. Harders, and S. Wesarg. Simulators for Training in Minimally Invasive Surgery. In IEEE Computer Graphics And Applications, pages 54–66. IEEE, 2007.
[6] T. R. Coles, D. Meglan, and N. W. John. The Role of Haptics in Medical Training. 4(1):51–66, 2011.
[7] J. F. Golding. Predicting individual differences in motion sickness susceptibility by questionnaire. Personality and Individual Differences, 41(2):237–248, 2006.
[8] K. A. Hernandez-Ossa, E. H. Montenegro-Couto, B. Longo, A. Bis-soli, M. M. Sime, H. M. Lessa, I. R. Enriquez, A. Frizera-Neto, and T. Bastos-Filho. Simulation system of electric-powered wheelchairs for training purposes. Sensors, 20(12):1–23, 2020.
[9] K. A. Hernandez-Ossa, E. H. Montenegro-Couto, B. Longo, A. Frizera-Neto, and T. Bastos-Filho. Virtual Reality Simulator for Electric Pow-ered Wheelchairs using a Joystick. In XXVI Brazilian Congress on Biomedical Engineering, pages 729–736. Springer, Singapore, 2019. [10] M. Herrlich, R. Meyer, R. Malaka, and H. Heck. Development of a
virtual electric wheelchair - Simulation and assessment of physical fidelity using the unreal engine 3. In International Conference on Entertainment Computing, pages 286–293. Springer, Berlin Heidelberg, 2010.
[11] M. C. Howard. A meta-analysis and systematic literature review of virtual reality rehabilitation programs. Computers in Human Behavior, 70:317–327, 2017.
[12] T. Ito, M. Shino, T. Inoue, and M. Kamata. Development of a Pow-ered Wheelchair Driving Simulator for Research and Development Use. Journal of Mechanical Systems for Transportation and Logistics, 2(2):90–101, 2009.
[13] N. W. John, S. R. Pop, T. W. Day, P. D. Ritsos, and C. J. Headleand. The Implementation and Validation of a Virtual Environment for Training Powered Wheelchair Manoeuvres. IEEE Transactions on Visualization and Computer Graphics, 24(5):1867–1878, 2017.
[14] D. C. Kamaraj, B. E. Dicianno, H. P. Mahajan, A. M. Buhari, and R. A. Cooper. Interrater Reliability of the Power Mobility Road Test in the Virtual Reality-Based Simulator-2. Archives of Physical Medicine and Rehabilitation, 97(7):1078–1084, 2016.
[15] R. S. Kennedy, N. E. Lane, K. S. Berbaum, and M. G. Lilienthal. Sim-ulator Sickness Questionnaire : An Enhanced Method for Quantifying Simulator Sickness. The International Journal of Aviation Psychology, 3(3):203–220, 1993.
[16] H. K. Kim, J. Park, Y. Choi, and M. Choe. Virtual reality sickness questionnaire (VRSQ): Motion sickness measurement index in a virtual reality environment. Applied Ergonomics, 69:66–73, 2018.
[17] J. J. LaViola. A Discussion of Cybersickness in Virtual Environments. ACM Sigchi Bulletin, 32(1):47–56, 2000.
[18] E. Leblong and L. Devigne. Swadapt1 : Assessment of an Elec-tric Wheelchair- driving Robotic Module in Standarized Circuits : A Prospective , Controlled , and Randomized Pilot Study. In Annual Meet-ing and International Society of Physical & Rehabilitation Medicine World Congress (ISPRM), 2020.
[19] M. A. Linden, C. Whyatt, C. Craig, and C. Kerr. Efficacy of a pow-ered wheelchair simulator for school aged children: A randomized controlled trial. Rehabilitation Psychology, 58(4):405–411, 2013. [20] A. M. Lund. Measuring usability with the USE questionnaire. Usability
interface, 8(2):3–6, 2001.
[21] A. Mazloumi Gavgani, D. M. Hodgson, and E. Nalivaiko. Effects of visual flow direction on signs and symptoms of cybersickness. PLoS ONE, 12(8), 2017.
[22] Y. Morere, G. Bourhis, K. Cosnuau, G. Guilmois, E. Rumilly, and E. Blangy. ViEW, a wheelchair simulator for driving analysis. In
Assistive Technology, pages 1–11. Taylor & Francis, 2018.
[23] H. Niniss and T. Inoue. Electric wheelchair simulator for rehabilitation of persons with motor disability. In Symposium on Virtual Reality VIII, 2006.
[24] S. Palmisano, R. Mursic, and J. Kim. Vection and cybersickness generated by head-and-display motion in the Oculus Rift. Displays, 46:1–8, 2017.
[25] T. Pithon, T. Weiss, S. Richir, and E. Klinger. Wheelchair simulators: A review. Technology and Disability, 21(1-2):1–10, 2009.
[26] G. Riva, F. Mantovani, and A. Gaggioli. Presence and rehabilitation: Toward second-generation virtual reality applications in neuropsychol-ogy. Journal of NeuroEngineering and Rehabilitation, 1(1):1–9, 2004. [27] T. W. Schubert. The sense of presence in virtual environments: A three-component scale measuring spatial presence, involvement, and realness. Z. f¨ur Medienpsychologie, 15(2):69–71, 2003.
[28] J. C. Servotte, M. Goosse, S. H. Campbell, N. Dardenne, B. Pilote, I. L. Simoneau, M. Guillaume, I. Bragard, and A. Ghuysen. Virtual Reality Experience: Immersion, Sense of Presence, and Cybersickness. Clinical Simulation in Nursing, 38:35–43, 2020.
[29] V. Sevinc and M. I. Berkman. Psychometric evaluation of Simulator Sickness Questionnaire and its variants as a measure of cybersickness in consumer virtual environments. Applied Ergonomics, 82, 2020. [30] N. E. Seymour, A. G. Gallagher, S. A. Roman, M. K. O’Brien, V. K.
Bansal, D. K. Andersen, and R. M. Satava. Virtual reality training improves operating room performance results of a randomized, double-blinded study. Annals of Surgery, 236(4):458–464, 2002.
[31] M. Slater and S. Wilbur. A framework for immersive virtual ments (FIVE): Speculations on the role of presence in virtual environ-ments. Presence: Teleoperators & Virtual Environments, 6(6):603–616, 1997.
[32] G. Tao and P. S. Archambault. Powered wheelchair simulator devel-opment: Implementing combined navigation-reaching tasks with a 3D hand motion controller. Journal of NeuroEngineering and Rehabilita-tion, 13(3), 2016.
[33] G. Vailland, Y. Gaffary, L. Devigne, V. Gouranton, B. Arnaldi, and M. Babel. Vestibular feedback on a virtual reality wheelchair driving simulator: A pilot study. In ACM/IEEE International Conference on Human-Robot Interaction, pages 171–179, 2020.
[34] G. Vailland, F. Grzeskowiak, L. Devigne, Y. Gaffary, B. Fraudet, E. Leb-long, F. Nouviale, F. Pasteau, R. Le Breton, S. Guegan, B. Fraudet, F. Nouviale, B. Arnaldi, and M. Babel. User-centered design of a multisensory power wheelchair simulator : towards training and reha-bilitation applications. In International Conference on Rehareha-bilitation Robotics (ICORR), pages 77–82, 2019.
[35] R. Venkatakrishnan, R. Venkatakrishnan, R. G. Anaraky, M. Volonte, B. Knijnenburg, and S. V. Babu. A Structural Equation Modeling Approach to Understand the Relationship between Control , Cybersick-ness and Presence in Virtual Reality. In IEEE Conference on Virtual Reality and 3D User Interfaces (VR), pages 682–691, 2020. [36] Y. Wang, J. R. Chardonnet, and F. Merienne. VR sickness prediction
for navigation in immersive virtual environments using a deep long short term memory model. In IEEE Conference on Virtual Reality and 3D User Interfaces (VR), pages 1874–1881. IEEE, 2019.
[37] S. Weech, S. Kenny, and M. Barnett-Cowan. Presence and cybersick-ness in virtual reality are negatively related: A review. Frontiers in Psychology, 10(158), 2019.
[38] D. M. Whittinghill, B. Ziegler, T. Case, and B. Moore. Nasum virtu-alis: A simple technique for reducing simulator sickness. In Games Developers Conference (GDC), page 74, 2015.