HAL Id: hal-03012675
https://hal.archives-ouvertes.fr/hal-03012675
Submitted on 24 Nov 2020HAL is a multi-disciplinary open access archive for the deposit and dissemination of sci-entific research documents, whether they are pub-lished or not. The documents may come from teaching and research institutions in France or abroad, or from public or private research centers.
L’archive ouverte pluridisciplinaire HAL, est destinée au dépôt et à la diffusion de documents scientifiques de niveau recherche, publiés ou non, émanant des établissements d’enseignement et de recherche français ou étrangers, des laboratoires publics ou privés.
Modeling of microbial kinetics and mass transfer in
bioreactors simulating the natural attenuation of arsenic
and iron in acid mine drainage
Maria Garcia-Rios, Laurent de Windt, Linda Luquot, Corinne Casiot
To cite this version:
Maria Garcia-Rios, Laurent de Windt, Linda Luquot, Corinne Casiot. Modeling of micro-bial kinetics and mass transfer in bioreactors simulating the natural attenuation of arsenic and iron in acid mine drainage. Journal of Hazardous Materials, Elsevier, 2020, 405, pp.124133. �10.1016/j.jhazmat.2020.124133�. �hal-03012675�
Modeling of microbial kinetics and mass transfer in bioreactors simulating
1the natural attenuation of arsenic and iron in acid mine drainage
23
Maria Garcia-Rios
a, Laurent De Windt
b, Linda Luquot
c, Corinne Casiot
a,*4
a HydroSciences Montpellier, University of Montpellier-CNRS-IRD, Montpellier (France) 5
b Centre de Geosciences, MINES ParisTech, PSL University, Fontainebleau (France) 6
c Géosciences Montpellier, Université Montpellier, CNRS, Montpellier (France) 7
* Corresponding author:
corinne.casiot-marouani@umontpellier.fr
.
8
Address : Université de Montpellier, HydroSciences - CC57, 163 rue Auguste Broussonnet,
9
34090 Montpellier, France. Telephone : +33(0)467143356 ; fax : +33(0)467144774
10 11
Abstract.
12Natural attenuation in acid mine drainage (AMD) due to biological iron and arsenic oxidation offers a 13
promising strategy to treat As-rich AMD in passive bioreactors. A reactive transport model was 14
developed in order to identify the main controlling factors. It simulated batch and flow-through 15
experiments that reproduced natural attenuation in a high-As AMD. The 2-D model coupled second-16
order microbial kinetics (Fe- and As- oxidation) and geochemical reactions to hydrodynamic transport. 17
Oxidation only occurred in the biofilm with an oxygen transfer from the air through water column. The 18
model correctly simulated the Fe(II)-Fe(III) and As(III)-As(V) concentrations in the outlet waters and 19
the precipitates, over hydraulic retention times from 50 min to 800 min. It confirmed that the natural 20
attenuation at 20 °C was driven by the fast Fe(II) oxidation and slow As(III) oxidation that favored 21
arsenite trapping by schwertmannite over amorphous ferric arsenate (AFA) formation. The localization 22
of iron oxidation in the biofilm limited the attenuation of arsenic and iron as the water column height 23
increased. The change in the composition of the bacterial iron-oxidizer community of the biofilm at the 24
lowest pH boundary seems to control the Fe(II) oxidation kinetic rate besides the bacterial concentration. 25
26
Keywords.
AMD, bioremediation, iron-oxidizing bacteria, HYTEC, reactive transport modeling. 27Highlights.
28 A reactive transport model for passive bioremediation of high-As acid mine drainage. 29
The 2-D model captures the oxygen transfer through water to the reactive biofilm. 30
Rate laws were obtained for microbial oxidation of Fe(II) and As(III) at different pH. 31
Schwertmannite precipitation plays a key role on pH decrease and arsenite scavenging. 32
Composition of the iron-oxidizing bacterial community controlled Fe(II) oxidation rate. 33
1. Introduction
34Acid Mine Drainage (AMD) is one of the worst environmental hazards associated with post-mining. 35
These acid leachates (pH 2 – 4) originate from the oxidation of sulfide minerals in mine tailings and 36
waste piles. The phenomenon lasts hundreds of years after mine closure. It affects surface waters over 37
long distances downstream from mining sites and it may compromise the safe use of freshwater 38
resources. AMD contains iron and sulphate at concentration in the g L-1 range and toxic trace metals and 39
metalloids among which arsenic is of great concern due to its toxicity. Arsenic is ubiquitous in AMD, 40
with concentrations ranging from tens of µg L-1 to hundreds of mg L-1 (Williams, 2001; Cheng et al.,
41
2009). It is essential to develop remediation strategies able to assure long-term treatment of As-rich 42
AMD with high performances and low maintenance cost. Passive treatment technologies based on 43
natural attenuation processes are well suited to this scope (e.g. Johnson and Hallberg, 2005). 44
Microbial natural attenuation of arsenic has been described in many AMD worldwide (e.g. Cheng
45
et al. 2009; Paikaray, 2015). It involves bacterial-mediated oxidation of aqueous ferrous species (Fe(II))
46
by oxygen into poorly soluble ferric (Fe(III)) phases. Bacterial oxidation of aqueous arsenite (As(III)) 47
to arsenate (As(V)) also occurs in AMD and was shown to improve As retention efficiency (Maillot et
48
al., 2013). The Fe-As solids include amorphous ferric arsenite and arsenate phases (Drahota et al., 2009;
49
Maillot et al., 2013), As(III)- and As(V)-coprecipitated or adsorbed schwertmannite (Regenspurg et al.,
50
2005; Paikaray et al., 2012; Maillot et al., 2013), crystallized scorodite (Langmuir et al, 2006) and 51
tooeleite (Egal et al., 2009; Chai et al., 2016). The microbial oxidation rates of As and Fe in AMD 52
streams are maximized by oxygen transfer (Savić et al., 1998; Sanchez-España et al., 2007; Chen and 53
Jiang, 2012) and sheet-like flow in thin films (Gouin et al., 2013; Fernandez-Rojo et al., 2017).
54
All these processes can be exploited in passive engineered systems to treat As-rich AMD. Several 55
field pilot-scale tests were conducted for the development of a first-step AMD treatment targeting 56
arsenic and iron (Ahoranta et al., 2016; Fernandez-Rojo et al., 2019). The treatment conditions and 57
system designs were usually not optimized, which led to variable and unpredictable efficiencies. The 58
sizing and design of passive treatment systems requires the developments of numerical models able to 59
represent the multiple coupled chemical and physical processes (e.g. Mayer et al., 2006; Indraratna et
60
al., 2014). 61
Kinetic rate models were developed to describe microbial oxidation of ferrous iron in AMD, which 62
is the key process at the base of natural arsenic attenuation. These microbial rate laws were obtained 63
from lab results of batch and flow-through bioreactors (Pesic et al., 1989; Diz and Novak, 1999; Sheng
64
et al., 2017; Yavari et al., 2019) or from in situ field ponds treating AMD from coal mines (Kirby et al.,
65
1999). However, these studies did not explicitly consider neither the transport processes nor the sorption 66
and coprecipitation of arsenic. Reactive transport models were developed to reproduce iron precipitation 67
and partition of metal ions between solid and aqueous phases during neutralization of AMD by acid 68
buffering minerals or during mixing with neutral pH waters (Berger et al., 2000; Tonkin et al., 2002;
69
Balistrieri et al., 2003). However, in these studies, arsenic concentration was lower than 1 mg L-1.
70
Gouin et al. (2013) developed a reactive transport model of Fe(II) removal and Fe(OH)3 crust growth 71
under thin film sheet flow applied to AMD in eastern Ohio (USA). Their two-dimensional model 72
considered laminar sheet flow, the inclination of the sheet flow, oxygen transfer inside the water film 73
all along the air-liquid interface, kinetics of Fe(II) oxidation and Fe(OH)3 precipitation. They did not 74
consider neither bacteria biofilm (bacteria were assumed to be uniformly distributed in the liquid phase 75
only), more representative Fe(III) minerals such as schwermannite, nor arsenic chemistry. Their finding 76
implied that simulation and prediction of such a complex biogeochemical AMD dynamic system 77
required a reactive transport approach. To our knowledge, only Asta et al. (2010) developed a reactive 78
transport model on arsenic and iron natural attenuation observed along an AMD discharge from the 79
Iberian pyrite belt. The pH ranged from 2.9 to 3.5. The aqueous concentrations of Fe(II), As(III) and 80
As(V) were about 600 mg L-1, 1 mg L-1 and 1 mg L-1, respectively. 1D-simulations were carried out with 81
the PHREEQC code by coupling advective/dispersive transport, microbial oxidation of iron and arsenic, 82
precipitation of schwertmannite and sorption of arsenate. Sorption was not modeled by surface 83
complexation modeling but an empirical distribution coefficient (𝑘𝑑) was used. The model successfully 84
reproduced the major chemical trends and highlighted the good match between the rate constants of 85
ferrous iron oxidation obtained with the reactive transport model and the values from the literature. On 86
the contrary, the upscaling of rate constants of arsenite oxidation obtained at the laboratory was required 87
to reproduce the field data. 88
In the present study, a reactive transport model is developed with the HYTEC code to simulate a 89
consistent set of previous batch and flow-through experiments (Fernandez-Rojo et al., 2017; 2018;
90
Tardy et al., 2018). These bioreactors reproduce the main natural processes of arsenic attenuation in
91
high-As AMD at the Carnoulès mine in Southern France (Casiot et al., 2003; Morin et al., 2003; Egal
92
et al., 2010). The nature of the solid phases that form upon ferrous iron and arsenite oxidation at the
93
Carnoulès mine (Fernandez-Rojo et al., 2017; 2018) differs substantially from the study of Asta et al.
94
(2010), partly due the higher arsenic content (about 40 mg L-1 instead of 2 mg L-1). The 2D-model 95
accounts for the fact that microbial oxidation takes place inside the bacterial biofilm only, rather than 96
along the water column. This is an important issue for exploitation of natural attenuation in a passive 97
biological treatment which does not use mechanical stirring or forced aeration for mass transfer. The 98
aim of the model is to improve our understanding of how different biogeochemical and hydrodynamical 99
factors affect the efficiency of the natural attenuation process. It will be used to improve the design and 100
scaling of future AMD passive treatment pilot test performed at the Carnoulès site. 101
2. Experiments and modeling features
1022.1. Batch and flow-through experiments
103For the sake of clarity, the set of experiments that were modeled in the present paper are briefly 104
presented in this section. The batch experiment of Tardy et al. (2018) is modeled as a base case for 105
investigating the kinetics of the microbial oxidation of ferrous iron in AMD waters directly sampled 106
from the Carnoulès mine. As shown in Table 1 (the B model), the AMD water is slightly acidic with a 107
pH of 4.7, and it has a high content in ferrous iron (511 mg L-1), arsenite (46 mg L-1) and sulfates (2 000 108
mg L-1). The AMD water was incubated during 8 days at 20 °C in open flasks with continuous stirring. 109
The pH and the concentration of dissolved O2, Fe(II), total Fe, As(III) and As(V) were measured 110
periodically. The Fe and As content, as well as the As(III)/As(V) distribution of the accumulated 111
precipitates were also determined at the end of the experiment. The bacterial community was dominated 112
by iron-oxidizing bacteria (92%) belonging to the genus Gallionella, whereas arsenic-oxidizing bacteria 113
belonging to Thiomonas genus were present in minor proportion. 114
A series of flow-through experiments is modeled in a second step. They were carried out in bench-115
scale thermo-regulated rectangular channels (1 m length × 0.06 m width × 0.06 m depth) by
Fernandez-116
Rojo et al. (2017, 2018). The experimental setup (Fig. 1a) mimicked the shallow sheet flow commonly
117
seen across natural terraced iron formations (TIFs) occurring in AMD (Sanchez-España et al., 2007;
118
Brown et al., 2011; Larson et al., 2014). It was composed of four channels connected in parallel through
119
which the AMD water from Carnoulès was injected at constant flow rate. In a preliminary stage, the 120
channels were fed at a given flow rate and at 4 mm water height up to reach steady state in terms of 121
outlet Fe(II) composition and a bioprecipitate (biofilm, Fig. 1b) formed at the bottom of the channel 122
containing As(III) and Fe(II) oxidizing bacteria that catalyzed the corresponding oxidation reaction. The 123
initiation stage is not simulated in this paper. 124
125
Figure 1. Experimental setup used in flow-through experiments according to Fernandez-Rojo et al. 126
(2017) (a) and 2D longitudinal profile showing the channel zone distribution (b). 127
Four channels at 4 mm water height were then used in parallel to assess the effect of the hydraulic 128
retention time (HRT) from 30 min to 600 min (the FT4-3.9 model in Table 1). HRT was adjusted by 129
changing the flow rate, however the latter always remained sufficiently low to maintain laminar flow 130
conditions in the channel. Water chemistry was monitored during 19 days and, after this time, the 131
precipitate accumulated in the first half and second half of the channels was recovered to further 132
chemical and mineralogical analysis. The bacterial community in the biogenic precipitate was analyzed. 133
It was dominated by Fe-oxidizing bacteria whatever the HRT. The proportion of Gallionella and 134
Ferrovum genera shifted from respectively 65% and 12% at low HRT to 23% and 51% at high HRT, in
135
relation with pH decrease from 3.2 to 2.8. Arsenic-oxidizing bacteria belonging to Thiomonas genus 136
were present in minor proportion (2-3%) (Fernandez-Rojo et al., 2018). To evaluate the water height 137
effect, two complementary experiments (models FT4-3.4 and FT25-3.4 in Table 1) were carried out in 138
parallel with the same residence time but different water heights (4 mm and 25 mm). Dissolved oxygen 139
concentration profiles were recorded through the water film height. In both cases, water and solid 140
chemistry was analyzed once steady state was reached regarding Fe(II) composition in the outlet for a 141
given residence time. Finally, the influence of the inlet pH on the arsenic removal was also evaluated 142
by comparing models of experiments run under the same experimental conditions but decreasing inlet 143
pH values from 3.9 to 3.1, as shown in Table 1. In experiments Exp 1 and Exp 2 used for model FT4-144
3.1 and model FT4-3.4, the composition of the bacterial community was not analyzed but the genetic 145
fingerprint showed distinct bacterial community structures between these two experiments, both in the 146
inlet water and in the biogenic precipitates (Fernandez-Rojo et al., 2018). 147
148 149
Table 1. Experimental conditions, input chemistry and transport parameters used in the models. 150 Model label (1) B FT FT4-3.9 FT4-3.4 FT25-3.4 FT4-3.1 EXPERIMENTAL CONDITIONS Experiment (2) T 20 (a) C1-C4 (b) Exp2 (4mm) (c) Exp2 (25mm) (c) Exp1 (OA) (c) Temperature T °C 20
Flow rate Q mL min-1 - 0.4 – 8 0.3 – 8 1.9 – 50 0.4 – 8
Hydraulic retention time HRT min - 600 – 30 800 – 30 802 – 30 600 – 30
Channel height mm - 4 4 25 4 Duration days 8 19 19 19 19 INPUT CHEMISTRY pH 4.7 3.9 3.4 3.4 3.1 Fe(II) mg L-1 511 460 480 476 432 Fe(III) mg L-1 1 1 4 6 9 As(III) mg L-1 46 34 30 33 19 As(V) mg L-1 7 6 6 6 12 SO42- mg L-1 2000 1795 1900 1900 1801 O2(aq) mg L-1 7.8 4.8 4.8 3.5 3.2 TRANSPORT PARAMETERS Porosity - 1 1 1 1 Fluid velocity U m s-1 - 2.810-5 – 5.610-4 2.110-5 – 5.610-4 2.110-5 – 5.610-4 2.810-5 – 5.610-4 Dispersivity (3) m - 510-5 510-5 710-4 510-5 Diffusion Coefficient De m2 s-1 - 210-9 210-9 210-9 210-9 (1) Labels of the models are coded by type of experiment (B = batch experiment, FT = flow-through experiment). 151
The labels of the FT models are sub-coded by water height (4 mm or 25 mm) and input pH (3.1, 3.4 and 3.9). (2) 152
Experiments of (a)Tardy et al. (2018), (b) Fernandez-Rojo et al. (2018), (c) Fernandez-Rojo et al. (2017). (3) The 153
dispersivity is a scalar in the present modeling, i.e. identical for both longitudinal and transverse dispersivities. 154
155
2.2. The reactive transport equation
156The HYTEC formulation of the multicomponent reactive transport relevant for the channel 157
configuration is (van der Lee et al., 2003): 158
𝜕𝜔[𝐸𝑖]
𝜕𝑡 = 𝑑𝑖𝑣 (𝐷𝑑 𝒈𝒓𝒂𝒅 [𝐸𝑖] − [𝐸𝑖] 𝑼) −
𝜕𝜔 [𝐸̅̅̅̅̅𝐼]
𝜕𝑡 (1)
where [𝐸𝑖] is the total mobile (i.e. dissolved in the aqueous solution) concentration of an element i per 159
unit volume of solution, and [𝐸̅ ] is the immobile (i.e. sorbed or in minerals) concentration of an element 𝐼 160
i per unit volume of solution, 𝜔 is the porosity, and 𝑈 is the Darcy velocity. The partial derivative term 161
−𝜕𝜔 [𝐸̅̅̅̅̅𝐼]
𝜕𝑡 is driven by the chemical reactions whereas the other terms are linked to the transport processes 162
(advection/dispersion and/or diffusion). The term 𝐷𝑑 is the effective diffusion/dispersion coefficient 163
𝐷𝑑= 𝐷𝑒+ 𝛼 ‖𝑼‖ (2)
with the scalar hydrodynamic dispersivity and 𝐷𝑒 the scalar effective diffusion coefficient. From a 164
numerical point of view, chemistry and transport are coupled through a sequential iterative algorithm. 165
The transport module is based on the representative elementary volume (REV) approach with finite 166
volume calculation. HYTEC takes into account all the chemical reactions in aqueous solution. In the 167
present case, the relevant reactions are mainly redox reactions, acid/base reactions and ion complexation 168
in solution, as well as precipitation of solid phases. HYTEC can also model the kinetics of different 169
types of reactions, such as redox reactions in solution or dissolution/precipitation of minerals. Kinetics 170
of As and Fe redox oxidation were taken into account in the present study. 171
Thus, the different HYTEC features have the ability to consider both chemical reactions and 172
transport processes. They also enable involving the microbial activity in the transformation process. 173
This was introduced in the model by considering the action of microorganisms on reaction rates (see 174
section 2.4) and the localization of microorganisms in the biofilm zone in the 2D simulation grid (see 175
section 2.5). This was the first application of the HYTEC code to the modeling of chemical, microbial 176
and transport processes involved in natural attenuation of Fe and As in AMD. 177
178
2.3. Thermodynamic data
179The thermodynamic database Thermoddem (Blanc et al., 2012) was used in all simulations. This 180
database gathers the formation constants of aqueous species, gases and a wide set of mineral phases 181
from wastes and natural environments. According to Fernandez-Rojo et al. (2017, 2018), the most 182
relevant mineralogical processes considered in the modeling were i) the formation of an amorphous 183
Fe(III)-arsenate (AFA), with a stoichiometry similar to scorodite (FeAsO4:2H2O), and ii) the co-184
precipitation of As(III) with schwertmannite (Fe8O8(OH)6(SO4):8H2O). 185
The solubility of an amorphous phase cannot generally be determined with accuracy. In this study, 186
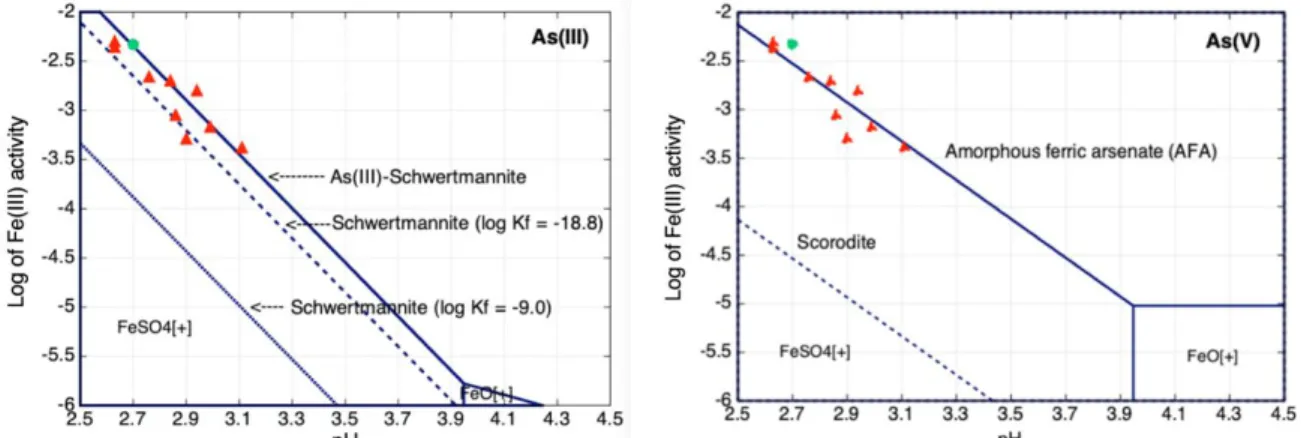
the formation constant of the amorphous Fe(III)-arsenate AFA was slightly increased from the 187
Thermoddem constant 104.5 to 105.3 (Table 2) to better fit the batch and flow-through experimental data, 188
as shown in Fig. 2. The higher the formation constant, the lower the solubility product. This increase of 189
the mineral stability is supported by different studies from the literature that considered formation 190
constants of AFA up to 106.5 (Langmuir et al., 2006; Paktunc et al., 2010). 191
It is well known that poorly ordered nano-crystalline hydroxy-sulfate minerals of microbial origin, 192
such as schwertmannite, are important arsenic scavengers in sulfate-rich acid mine drainage 193
environments. But the actual arsenic retention mechanism, sorption (Burton et al., 2009; Maillot et al.,
194
2013, Paikaray et al., 2014) or co-precipitation (Egal et al., 2009; Park et al., 2016), depends on the
195
AMD environments. Furthermore, Burton et al. (2009) and Liao et al. (2011) showed that As(III) 196
sorption at high As concentration proceeds to a large extent via an exchange mechanism into the 197
schwertmannite tunnel structure between H2AsO3- and SO42- (and to a lesser extent OH-), rather than 198
merely surface complexation at the mineral-water interface. The empirical sorption isotherms (𝐾𝑑, 199
Langmuir) are only applicable at a given pH value (Burton et al., 2009;Liao et al., 2011; Paikaray et al.,
200
2012). To our knowledge, there is no thermodynamic constants in the literature for sorption mechanisms 201
of As(III) on schwertmannite that can be implemented in reactive transport model. In addition, the 202
specific surface of the schwertmannite crystals for As(III) sorption can vary to a large extent (Paikaray
203
et al., 2012) and is tricky to be measured in biofilms. Since the main goal of this paper is to investigate
204
the coupling between the reactions (oxidation, precipitation) and the transport (advective flow, O2 205
supply), and for the sake of simplicity, the stoichiometry of the As(III)-schwertmannite mineral (Table
206
2) was set in order to globally respect the As/Fe molar ratio (1/8) measured in the solid phases at the 207
end of the batch experiment (Section 3.1). This stoichiometry is only suitable for the present AMD 208
waters with a high As content (about 50 mg L-1). The As(III)/Fe mole ratio of 0.125 is within the range 209
of ratios 0.080 – 0.150 found by Burton et al. (2009) at high As concentrations and pH 4. The formation 210
constant of the As(III)-schwertmannite was then adjusted to fit the data of the present batch and flow-211
through experiments, as shown in Fig. 2. 212
The two stability or phase diagrams of Fig. 2 give the boundary between the dominant Fe(III) 213
aqueous species and the solid phase (e.g. schwertmannite). The complex FeSO4+ stands for more than 214
90% of the total Fe(III) aqueous concentration under the present chemical conditions. The diagrams also 215
provide for the comparison of the stability of different Fe(III)-minerals with respect to the pH and the 216
activity of the main Fe(III) species. For the sake of comparison, Fig. 2 gives the stability domain of pure 217
schwertmannite without any As incorporation. In the literature, the solubility product of schwertmannite 218
is either around log Ks = 9 – 10 or around log Ks = 18 – 19. The Thermoddem database has a log Ks = 219
9.0, close to the log Ks = 10.5 2.5 of Yu et al. (1999) obtained for natural stream waters polluted by 220
mine drainage. Bigham et al., (1996) found a log Ks = 18.0 2.5 for mine drainage solutions with pH 221
values in the range 2.8 – 4.5. Regenspurg and Peiffer (2005) measured a log Ks = 18.5 for synthetized 222
schwertmannite in solution at pH 2 and 4. Sánchez-España et al. (2011) reported a log Ks = 18.8 1.7 223
obtained by pH titration at the laboratory in the pH range 3.0 – 3.5. The latter constant was selected by 224
Larson et al. (2014) to investigate thermodynamic control on the kinetics of microbial low-pH Fe(II) 225
oxidation. The present data also agree relatively well with the constant of Sánchez-España et al. (2011), 226
maybe because it would correspond to a highly hydrated schwertmannite as proposed by those authors. 227
228
Table 2. Formation constants Kf (the inverse of the solubility product Ks) of the precipitated solids 229
considered in the modeling of the batch and flow-through experiments. 230
Proxy for As(III)-schwertmannite (1) – responsible of As(III) scavenging
Reaction of formation 8𝐹𝑒3++ 𝐻 2𝐴𝑠𝑂3−+ 21𝐻2𝑂 + 𝑆𝑂42− → 𝐹𝑒8𝑂8(𝑂𝐻)5(𝐻2𝐴𝑠𝑂3)(𝑆𝑂4) ∙ 8𝐻2𝑂 (𝑠) + 21𝐻+ log 𝐾𝑓 (20°C) -8.9
Amorphous ferric arsenate (AFA) – responsible of As(V) scavenging Reaction of
formation 𝐹𝑒
3++ 𝐻
2𝐴𝑠𝑂4−+ 2𝐻2𝑂 → 𝐹𝑒𝐴𝑠𝑂4∙ 2𝐻2𝑂 (𝑠) + 2𝐻+
log 𝐾𝑓 (20°C) 5.3
(1) The phase diagram of Fig. 2 also considers the formation of pure schwertmannite for comparison:8𝐹𝑒3++
231
22𝐻2𝑂 + 𝑆𝑂42−→ 𝐹𝑒8𝑂8(𝑂𝐻)6(𝑆𝑂4) ∙ 8𝐻2𝑂 (𝑠) + 22𝐻+; log Kf (25°C) = -9.0 or -18.8 (see Sec. 2.3). 232
Figure 2. Simplified stability diagrams of the As(III) and As(V) precipitates considered with respect to 233
Fe(III) activity in the modeling with some data on the total Fe(III) concentration of the batch (in green) 234
and flow-through (in red) experiments (temperature = 20°C, activity of SO42- = 10-2, total H3AsO3 = 10 -235 3 M, total H4AsO4 = 10-6 M). 236 237
2.4. Kinetics of microbial oxidation
238Whatever the transport control process (static batch versus dynamic flow-through), the most 239
important reaction is the oxidation of ferrous iron by the dissolved oxygen in solution: 240
𝐹𝑒2++ 0.25 𝑂
2(𝑎𝑞) + 𝐻+→ 0.5 𝐻2𝑂 + 𝐹𝑒3+ (4)
where one mole of electron is transferred per mole of Fe2+ to the electron acceptor which is the dioxygen 241
dissolved in the solution. The abiotic oxidation of Fe(II) can be neglected since its rate is several orders 242
lower than the rate of the microbially mediated oxidation in the studied pH range 2.5 – 4.5 (Larson et
243
al., 2014). The following second-order kinetic rate law was assigned to the microbial oxidation reaction:
244
𝑟𝐹𝑒= 𝑑[𝐹𝑒(𝐼𝐼)]
𝑑𝑡 = − 𝑘𝐹𝑒[𝐹𝑒 2+][𝑂
2(𝑎𝑞)] (5)
where 𝑘𝐹𝑒 is the kinetic rate constant and the brackets stands for the concentrations of the species. The 245
rate constant was fitted onto the total concentration of Fe(II) species given by the chemical analysis, i.e. 246
essentially the sum of the aqueous concentration of Fe2+ and FeSO4 according to the modeling under the 247
chemical compositions of the present AMD waters. The right member of Eq. (5) takes only into account 248
Fe2+ as the active species for the microbial reaction in the reactive transport code HYTEC. The modeling 249
showed that [𝐹𝑒2+] counted for about one half of the total concentration. Therefore, the rate constant 250
𝑘𝐹𝑒 would be twice lower if [𝐹𝑒(𝐼𝐼)] was taken instead of [𝐹𝑒2+] in the second order reaction. 251
Asta et al. (2010) considered a kinetic rate law similar to Eq. (5), but the partial pressure of the 252
oxygen gas, 𝑝𝑂2(𝑔), was used instead of the aqueous concentration of O2. The latter was preferred in the 253
present 2D-modeling which explicitly simulated the dissolution and transfer of oxygen from the air 254
towards the biofilm through the water film. The linear relationship of the oxidation rate with respect to 255
the concentration of Fe(II) and dissolved oxygen has been validated by Pesic et al., 1989 for Fe(II) 256
concentration in the range of 0.100 g/L, pH > 2.2, T = 25°C, and oxygen concentration close to the 257
equilibrium with the atmospheric partial pressure. Kinetic rate independent of Fe(II) may become 258
applicable for Fe(II) concentration above 1 g/L (Karamanev and Nikolov, 1988; Noike et al., 1988). 259
Therefore, a Monod kinetic expression on the Fe(II) concentration would be required to simulate AMD 260
effluents with both moderate and high Fe(II) concentrations. With respect to the effect of oxygen, 261
Sânchez-Espana et al. (2007) measured that the Fe(II) oxidation rate was faster under atmospheric 262
oxygen-saturated conditions. 263
Beside Fe(II) concentration and oxygen, several authors (Pesic et al., 1989; Kirby et al., 1999;
264
Sheng et al., 2017) implemented a four-order reaction with the additional dependency of the kinetic rate
265
upon the concentration of proton, [𝐻+], and the concentration of Fe(II)-oxidizing bacteria, [bacteria]. 266
This clearly works for a single type of bacteria, such as in Pesic et al. (1989). But in the present study, 267
it was not obvious to quantify the proportion of active bacteria within the microbial population of the 268
biofilm from the one hand, and the types of bacteria in the biofilm evolved with the pH from the other 269
hand. As Larson et al. (2014), [𝐻+] had been explicitly removed from the rate equation such that the 270
effect of pH can be evaluated separately. As shown in Table 3, the kinetic rate constant 𝑘𝐹𝑒 was first 271
fitted on the first set of flow-through experiments (FT4-3.9) with an initial pHi of 3.9. This rate constant 272
was then extrapolated to the three other sets of flow-through experiments (3.4, FT25-3.4 and FT4-273
3.1) on the basis of a linear dependency with the initial concentration of proton [𝐻+] in the input 274
solution: 275
𝑘𝑝𝐻𝑖= 𝑘𝑝𝐻𝑖=3.9 [𝐻 +]
𝑖
10−3.9 (6)
The effects of the bacteria concentration and pH on the kinetics of Fe(II) oxidation are discussed in 276
details in Section 4. 277
A similar approach was pursued for the microbial oxidation of arsenite by the dissolved dioxygen, 278
𝐻3𝐴𝑠𝑂3+ 0.5 𝑂2(𝑎𝑞) → 𝐻2𝐴𝑠𝑂4−+ 𝐻+ (7)
where 2 moles of electron is transferred per mole of H3AsO3 to the same electron acceptor, i.e. the 279
dioxygen dissolved in the solution. A second-order kinetic law was also selected for this reaction: 280
𝑟𝐴𝑠= 𝑑[𝐴𝑠(𝐼𝐼𝐼)]
𝑑𝑡 = − 𝑘𝐴𝑠[𝐻3𝐴𝑠𝑂3][𝑂2(𝑎𝑞)] (8)
The modeling showed that H3AsO3 was the principal As(III) species in solution with respect to the pH 281
range (2.5 – 4.5) of this study. 282
The kinetically-controlled reactions of Fe2+ and H3AsO3 exclusively occurred in the biofilm in the 283
reactive transport model. They were decoupled (i.e. fitted independently) since they were driven by 284
different types of bacteria in the biofilm (Fernandez-Rojo et al., 2018). The kinetic rate constants 𝑘𝐹𝑒 285
and 𝑘𝐴𝑠 were the fitting parameters of the model (Table 3). For the sake of minimizing the number of 286
modeling parameters, the precipitation reactions of Section 2.3 were simulated under thermodynamic 287
equilibrium only. 288
It is worth mentioning that the possible oxidation of As(III) by Fe(III) (Asta et al. 2010; 2012) was 289
not considered in the modeling for three reasons. There was less than 1% dissolved Fe under Fe(III) 290
form in the waters of Carnoulès AMD. There was no UV irradiation under the present lab conditions, 291
whereas the oxidation of As(III) by Fe(III) depends on reaction intermediates that are activated by UV 292
only. Eventually, the microbial oxidation of As (III) in the waters of Carnoulès AMD did not occur 293
when the water was inoculated with A. ferrooxidans bacteria that only oxidized Fe(II) to Fe (III) (Egal
294
et al., 2009). 295
296 297
Table 3. Kinetic rate constants considered in the modeling of the batch (B) and flow-298 through (FT) experiments. 299 Model B FT FT4-3.9 FT4-3.4 FT25-3.4 FT4-3.1 Input pH 4.7 3.9 3.4 3.4 3.1 Output pH (a) 2.8 3.0 ± 0.2 3.0 ± 0.1 3.0 ± 0.1 3.1 ± 0.1
Fe(II) oxidation kinetics, Eq. (5)
𝑘𝐹𝑒 (L mol-1 s-1) 2.710-2 (b) 5 (b) 15.8 (c) 15.8 (c) 31.6 (c) As(III) oxidation kinetics, Eq. (8)
𝑘𝐴𝑠 (L mol-1 s-1) ≤ 510-6 (b) ≤ 0.5 (b) ≤ 0.5 (b) ≤ 0.5 (b) ≤ 0.5 (b)
(a) The output pH of the B model corresponds to the pH at the end of the batch experiment (after 300
6 days). The output pH of FT models indicates the average of the output pH values obtained at 301
the different hydraulic retention times (HRT). (b) Fitted constant. (c) Extrapolated constant 302
according to Eq. (6). 303
2.5. Simulation grid and transport parameters
305The batch experiment was modeled with the geochemical module of HYTEC, assuming that the 306
volume of solution was instantaneous homogenized within a single grid node. The flow-through 307
experiments were modeled with a 2D simulation grid composed of three zones (shown in Fig. 1b) with 308
regular discretized nodes of 5×10⁻² m (X direction, length) by 2.5×10⁻⁴ m (Y direction, height). At the 309
bottom of the channel, the biofilm was represented by a thin layer of 0.5 mm height and 1 m length. The 310
kinetics of arsenic and iron oxidation by the bacteria could only occur in this zone. The main zone 311
representing the solution had a different height depending on the model (4 mm or 25 mm). The upper 312
zone (0.25 mm thick) representing the air-solution interface accounted for thermodynamic equilibrium 313
of the solution in this zone with atmospheric air (Henry’s law). The kinetics of atmospheric oxygen 314
dissolution into the solution was not considered in the models. 315
The fluid velocities 𝑈 (m s-1
) was fixed as input boundary conditions (Table 1). They were obtained 316
by dividing the flow rate 𝑄 (m3
s-1) used in the experiments by the cross section 𝑆 (m) of the solution in 317
the channel. The hydraulic retention time 𝐻𝑅𝑇 (s) was calculated dividing the volume 𝑉 (m3) of the 318
solution by the flow rate 𝑄 (m3 s-1) used in the experiments. The diffusion coefficient was set to 210-9 319
m2 s-1 for all dissolved species in the model. As discussed in Section 4.2, diffusion of dissolved oxygen 320
in the water film was not sufficient by itself to account for the whole oxygen transfer from the 321
air/solution interface down to the biofilm. Dispersion was also required. The scalar dispersivities set for 322
the 4 mm and 25 mm water heights were 5×10⁻⁵ m (in the range of the numerical dispersivity of the 323
grid) and 7×10⁻⁴ m, respectively (see Section 4.2). 324
2.6. Input and boundary chemical conditions
325The chemistry of the inlet water defined in the models as well as that one injected in the experiments 326
corresponded to the AMD water collected from the source of the Reigous Creek at the Carnoulès mine. 327
Their aqueous chemistry depends on the sampling campaign (Table 1), with Fe(II) concentrations 328
ranging from 432 to 511 mg L-1 and As(III) concentration ranging from 19 to 46 mg L-1. The waters also 329
contain As(V) but at a lower level of concentration, from 6 to 12 mg L-1. The sulfate concentration is 330
always high, ranging from 1 795 to 2 000 mg L-1. It is worth noting that some of these a priori not 331
significant differences in composition could influence the efficiency of the As bioremediation process, 332
as discussed in Section 4.3. 333
The concentration of dissolved oxygen [𝑂2(𝑎𝑞)] in the input solution was measured to be equal to 334
7.8 ± 0.5 mg O2 L-1 in the batch experiment (close to atmospheric equilibrium) and around 4 mg O2 L-1 335
in the flow-through experiments (Table 1). In the latter experiments, the input solution was not in 336
equilibrium with respect to the atmospheric air given that fluid containers at the inlet were partly purged 337
with N2 in order to avoid iron pre-oxidation. 338
During the batch experiment, the agitation applied during the experiment promoted a constant 339
[𝑂2(𝑎𝑞)] in equilibrium with the atmospheric air during the entire elapsed time. Accordingly, a constant 340
partial pressure of oxygen was fixed at 0.2 atm in the modeling of the batch experiment. In the flow-341
through experiments, [𝑂2(𝑎𝑞)] was measured at the outlet over time. In complement, [𝑂2(𝑎𝑞)] profiles 342
perpendicular to the flow direction were also recorded along water columns located at the inlet/outlet of 343
the channel. In the reactive transport model, the dissolved oxygen profiles throughout the channels were 344
the combination of two mass transfer processes: (1) the horizontal advective/dispersive flow imposed at 345
the inlet of the channel as an input boundary condition and (2) the vertical mainly diffusive transfer from 346
the air-solution interface to the bottom of the channel. This upper interface of the simulation grid was 347
characterized by a condition of constant partial pressure of oxygen of 0.2 atm. 348
3. Modeling results
349The modeling results related to bioremediation of As-rich acid main drainage in the batch (B model) 350
and flow-through reactors (FT models) are presented in this section. The four FT models reproduce the 351
same type of flow-through experiment but in each model one specific parameter is changed (such as the 352
water height or the input pH) to evaluate its influence on the overall removal of As and Fe. Hence, a 353
complete and detailed presentation of the modeling results obtained is presented for one of the four FT 354
models (FT4-3.9 model) in order to avoid repetitive information. Modeling results obtained from the 355
other three FT models are presented in Section 4 to discuss the parameters controlling the natural 356
attenuation of arsenic and iron in acid mine drainage. 357
All models performed except one successfully reproduce the results obtained at laboratory scale by 358
using the same thermodynamic of secondary phases and the same kinetic rate laws for the Fe and As 359
oxidation reactions. The FT4-3.1 model is the unique model that presents some discrepancies between 360
the modeling and the experimental data which are properly discussed in Section 4. 361
3.1. Modeling of the batch experiment (B model)
362The modeling results of the batch experiment are presented in Fig. 3 (brown-solid lines)and Table
363
4. The B model includes the redox reactions of Eqs. (4) and (7) as well as the precipitation reactions of 364
Table 2. This model mimics the experimental data satisfactorily, reproducing both aqueous and solid 365
chemistry patterns. The batch experiments lasted 8 days but the B model considers 6 days of AMD water 366
incubation. In the first two days of experiment water chemistry did not vary at all since the bacteria 367
responsible of catalyzing the oxidation reactions needs some time for adaptation to the new environment. 368
The kinetic rate constants 𝑘𝐹𝑒 and 𝑘𝐴𝑠 used in the B model to fit the modeling and the experimental 369
data are 2.7×10⁻² L mol-1 s-1 and 5×10⁻⁶ L mol-1 s-1, respectively (Table 3). Slight changes in 𝑘 𝐹𝑒 370
provoked significant variations in water chemistry, whereas the 𝑘𝐴𝑠 value could be modified by orders 371
of magnitude without affecting the chemical composition. For 𝑘𝐴𝑠 ≤ 5×10⁻⁶ L mol-1 s-1 the modeling 372
results match well with the experimental data in which no arsenic oxidation occurred. 373
The pH was not monitored during the experiment but inlet and outlet pH were measured showing a 374
decrease in pH from 4.7 to 2.8. In the model, pH decreases sharply during the first hours to remain 375
practically constant (pH about 2.9) until the end of the experiment. The final simulated pH coincides 376
with the measured value (Fig. 3a). The temporal evolution of the aqueous iron and arsenic concentrations 377
obtained from the model matches well with the measured data (Fig. 3b, c). The aqueous Fe(II) 378
concentration decreases with time due to iron oxidation. Sânchez-Espana et al. (2007) obtained a similar 379
evolution of Fe(II) concentration in laboratory batch experiments performed with aliquots AMD mine 380
effluents. The aqueous Fe(III) concentration increases with time as a result of the iron oxidation reaction, 381
but it is also controlled by the subsequent precipitation of As(III)-schwertmannite. Regarding the 382
evolution of the arsenic species, the concentration of aqueous As(III) significantly decreases with time 383
whereas the concentration of As(V) only slightly decreases. 384
The B model was modified by do not considering precipitation reactions in order to (1) verify that, 385
as presented in Tardy et al. (2018), there is no arsenic oxidation under these experimental conditions 386
and, (2) check the effect of precipitation on the pH evolution. Indeed, the modified B model (orange-387
dotted lines in Fig. 3) shows a constant concentration of aqueous As(III) and As(V) during the elapsed 388
time that indicates no arsenic oxidation (Fig. 3c). There is only a slight decrease in pH, from 4.7 to 3.9 389
(Fig. 3a) suggesting that the significant decrease in pH observed in the experiments (from 4.7 to 2.8) 390
was due to the precipitation of As(III)-schwertmannite that releases a large number of H+ (Table 2). 391
393
Figure 3. Variation in pH, concentration of O2, Fe(II), Fe(III), As(III) and As(V) and amount of 394
precipitated As(III)-schwertmannite and amorphous ferric arsenate (AFA) versus time obtained from 395
the B model (SIM; lines) and compared with the measured data (EXP; points) from the T20 batch 396
experiment run in Tardy et al. (2018). Brown-solid and orange-dotted lines indicate modeling results 397
with mineral precipitation (SIM) and without mineral precipitation (SIM_wppt), respectively. 398
399
The concentration of mineral precipitated obtained from the model (Fig. 3d) provided particulate 400
Fe and As (As(III), As(V)) concentration values after 6 days of incubation (Table 4). These values are 401
in good agreement with the experimental data, in terms of concentrations but also in terms of 402
As(III)/As(V) ratio and As/Fe ratio. As(III)-schwertmannite precipitates during all the experiment 403
reducing the aqueous As(III) concentration from 46 to 11 mg L-1, whereas AFA precipitates only at the 404
very beginning of the experiment (low solubility) almost entirely eliminating the amount of aqueous 405
As(V) in the AMD water. No additional AFA precipitation occurs given that arsenic oxidation is 406
negligible in this experiment. 407
Table 4. Chemical concentration of the particulate matter (in mg L-1) at the end of the experiment 408
obtained from the B model (SIM) and compared with the measured data (EXP) from batch experiment 409
T20 run in Tardy et al. (2018). 410
Concentration (mg L-1) Mole ratio
total Fe total As As(III) As(V) As/Fe As(III)/As(V)
EXP 232 ± 14 38.6 ± 1.6 33.4 ± 1.5 5.2 ± 0.1 0.125 6.5
SIM 217 41.9 35.6 6.2 0.144 5.7
3.2. Modeling of the flow-through experiments (FT4-3.9 model)
412The FT4-3.9 model was performed to reproduce a set of 4 flow-through experiments run in parallel 413
and at different flow rates by Fernandez-Rojo et al. (2018). The chemical composition measured in the 414
outlet solution and in the particulate matter after 19 days of AMD water injection at constant flow rate 415
is well reproduced by the model (Fig. 4 and Table 5). 416
417
Figure 4. Variation in pH, concentration of O2, Fe(II), Fe(III), As(III) and As(V) and amount of 418
precipitated As(III)-schwertmannite and amorphous ferric arsenate (AFA) versus the hydraulic retention 419
time (HRT) obtained from the FT4-3.9 model (SIM; lines) and compared with the measured data (EXP; 420
points) from experiments c1 – c4 of Fernandez-Rojo et al. (2018). 421
The kinetic rate constants 𝑘𝐹𝑒 and 𝑘𝐴𝑠 used in the FT4-3.9 model to fit the experimental data are 5 422
L mol-1 s-1 and 0.5 L mol-1 s-1, respectively (Table 3). The 𝑘𝐹𝑒 value used in this model is two orders of 423
magnitude higher than the value used to fit the batch experiment (B model). This fact is mainly related 424
to the much larger amount of the catalyzing bacteria and, to a lesser extent, to the catalyzing efficiency 425
in the biofilm (see Section 4.3). The 𝑘𝐴𝑠 value corresponds to a 10 % of As(III) oxidation. The amount 426
of As(III) oxidation was fixed in the model based on the experimental results obtained in the flow-427
through experiments (Fernandez-Rojo et al., 2018). The authors showed the evidence, not quantified, of 428
little As(III) oxidation and a maximum of 10 % is assumed in models FT. For 𝑘𝐴𝑠 ≤ 0.5 L mol-1 s-1 the 429
modeling results correctly simulate the experimental data and the percentage of arsenic oxidation is 430
within the range 0 – 10 %. 431
The modeling correctly simulates the pH decreases from 3.9 to 3.0 ± 0.2 (Fig. 4a) while increasing 432
the HRT and the subsequent increase of the performance of the bioreactor in terms of Fe(II) oxidation 433
and As abatement (Fig. 4b, c). Model also predicts well the decrease of precipitated mass with HRT 434
increase, in particular for As(III)-schwertmannite (Fig. 4d). 435
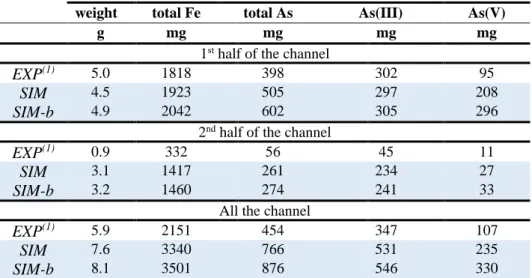
Regarding the chemical composition of the biogenic precipitates deposited in the first half and second 436
half of the channel, a comparison between modeling and experimental data is presented in Table 5 for 437
the experiment with HRT around 100 min. Two models are displayed in the table: the SIM model where 438
precipitation, under thermodynamic equilibrium, can take place everywhere (both in the solution and 439
the biofilm zones), and the SIM-b model where precipitation is forced to occur in the biofilm zone 440
(where microbial oxidation reactions occur). Both simulations show very similar results suggesting that 441
no spatial constraint of precipitation in the biofilm is needed in the model to reproduce the experimental 442
results. Given the complexity of the system, the agreement of the model with the experimental data of 443
the total mass of precipitates is fairly good. The experimental total masses of Fe and As that have 444
precipitated stands for 64 wt.% and 59 wt.% of the calculated ones, respectively. Assuming that the 445
oxidation of Fe(II) is the rate-limiting step for Fe removal process in both the model and the experiment, 446
the present experimental precipitation rates of Fe and As are roughly 1.5 times to twice as low as the 447
Fe(II) oxidation rate. Mineral precipitation occurred at thermodynamic equilibrium in the model 448
whereas a slight kinetic constraint on precipitation took place in reality and limited the amount of 449
precipitates. This issue of kinetics is discussed in Section 4.2. As(III)-schwertmannite precipitation is 450
more localized at the first half of the channel in the experiment than in the model. The first half stands 451
for 84 wt.% of the total Fe in the experiment for 58 wt.% in the model. However, the model also predict 452
a significant precipitation of As(III)-schwertmannite at the beginning of the channel as shown in Fig. 5
453
(and more clearly in the longitudinal profile of Fig. SI-1). The pH progressively decreases in from 3.5 454
to along the channel 3.0 in the biofilm in steady-state (Fig. SI-1), and the higher the pH, the lower the 455
solubility of schwertmannite (Fig. 2). 456
457
Table 5. Experimental (EXP) and simulated (SIM and SIM-b, FT4-3.9 model) chemical composition of 458
the biogenic precipitate recovered from the channel bottom at the end of the flow-through experiment 459
with hydraulic retention time (HRT) around 100 min. 460
weight total Fe total As As(III) As(V)
g mg mg mg mg
1st half of the channel
EXP(1) 5.0 1818 398 302 95
SIM 4.5 1923 505 297 208
SIM-b 4.9 2042 602 305 296
2nd half of the channel
EXP(1) 0.9 332 56 45 11
SIM 3.1 1417 261 234 27
SIM-b 3.2 1460 274 241 33
All the channel
EXP(1) 5.9 2151 454 347 107
SIM 7.6 3340 766 531 235
SIM-b 8.1 3501 876 546 330
(1) The experimental values (in mg) were derived from concentrations (in mg g-1) of Fe and As species in the biogenic 461
precipitate (published in Fernandez-Rojo et al. (2018)) and total precipitate weight (unpublished data). 462
The modeling results provide also information about the spatial distribution of solution and solid 463
chemistry throughout the bioreactor channel (Fig. 5). The profile of the solution chemistry reaches a 464
steady state after 5 hours of injection. At this stage, the 2D longitudinal profile of the dissolved O2 465
concentration shows a vertical decrease in concentration from the top to the bottom of the channel (Fig.
466
5a; Fig. 7a). In the model, the dissolved O2 profile is the consequence of (1) the horizontal flow forced 467
at the inlet of the channel, (2) the vertical O2 diffusion from the air zone to the bottom of the channel, 468
and (3) the O2 consumption by the bacteria present in the biofilm. Those modeling results are compared 469
to the experimental data in Section 4.2. Likewise, the steady-state aqueous Fe(II) concentration that 470
decreases along the channel results from the inlet flow and the Fe(II) consumption by the bacteria (Fig.
471
5b). There is no experimental data on the spatial distribution of dissolved Fe(II) in the water film in the 472
present experiments. However, unpublished data from another set of experiments (Fig. SI-2) show a 473
progressive decrease of dissolved Fe(II) concentration along the channel length). The 2D longitudinal 474
profile of As(III)-schwertmannite precipitates regularly accumulates in the biofilm zone until the end of 475
the experiment. As observed in Fig. 5c, As(III)-schwertmannite precipitation is distributed all along the 476
channel in the biofilm zone but is slightly more localized in the first half of the channel. The comparison 477
with experimental data on the location of precipitates has been made in the previous paragraph. It is 478
worth noting that despite high concentrations in As(III)-schwertmannite such as 350 g/L in Fig. 5c, the 479
corresponding total mass of precipitates in the channel remains in the order of a dozen of grams (see 480
Table 5) since the total volume of the biofilm in Liter is quite small. The maximal concentration of 350 481
g/L corresponds to 0.36 mol/L, or yet a volumetric fraction about 9.3 % per Liter assuming a density of 482
3.7. 483
484
485
Figure 5. 2D longitudinal profiles showing (a) the concentration of dissolved O2, (b) the concentration 486
of aqueous Fe(II) and (c) the amount of As(III)-schwertmannite precipitation, obtained from the FT4-487
3.9 model after 19 days of injection and a hydraulic retention time (HRT) around 100 min.
488
4. Discussion
4894.1. Precipitation of As(III) and As(V) ferric minerals
490The network of reactions that can be deduced from the modeling of the batch and flow-through 491
experiments is given in Fig. 6. The evolution of the system is driven by the relatively fast oxidation of 492
Fe(II) which is the rate-limiting step that promotes both precipitation of schwertmannite and amorphous 493
ferric arsenate (AFA). However, the rather slow oxidation of As(III) prevents the formation of As(V)-494
AFA from the one hand, and favors the trapping of As(III) by schwertmannite precipitation from the 495
other hand. This conceptual model is at least applicable to As(III)-rich AMD and a characteristic time 496
of a few weeks, as in the present case. The issue of kinetics of precipitation, the nature of As-bearing 497
minerals and the effect of the hydraulic retention time are discussed in the next paragraphs of this 498
section. 499
500
Figure 6. Schematic reaction network for the natural attenuation of arsenic and iron in the AMD of the 501
Carnoulès mine deduced from the modeling of the batch and flow-through experiments (AFA stands for 502
amorphous ferric arsenate). 503
504
Relatively scarce information concerning the rate of schwertmannite precipitation was found in the 505
literature. It is worth noting that Fe(III) precipitation rate (expressed in mol.L-1.s-1) is 8 times faster than 506
the rate of schwermannite precipitation (expressed in mol.L-1.s-1) due to the stoichiometry of 507
schwermannite than corresponds to 8 moles of Fe per mole of mineral. Kirby et al. (1999) stated that 508
the oxidation of Fe(II) was apparently the rate-limiting step in passive treatment of coal mine drainage. 509
Sânchez-Espana et al. (2007) found that the rate of Fe(III) precipitation as schwermannite was 2 – 3 510
times lower than the respective rates of Fe(II) oxidation for AMD of two Spanish mines. Chen and Jiang 511
(2012) reported high rates of As-bearing schwermannite precipitation in an acid mine drainage system 512
in Taiwan. The authors stated than Fe(II) oxidation appeared to be the rate-determining reaction for Fe 513
removal process in the creek section but not in the water fall section. Fernandez-Rojo et al. (2017) found 514
that the Fe(II) oxidation rate was twice as fast as the total Fe precipitation rate. To the best of our 515
knowledge, no AFA precipitation rate to compare with this study has been found in the literature. 516
For the sake of simplicity, As-mineral precipitation was modeled under thermodynamic equilibrium 517
in this study. The good agreement between the modeling and experimental data in terms of precipitated 518
masses (Tables 4 and 5) indicates that it was a reasonable approximation. But it is worth noting that 519
this good agreement is partly due to the fitting of the formation constant of the As(III)-schwertmannite 520
to the data. The fact that the solubility of this mineral is slightly above the solubility of pure 521
schwertmannite (solubility diagram of Fig. 2) probably indicates that the kinetic delay in precipitation 522
was included in the fitting. Whatsoever, the single fitted value of the formation constant of As(III)-523
schwertmannite was able to correctly simulate the whole set of batch and flow-through data (with the 524
single exception of As(III) at the highest HRT in Fig. 4c). 525
Although the elements iron and arsenic are often encountered jointly in AMD, As(III)-ferric 526
minerals are relatively uncommon. This is due to the usual predominance of As(V) upon As(III) in AMD 527
water, which promotes the formation of As(V)-ferric minerals upon microbial Fe oxidation. However, 528
As(III)-ferric minerals such as tooeleite or As(III)-schwertmannite are known from several AMD 529
systems throughout the world (Mazlan et al. (2016) and reference therein). If specific conditions are 530
met, in particular at high As(III) concentration in the AMD, these As(III) ferric minerals can form 531
abundantly (Mazlan et al., 2016 ; Paikaray et al., 2011). In the specific case of the Carnoulès AMD, both 532
field data and laboratory experiments showed that As(III) ferric minerals i.e. As(III)-schwertmannite or 533
tooeleite are the major As-bearing solids forming upon microbial Fe(II) oxidation (Morin et al., 2003 ; 534
Egal et al., 2009). The formation of one or the other solid phase appeared to be controlled by the rate of 535
Fe(II) oxidation ; higher Fe(II) oxidation rates favor the formation of As(III)-schwertmannite relative to 536
tooeleite (Egal et al., 2009). The present study shows that fast Fe(II) oxidation rate also favors the 537
formation of As(III)-schwertmannite relative to AFA due to the slower microbial As(III) oxidation. 538
The amount of secondary mineral precipitation varies depending on the hydraulic retention time 539
(HRT) considered (Fig. 4d). The amounts of As(III)-schwertmannite and AFA precipitated (in mg) after 540
19 days of AMD water injection decreases when the HRT increases. The highest amounts of As-bearing 541
precipitates are obtained for HRT values lower than 200 min. This may seem counter-intuitive from the 542
point of view of oxidation kinetics. The higher the HRT, the more efficient the kinetics of Fe(II) 543
oxidation. But it makes sense while considering the total amount of AMD water that have been injected 544
in the bioreactor. Indeed, the lower the HRT, the higher the input of fresh AMD water after 19 days. 545
The concentration of precipitated minerals per liter of injected solution can be calculated as the ratio of 546
the mass given in Fig. 4d by the total number of liters injected during 19 days. The concentration of 547
As(III)-schwertmannite is more than three times greater at high than at low HRT (303 mg L-1 and 91 548
mg L-1 of As(III)-schwertmannite at HRT of 600 min and 60 min, respectively). On the contrary, the 549
concentration of AFA is similar at any HRT considered in this study (18 ± 2 mg per liter of injected 550
solution). The fact that the concentration of Fe(III) in solution is higher at high HRT (Fig. 4b), both in 551
the experiment and the modeling, is due to the slight decrease in pH that favors Fe(III) solubility (Larson
552
et al., 2014 and solubility diagram of Fig. 2). Globally, it is worth noting that high HRTs favor As 553
removal but also lead to higher concentrations of Fe(III) in solution. 554
4.2. Dissolved oxygen supply to the biofilm through the water thin film
555Two FT models with inlet pH = 3.4 and different water height are presented in this section: model FT4-556
3.4 with 4 mm water height and the FT25-3.4 model with 25 mm water height (Table 1). The water 557
height in the channel influences the transfer of the dissolved oxygen (O2) from the atmosphere to the 558
biofilm zone. As mentioned before, the dissolved O2 profiles throughout the water film was the 559
combination of two mass transfer processes in the model: the horizontal advective/dispersive flow 560
imposed at the inlet of the channel as an input boundary condition, and the vertical mainly diffusive 561
transfer from the air-solution interface to the bottom of the channel where oxidation reactions occur. 562
Fig. 7a, b shows the calculated and experimental vertical profiles of the dissolved O2 concentration 563
through the water column in the channel. Under abiotic conditions, the O2 concentration profiles show 564
no variation along the 4 mm water column and very little variation along the 25 mm water column. 565
Given that no O2 consumption occurs, the calculated dissolved O2 concentration along the entire water 566
column is very close to that in equilibrium with the atmosphere in both models from the one hand, in 567
good agreement with the experimental measurement from the other hand. Under biotic conditions, the 568
calculated O2 concentration profile is close to the experimental one for 4 mm height. In the model, the 569
linear profile corresponds to a diffusive steady state between two boundary conditions at fixed 570
concentrations. The inlet concentration of dissolved oxygen O2(aq) (4 mg L-1, i.e. 510-4 equivalent of 571
electron e- per liter) is largely insufficient to fully oxidize the Fe(II) content of the AMD water (500 mg 572
L-1, i.e. 910-3 equivalent of electron e- per liter of solution). Therefore, a significant input of oxygen 573
from the atmospheric air was required in the model to sustain the oxidation reactions in the biofilm. In 574
the model at 25 mm, the best match was obtained while increasing the scalar dispersivity from 5×10⁻⁵ 575
and 7×10⁻⁴ m (Table 1) as to reach a linear diffusive/dispersive steady-state profile. That is to say that 576
the dispersion in Eq. (2) varied from 110-9 to 310-8 m2/s in the 4 mm cases, and from 210-8 to 410 -577
7
m2/s in the 25 mm cases (to be compared to the diffusion coefficient of 210-9 m2/s). These dispersion 578
values remain small due to the almost laminar flow in the channel that minimizes dispersion. The source 579
of dispersion could be related to the channel walls or some roughness of the biofilm and its precipitates. 580
Even so, the model did not match so well the O2 concentration profiles measured for the 25 mm height. 581
similar for the two heights and closed to the experimental data (about 2 mg L-1) at 4 mm height given 583
the uncertainty of such O2 analysis (there was no analysis in the biofilm zone for the 25 mm height 584
experiment). Eventually, it is worth emphasizing that the linear steady-state vertical profile of dissolved 585
O2 concentration has been confirmed by another set of experiments performed with a 4 mm height water 586
film (data published in Fernandez-Rojo et al. (2017) but not modeled in this paper; see Fig. SI-3). 587
Fig. 7c shows the variation in aqueous Fe(II) concentration versus the hydraulic retention time 588
(HRT). Increasing HRT, the aqueous Fe(II) concentration (in mg L-1) decreases sharply at 4 mm height 589
but remains fairly constant at 25 mm height. This trend occurs in both the model and the experiment. It 590
does not imply that Fe oxidation is much higher at 4 mm than 25 mm. The absolute amounts of Fe 591
oxidation (in mg), i.e. the concentration times the volume of solution, between the two configurations 592
only slightly differed from each other for all the HRTs. Hence, taking into account that microbial Fe(II) 593
oxidation is localized at the bottom of the channel, the amount of oxidation for a 4 mm water column 594
seems to be roughly comparable to that for a 25 mm water column. A similar process takes place for 595
As(III), with again a very good agreement between the calculated and experimental results. Fig. 6d
596
shows that this agreement remains at high HRTs where the As(III) concentration becomes very low. 597
Globally, the local activities inside the bacterial biofilm seems to be similar for both water heights. 598
Therefore, they are not significantly limited by the O2 supply from both the inlet solution and the 599
atmosphere. But the scavenging of As(III) and Fe(II) in terms of concentration decrease is not efficient 600
enough in the case of the 25 mm height. 601
A sheet-flow regime is assumed to allow for efficient diffusion of oxygen from atmospheric air to the 602
water film (e.g. Gouin et al., 2013). Several authors have evidenced a greater Fe(II) concentration 603
decrease in some sections of AMD streams characterized by a shallow sheet-like flow above terraced 604
iron mound as opposed to other sections characterized by deep water pools (Chen and Jiang, 2012; 605
Brown et al., 2011). Such a greater Fe(II) oxidation efficiency was generally attributed to improved 606
aeration generated by turbulent hydrodynamic conditions (Chen and Jiang, 2012). In the present study 607
there was no turbulent flow, and similar O2 concentrations, around 1 mg L-1, were determined in the 608
biofilm zone, both at 4 mm and 25 mm water height. Thus, greater Fe(II) concentration decrease at 4 609
mm was attributed to the limitation of the Fe(II) oxidation activity to the biofilm zone near the channel 610
bottom. This active zone represented a smaller fraction of the whole water volume in the channel as the 611
water height increased. Thus, decreasing Fe(II) concentration in this zone did not affect the whole water 612
chemistry significantly. A major consequence is the need for a higher biofilm surface area per water 613
volume unit, in view of the application of the natural attenuation process to AMD treatment. 614
615
616
617
Figure 7. Dissolved O2 concentration profiles for a 4 mm height (a) and 25 mm-height (b) of the water 618
film; variation in Fe(II) (c) and As(III) (d) concentration versus the hydraulic retention time (HRT) for 619
both heights; experimental data from Fernandez-Rojo et al. (2017); the dotted lines indicate modeling 620
results under abiotic conditions without any oxidation kinetics (with the label nok). 621
4.3. Effects of biofilm bacteria concentration and pH on the oxidation rates
622As specified in Section 2.4, several authors (Pesic et al., 1989; Kirby et al., 1999; Sheng et al., 2017) 623
implemented a four-order reaction with the additional dependency of the kinetic rate upon the 624
concentration of proton and Fe(II)-oxidizing bacteria. In the present study, it was not obvious to quantify 625
the proportion of active bacteria within the microbial population of the biofilm from the one hand, and 626
the types of bacteria in the biofilm evolved with the pH from the other hand. Like Asta et al. (2010), the 627
microbial Fe(II) oxidation was, therefore, modeled by a simplified second-order kinetic rate law 628
depending on the concentrations of the substrates Fe(II) and dissolved O2. This approach correctly 629
reproduced most of the batch and flow-through experimental data. 630
The modeling results showed that rate constant was at least two orders of magnitude higher in the 631
biofilm of flow-through experiments than in the planktonic bacteria of the batch experiment (e.g., 𝑘𝐹𝑒 632
= 2.7×10⁻² L mol-1 s-1 in the B model and 𝑘𝐹𝑒 = 5 L mol-1 s-1 in the FT4-3.9 model). This factor is well 633
correlated to the two orders of magnitude higher concentration of Fe(II)-oxidizing bacteria measured in 634
the flow-through experiments compared to that measured in the batch experiment (about 107 and 105 635
cells mL-1, respectively). This trend can only be an estimation since the fraction of bacteria in the biofilm 636
that are really active in the oxidation of Fe(II) is not known. Whatsoever, the present rate constant 𝑘𝐹𝑒 637