HAL Id: hal-02469384
https://hal.sorbonne-universite.fr/hal-02469384
Submitted on 7 Feb 2020HAL is a multi-disciplinary open access archive for the deposit and dissemination of sci-entific research documents, whether they are pub-lished or not. The documents may come from teaching and research institutions in France or abroad, or from public or private research centers.
L’archive ouverte pluridisciplinaire HAL, est destinée au dépôt et à la diffusion de documents scientifiques de niveau recherche, publiés ou non, émanant des établissements d’enseignement et de recherche français ou étrangers, des laboratoires publics ou privés.
Elucidating the Origin of the Electrochemical Capacity
in a Proton-Based Battery H x IrO 4 via Advanced
Electrogravimetry
Pierre Lemaire, Antonella Iadecola, Ozlem Sel, Daniel Alves Dalla Corte,
Hubert Perrot, Jean-marie Tarascon
To cite this version:
Pierre Lemaire, Antonella Iadecola, Ozlem Sel, Daniel Alves Dalla Corte, Hubert Perrot, et al.. Eluci-dating the Origin of the Electrochemical Capacity in a Proton-Based Battery H x IrO 4 via Advanced Electrogravimetry. ACS Applied Materials & Interfaces, Washington, D.C. : American Chemical Society, 2020, 12 (4), pp.4510-4519. �10.1021/acsami.9b19349�. �hal-02469384�
Elucidating the origin of the electrochemical capacity in proton‐based battery
H
xIrO
4via advanced electrogravimetry
Pierre Lemaire†,‡,§, Ozlem Sel¦,*, Daniel Alves Dalla Corte†,§, Antonella Iadecola§, Hubert Perrot¦, Jean‐ Marie Tarascon†,§,* † Chimie du Solide et de l’Energie, UMR 8260, Collège de France, 11 Place Marcelin Berthelot, 75231 Paris Cedex 05, France ‡ Sorbonne Université, 4 Place Jussieu, 75005 Paris, France § Réseau sur le Stockage Electrochimique de l’Energie (RS2E), CNRS FR 3459, 33 Rue Saint Leu, 80039 Amiens Cedex, France ¦ Sorbonne Université, CNRS, Laboratoire Interfaces et Systèmes Electrochimiques, LISE, 75005 Paris, France * Corresponding authors Jean‐Marie Tarascon: jean‐marie.tarascon@college‐de‐france.fr Ozlem Sel: ozlem.sel@upmc.fr Abstract Recently, because of sustainability issues dictated by societal demands, more importance has been given to aqueous systems and especially to proton‐based battery. However, the mechanisms behind the processes leading to energy storage in such systems are still not elucidated. Under this scope, our study is structured on the selection of a model electrode material, the protonic phase HxIrO4 and the scrutiny of the interfacial processes through suitable analytical tools. Herein, we employed operando Electrochemical Quartz Crystal Microbalance (EQCM) combined with Electrochemical Impedance Spectroscopy (EIS) to provide new insights into the mechanism intervening at the Electrode‐Electrolyte Interface. Firstly, we demonstrated that not only the surface or near surface but the whole particle participates in the cationic redox process. Secondly, we proved the contribution of the proton on the overall potential window together with the incorporation of water at low potentials solely. This is explained by the fact that water molecules permit a further insertion of protons in the material by shielding the proton charge but at the expense of the proton kinetic properties. These findings shed new light on the importance of water molecules in the ion‐insertion mechanisms taking place at the Electrode‐Electrolyte Interface of aqueous proton‐based batteries. Overall, the present results further highlight the richness of the EQCM based methods for the battery field in offering mechanistic insights that are crucial for the understanding of interfaces and charge storage in insertion compounds. Keywords aqueous battery, electrode‐electrolyte interface, EQCM, protonic phase HxIrO4, proton insertion
Introduction
The signs and impacts of global warming are nowadays urging electrochemical energy storage and especially batteries to be developed in order to overcome the issue of the renewable energies intermittency.1 Heading in this direction, advances have already been accomplished to improve the overall performances of batteries mainly in terms of lifetime, energy and power densities, thanks to various strategies adopted in materials science. These strategies enlist the quest of novel materials for cathode and anode electrodes, as well as new electrolytes and have resulted in a significant progress as witnessed by a doubling of the energy density of the liquid Li‐ion batteries over the last 20 years. Aside from energy density, sustainability is another overriding figure of merit driving the development of new battery technologies. In this regard, the need for greener batteries has become a pressing concern and boosted the research for new chemistries such as the emerging Na‐ion technology, which stand as an environment‐friendly alternative to Li for the grid. Within this context, considerable attention is currently given to aqueous systems which offer advantages compared to nonaqueous counterparts, in terms of: safety, cost, ionic conductivity or processibility.2 Recently a tremendous attention has been given to promising aqueous Zn‐based battery systems (i.e. Zn‐air, Zn‐Ni and Zn‐ MnO2) as well those employing TiO2 as electrode materials. For the latter, the intercalation of aluminum3 or lithium4 cations has been shown but more interesting results have been found and proven for the intercalation of protons even in mild acidic conditions.5 Kim et al. managed to quantitatively deconvolute the contributions of the electrical double‐layer capacitive charge storage and the reversible faradaic reactions which provided a confirmation of the faster proton intercalation compared to that of lithium. The proton insertion has also been mentioned for the Zn/MnO2 system.6 Despite the widespread fresh literature on the subject, the mechanism taking place at the Electrode‐ Electrolyte Interface (EEI) is still not elucidated. In order to better understand the science behind the EEI of proton‐based batteries, the new protonic phase HxIrO4 discovered by our group7 has been selected as a model compound. The reasons for this choice are twofold. Firstly, it presents less complex redox chemistry because of a sole redox center, which is Ir. Secondly, it offers a reasonable capacity of 175 mA.h/g via a reversible two‐step redox process in concentrated acidic electrolyte. However, its total reactivity mechanism has not yet been fully unrevealed, partially due to the lack of suitable analytical tools.
Therefore, our strategy to obtain mechanistic insights on the charge storage behavior in proton‐based batteries is accompanied by analytical techniques that combine electrochemical methods with simultaneous mass variation measurements, Quartz Crystal Microbalance (QCM). Owing to the essential capability of mass detection with high sensitivity (in the nanogram range) and, thanks to the well‐known Sauerbrey equation,8 the QCM is a powerful experimental tool for studying ion intercalation and interface phenomena in battery electrodes, especially when coupled to electrochemical methods (e.g. Electrochemical Quartz Crystal Microbalance (EQCM)). In the recent years, the group of M.D. Levi and D. Aurbach has pushed the frontiers of this analytical technique and demonstrated that different modes of EQCM can be employed as a morphological and mechanical probe for the comprehension of phenomena appearing during the cycling of the supercapacitor or battery electrodes. The developments mainly focus on the EQCM experiments at various overtones of the resonant frequency where the energy dissipation is taken into account to follow the dissipative properties (EQCM‐D), for example of the Solid‐Electrolyte Interphase (SEI) forming during a Li‐ion battery cycling by multilayered viscoelastic Voigt modeling.9 The same group utilized this technique to analyze the morphology of porous electrodes at different length scales10,11 and the influence of binders in the mechanical properties of composite electrodes.12,13 The technique has gained in popularity and numerous groups have followed this approach.14,15 A recent development has been reported by Kitz et
al. where a Cu‐coated EQCM‐D sensor is integrated within a battery cell (with a model configuration where a carbon black working electrode is cycled against LiFePO4 counter electrode in a classical organic electrolyte). QCM‐D measurements are performed during electrochemical cycling to investigate SEI growth on a Cu‐coated sensor in a configuration emulating Li‐ion battery conditions.16 The originality of the method stems from the fact that Carbon working electrode is disconnected from the battery cell at certain intervals during the cyclic voltammetry sweep to conduct Electrochemical Impedance Spectroscopy (EIS) measurements on the Cu coated sensor. These intermittent EIS analyses during EQCM‐D measurements permitted the concomitant assessment of the gravimetric and mechanical properties of SEI on the Cu current collector and the resistances/capacitances of the electrochemical processes taking place during its formation.
As an extension to these developments in the domain of battery materials characterization, here, we propose a coupled electrochemical and gravimetric analysis of the new protonic phase HxIrO4, a candidate electrode material for proton‐based batteries. In this coupling between QCM and EIS (the so‐called AC‐electrogravimetry), the microbalance frequency change, of the working electrode (e.g. quartz resonator modified with HxIrO4 layer) is measured simultaneously with the AC response, , of the electrochemical system. Hence, under the conditions of the gravimetric regime, it gives access to the mass variations due to the insertion/deinsertion of ions and/or solvent molecules (thanks to the gravimetric aspect), the kinetics of interfacial transfer (thanks to EIS coupling) and the identification of the exchanged species (by their atomic weight) and their quantification. AC‐ electrogravimetry is complementary to classical EQCM and employed here to provide insights into the underlying science governing the EEI of the HxIrO4 phase permitting the deconvolution of the contribution of each species (charged or uncharged) involved (in)directly in the charge storage mechanism. In this work, after the characterization of the pristine HxIrO4 phase, we first apply the classical EQCM technique for mass variation analysis so as to determine two electrochemical regions of interest. Secondly, we demonstrate the participation of water molecule to the redox activity thanks to XRD and TGA measurements. Lastly, via AC‐electrogravimetry analyses we report the involvement of proton H+ and water molecule H2O during the cycling of our phase while assessing the kinetic parameters associated to each species. Hence, the implementation of EQCM to proton‐based battery systems further demonstrated the richness of this analytical technique within the battery field.
Experimental section
Material synthesis and characterization. Li3IrO4 was prepared by mixing metallic Ir and Li2CO3 in stoichiometric amounts and heating at 950°C for 24 h in air. Then the resulting sample was acid‐ leached in 1 mol/L H2SO4 (95‐97 %, Sigma‐Aldrich) during 1 h with a fivefold excess of H+ over exchangeable Li+ in the material. The powder and the supernatant were separated by centrifugation and the sample was washed five times with distilled water prior to being dried overnight at 80°C under vacuum.7 X‐ray diffraction (XRD) was performed at each step to confirm the success of the synthesis and at different state‐of‐charge of the material (ex situ, by stopping at different potentials during cycling) using a BRUKER D8 Advance diffractometer with Cu Kα radiation (λKα1 = 1.54056 Å, λKα2 = 1.54439 Å). Thermogravimetric Analyses (TGA) were recorded with a Mettler Toledo TGA/DCS 3+ apparatus under argon by applying a heating rate of 5 K/min from 25 to 1000°C using around 8‐10 mg of material. The morphology of the particles was observed by Scanning Electron Microscopy (SEM) with a SU‐70 Hitachi FEGSEM (accelerating voltage 5 keV). The specific surface area was determined using Brunauer, Emmet and Teller analysis on a Quantachrome ChemBET Pulsar from a single‐point BET analysis performed after 12 h outgassing at 150°C.
Electrochemical characterization. Self‐standing PTFE electrodes were prepared. HxIrO4 was mixed with 10 wt.% Carbon super P (Csp, Timcal) and 5 wt.% PTFE (1 µm, Sigma‐Aldrich), and laminated several times to obtain films with a thickness of 60‐70 µm and a density of material around 15 mg/cm². The phase was cycled in aqueous media 0.5 mol/L HClO4 (99.999 %, Sigma‐Aldrich) and Ar‐saturated Milli‐ Q ultrapure water using three‐electrode PFA Swagelok cells with two glassy carbons current collectors and Hg/Hg2SO4 (saturated K2SO4) as the reference electrode (BioLogic). 6.5 mm diameter electrodes (0.322 cm²) were punched from the HxIrO4/Csp/PTFE film for the working electrode, and from PTFE electrodes of overcapacitive carbon (YP50) for the counter electrode. The proton release‐uptake value was obtained from coulombic titration assuming the formula H4IrO4 for the starting material and that only protons participate to the charge storage mechanism. Galvanostatic and cyclic voltammetry measurements were performed using a VMP3 potentiostat (Bio‐Logic).
Electrochemical‐gravimetric analysis. The classical EQCM measurements were performed using
commercial SEIKO QCM922A microbalance using AT‐cut 9 MHz quartz resonators patterned with gold electrodes on both sides. The electroactive geometric surface area was equal to 0.196 cm². The active material was mixed with 18 wt.% Csp and 10 wt.% PVDF‐HFP (Kynar, Arkema) in 1‐Methyl‐2‐ pyrrolidinone (99.5 %, Alfa Aesar) by utrasonication (Qsonica) to obtain a homogenous slurry at a concentration of 1 mg/mL. Then the slurry was spray casted with an airbrush at a pressure of 4 bars on the gold electrode of the quartz resonators. The resonator (placed in a mask exposing only the gold surface area) was kept at 150°C on a hot plate to permit rapid solvent evaporation. The volume of casted slurry was selected to obtain a loading between 40‐60 µg/cm² to prevent the dissipation of energy due to a loading excess and to keep the gravimetric regime of the QCM (i.e. validity of the Sauerbrey equation8 under the conditions of the study). Prior to the measurement, the EQCM was calibrated through a protocol described elsewhere17 to determine the experimental sensitivity coefficient (i.e. proportionality constant between the change of quartz frequency and change of mass) in the Sauerbrey equation8 ∙ . A of 1.20 ng/Hz was found (for a quartz operating at 9 MHz) and used for the rest of the experiments. The electrochemical cycling was performed using a labmade cell developed specifically for EQCM measurements (SPHERE‐ENERGY). The EQCM electrode was used as the working electrode, a 3 mm diameter graphite rod (Sigma‐Aldrich) as the counter electrode and Hg/Hg2SO4 (saturated K2SO4) as the reference electrode. The measurements are performed in 0.5 mol/L HClO4. During the electrochemical measurements, the quartz frequency and motional resistance were simultaneously measured. The motional resistance variations were always lower than 10 Ω consequently the viscosity changes at the vicinity of the HxIrO4 coated electrode during cycling were supposed to be negligible. Furthermore, another mode of EQCM with dissipation monitoring was performed using AWS A20+ (Advanced Wave Sensors) from the 3rd to the 11th overtone in order to check the viscoelastic properties of the spray casted film and verify the gravimetric regime.
AC‐electrogravimetry measurements were carried out by using a four‐channel frequency response
analyzer (Solartron 1254 FRA) and a laboratory‐made potentiostat and QCM. The QCM was used under dynamic regime, working electrode (gold patterned quartz resonator) was polarized at a selected potential, and a small‐amplitude potential perturbation (40 mV rms) was superimposed. The frequency range was between 63 kHz and 10 mHz for the potential modulation. The microbalance frequency change, , corresponding to the mass response, , of the working electrode was measured simultaneously with the AC response, , of the electrochemical system. The resulting signals were sent to a four‐channel Frequency Response Analyzer (FRA), which allowed the electrogravimetric transfer function / and the classical electrochemical impedance / to be obtained simultaneously at a given potential.18 The theory of the coupled method and the data analysis are detailed in the Supporting Information (Part IV).
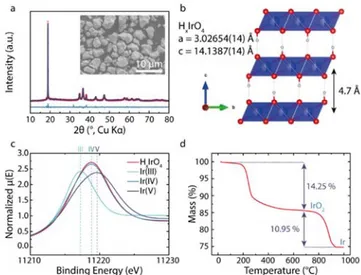
X‐ray Absorption Spectroscopy (XAS). Ex situ and Operando XAS measurements at the Ir L3‐edge were performed in a transmission mode at the ROCK beamline19 of synchrotron SOLEIL (France). A Si (111) channel‐cut quick‐XAS monochromator with an energy resolution of 2 eV at 11 keV was used. The intensity of the monochromatic X‐ray beam was measured by three consecutive ionization detectors. The in situ three‐electrode cell (Figure SI‐1.a) was placed between the first and the second ionization chambers. Operando XAS spectra were collected continuously and averaged out over periods of 120 s. The energy calibration was established with simultaneous absorption measurements on Ir metal foil placed between the second and the third ionization chambers. The energy calibration as well as the normalization was done using graphical interfaces available on the ROCK beamline.20 The White Line (WL) energy position taken at the zero crossing of the first derivative (Figure SI‐1.b) was used as fingerprint of the oxidation state. K3IrCl6, Li2IrO3 and Li3IrO4 were used as references for the oxidation state of Iridium +III, +IV and +V respectively. Results and discussion Phase characterization. X‐ray diffraction was first used to characterize the pristine material, namely HxIrO4, obtained by acid leaching of the Li3IrO4 phase. Figure 1.a shows sharp Bragg peaks characteristic of a well‐crystallized compound that we have indexed in a hexagonal 3 unit cell as the parent phase. The Figure 1.b depicts the structural model deduced from the refinement. Nevertheless, due to the small scattering factor of protons for X‐rays, their structural positions within the structure have not been determined but solely speculated. The structural model shows a layered structure with an interlayer distance of 4.7 Å and having the hydroxyl group (see below) pointing towards the van der Walls layer as reported earlier7. The SEM image indicates well‐defined particles with a particle size distribution in the range of 2 to 4 µm with a small specific surface area of 2.23 m²/g.
Figure 1. a Rietveld refinement of XRD patterns of HxIrO4. The red circles, dark blue continuous line, and
bottom blue line represent the observed, calculated, and difference patterns, respectively. Inset: SEM image. b the corresponding structural model where the proton positions have been supposed. c White Line energy position at the Ir L3‐edge of the pristine material and three reference samples. d TGA curve with the mass losses associated to each process. X‐ray absorption spectroscopy has been used to determine the Iridium oxidation state of the pristine phase. From the comparison of the WL energy with some selected references, we can conclude that the Ir oxidation state is +IV in the pristine material (Figure 1.c); therefore we propose the formula of
H4IrO4 for the leached material supposing the absence of residual Li in the material. Consequently, the leaching process enlists both an ion exchange and a reduction process according to the reaction listed below.
Li3IrO4 + 3 H+ + ½ H2O → H4IrO4 + 3 Li+ + ¼ O2
The appearance of gas bubbles (O2) released from the particles during the acid leaching is consistent with the chemical reaction. It is worth mentioning that this proton stoichiometry deviates from the original value found in our previous study7 (3.4 hydrogen atoms). This is simply due to a modification of the acid leaching protocol moving from a concentration of 0.1 mol/L H2SO4 to 1 mol/L, hence favoring H+ uptake.
Concerning the phase thermal stability, thermogravimetric analysis was performed and the profile of the collected TGA curve (Figure 1.d) displays two steps mass losses with onset temperature of 220 and 900°C. The first one is ascribed to structural and not physisorbed water molecules, owing to its elevated removal temperature (220°C). The second mass loss (≈ 900°C) is in contrast attributed to the departure of O2. XRD measurements (not shown) indicate the presence of IrO2 and Ir on the samples retrieved from the TGA experiments stopped at 700 and 1000°C, respectively. These results lead to propose the following decomposition pathway: → 2 4 2 2 4 → 2 4 2 4
Altogether, from the quantification of the two mass losses and assuming formula of the pristine material to be HxIrOy, we obtained values of x = 4.0 and y = 3.9, leading to the stoichiometry of H4.0IrO3.9, in agreement with the formula deduced by XAS.
Electrochemical analyses. This new layered protonic phase was further tested for its electrochemical
performance in an aqueous electrolyte using a three‐electrode PFA Swagelok cell. The self‐standing electrodes of active material were tested either by cyclic voltammetry or in galvanostatic mode (galvanostatic cycling with potential limitation, GCPL). Figure 2.a shows the variation of the potential as a function of x, the quantity of protons. Upon oxidation (charge) from the open circuit voltage (OCV) (x = 4), the material releases 1 H+ (H3IrO4), while on the subsequent reduction (discharge) 1.75 H+ are inserted (H4.75IrO4), which are totally reversibly deinserted during the following oxidation (H3IrO4). From simple charge counting this implies that the material evolves back and forth from H3Ir5+O4 (charged) to H4.75Ir0.254+Ir0.753+O4 (discharged) leading to a reversible capacity of 175 mA.h/g. Moreover, this electrode shows a high‐energy efficiency (98.3%) as indicated by the small polarization between charge and discharge (25 mV at 1C).
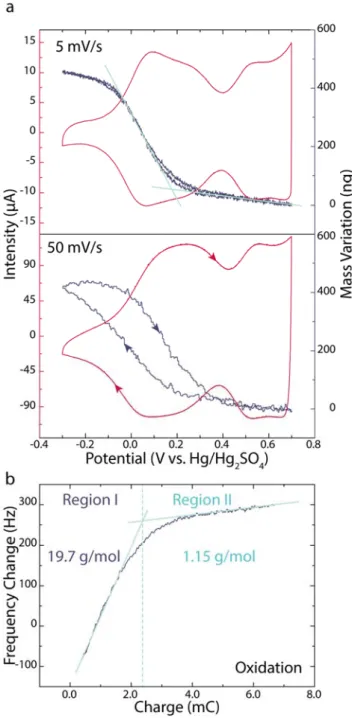
Figure 2. Electrochemical properties of HxIrO4 in acidic electrolyte. a Galvanostatic cycling at 1C as a
function of the proton stoichiometry and the Iridium oxidation state (obtained during the discharge). b Cyclic voltammetry at a scan rate of 5 mV/s.
Cyclic voltammetry experiments were also collected to characterize the protonic phase and two regions can be differentiated (Figure 2.b). The first one at low potentials (going from ‐0.2 to 0.39 V vs. Hg/Hg2SO4) and the second one at high potentials (0.39 to 0.7 V vs. Hg/Hg2SO4) will be referred hereafter as Region I and Region II, respectively. It is worth mentioning that pushing further the oxidation of the material is not limited by the proton deinsertion but rather restricted by the water splitting at 0.75 V vs. Hg/Hg2SO4.
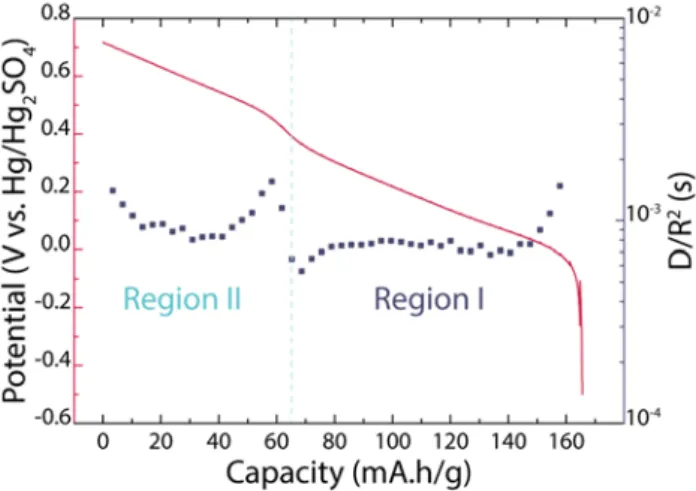
To get insights in the redox processes pertaining to the different regions and how they affect the iridium oxidation state, operando XAS measurements were carried out during the battery cycling at various stages of discharge and charge that is for different H+ content. The first derivative of the XAS data along with the electrochemical curve is reported in the Figure SI‐2. For meaningful comparison, we plotted the potential variation with respect to the Ir oxidation state and the H+ content. The results (Figure 2.a) indicate a smooth and continuous decrease of the Ir oxidation state from 5 to 3.25 as the cell is discharged from 0.7 V (x = 3) to ‐0.5 V (x = 4.75). The equality between the total change of the iridium oxidation state (≈ 1.75), as deduced by XAS, and the amount of inserted H+ (≈ 1.75) from electrochemical titration implies that the totality of the material present in each particle of the electrode is involved in the charge storage mechanism as in T‐Nb2O5 with lithium ions21. In contrast, it differs from the typical pseudocapacitive . where charge storage occurs mainly on the surface or near surface22–24. This finding, together with the BET low surface area (≈ 2 m2/g) highly questioned the core‐shell mechanism previously proposed7. Besides, we electrochemically estimated the diffusion coefficient of involved species through this material by Galvanostatic Intermittent Titration Technique (Figure SI‐3) and found a value of 10‐10 cm²/s for region II that is much higher than 10‐15 cm²/s reported for Li+ diffusion in LFP microparticles25 but still slower than 10‐5 cm²/s for the proton diffusion in water. Interestingly, this proton diffusion in H4IrO4 is much higher than the value previously reported by Kim et al.5 in amorphous TiO2 (10‐15 cm²/s). On that basis, the high reversibility of the redox processes can therefore be explained by a transport process non‐limited by diffusion. Interestingly, a higher diffusion coefficient was obtained through region II than in region I implying an easier diffusion of the involved species in the high potential region.
Electrochemical‐gravimetric investigation. Advanced electrogravimetric analyses combining QCM with
transfer properties in HxIrOy based electrodes. For these measurements, a thin layer containing 72 % of the active material was spray casted on the gold electrode of quartz resonators and then electrochemically tested to ensure that its electrochemical signatures were entirely preserved. In order to ensure that the mechanical properties of the spray‐coated electrodes were compatible with the EQCM measurements, the viscoelastic properties of the film were verified by EQCM with dissipation monitoring thanks to the protocol developed by the group of M.D. Levi and D. Aurbach.12,26 The results reported in Figure SI‐4 demonstrate the rigidity of the prepared electrodes when immersed in the electrolyte under Open‐Circuit Potential (OCP). Besides, the small variation (less than 2 %) of the motional resistance during CV (Figure SI‐5) proves the rigidity retention during the proton release/uptake; such testing protocol ensures that the Sauerbrey equation can be applied for extracting the values of mass change from the measured values of frequency change. After the validation of the gravimetric regime, the CV analyses at different scan rates were performed along with the QCM measurements to characterize the mass variation of the electrode during cycling and the results are displayed in Figure 3.a. Regarding the EQCM response of the thin layer at 5 mV/s, the electrochemistry shows the same features consisted of two distinct regions as for bulk electrodes. A reduction of the voltage window at the low potential is noted due to the contribution of the double layer on the underlying gold surface of the EQCM electrode. The QCM measurement simultaneously performed during CV at 5 mV/s indicates two potential‐dependent mass variation with two different slopes (Figure 3.a). A mass change occurs between ‐0.1 and 0.3 V vs. Hg/Hg2SO4 with a slope coefficient higher than that of the second mass change between 0.3 and 0.7 V vs. Hg/Hg2SO4. Note that these potential ranges correspond to Region I and Region II as defined previously for the bulk electrode (Figure 2.b). This result may indicate that different species may be involved in the charge compensation processes occurring in different potential domains. We observed that increasing the CV scan rate from 5 to 50 mV/s (Figure 3.a. lower panel) results in a constancy of the electrochemical signature in region II as opposed to region I which shows the appearance of a hysteresis phenomenon. This hysteresis is reminiscent of a difference in the kinetics between the involved species in the two regions of the voltammogram with the slower species being in Region I. Equally, a similar trend can be observed for the mass variation measurement which remains constant in Region II as opposed to Region I. Lastly, for sake of completion, the mass variation occurring before the Region I (Figure 3.a) corresponds to the reorganization of the double layer on the substrate demonstrated by the square shape of the electrochemical curve (in contrast with the Figure 2.b) as it will be further evidenced latter.
Figure 3. a EQCM measurement at 5 and 50 mV/s in acidic electrolyte. b M/z estimations from the slope of and during oxidation at a scan rate of 5 mV/s.
To obtain insights on the molar mass of the species taking part in the two regions of the voltammogram, the / value has been calculated by combining the Sauerbrey relationship and the Faraday law:
where F is the Faraday constant, z is the charge of the ion and M is the molar mass. In this calculation, the experimental values of and obtained at 5 mV/s (Figure 3.a, upper panel) and the (experimental sensitivity coefficient of QCM) have been used. For a scan rate of 5mV/s, a molar mass of 19.7 g/mol was found for region I as opposed to 1.15 g/mol for region II which is very close to that of proton. In contrast, the molar mass calculated for Region I is close to that of hydronium (H3O+) or proton accompanied with a water molecule. Altogether, these results indicate a potential‐dependent
mechanism involving species of different molar masses. Thus, this multi‐species process may have a different impact on the HxIrO4 structure depending on the potential range studied.
Figure 4. a The interlayer distance as a function of the applied potential obtained by Rietveld refinement of ex situ X‐Ray Diffraction on composite electrodes of H4IrO4. The red dot corresponds to the pristine
composite electrode. b Thermogravimetric analyses of a pristine composite electrode and a composite electrode discharged at ‐0.3 V vs. Hg/Hg2SO4.
Correlation of EQCM results with structural and compositional measurements. To tackle the structural
consequences of electrochemical cycling on H4IrO4, ex situ X‐ray diffraction was performed on composite electrodes recovered from 3‐electrodes Swagelok cells cycled to various depths of oxidation and reduction. The collected XRD patterns presented sharp peaks that were all indexed in a hexagonal 3 unit cell. Figure 4.a shows the variation of the interlayer distance (proportional to the c parameter) as a function of the potential. This interlayer distance does not vary linearly with the potential, it decreases more rapidly at low potential than at high potential, hence defining two domains. The two domains corresponding to regions I and II previously associated by EQCM to the uptake of [H+ (H2O)] and H+, respectively. Consistently, the larger variation of the c‐axis occurs over the potential region corresponding to the uptake of the larger species. To reinforce this result, thermogravimetric analyses have been performed on discharged composite electrodes (‐0.3 V vs. Hg/ Hg2SO4) and on the pristine composite electrode for comparison (Figure 4.b). The derivative of the mass variation with respect to the temperature (Fig. 4b dashed line) reveals the presence of a new population of water molecules at 175°C while the population at 220°C still remains for both pristine and discharged samples. As the water departure is associated to the structural hydroxyl groups, the observed lower temperature for water departure suggests the presence of another type of H2O, most likely water molecules incorporated between the layers, which are easier to be removed from the structure. From the mass loss, we deduced the stoichiometry: H4.6IrO4, 0.6 H2O for the reduced sample. It is worth to mention that a cycled and retrieved sample at x = 4 is demonstrating the same Thermogravimetric behavior as the pristine electrode. Altogether, EQCM, XRD and TGA measurements have well proved the incorporation of water molecules in the Region I, although larger changes in lattice parameters could have been expected. However, these techniques have not given direct indications on quantitative kinetic parameters associated to each species involved.
Species determination and associated kinetics (AC‐electrogravimetry). An alternative and
complementary characterization tool was employed which consists of in situ coupling Electrochemical Impedance Spectroscopy (EIS) and fast Quartz Crystal Microbalance (QCM), hence defining the so‐ called AC‐electrogravimetry. The measurements are performed at stationary potentials to which a sinusoidal small amplitude potential perturbation is superimposed, as is the case in typical EIS analyses. Then, AC‐electrogravimetry provides the outcome of a typical EIS, i.e. a frequency dependent transfer
function (TF), / or its concomitant TF called charge/potential TF / and an additional TF corresponding to the mass variation of the electrode in response to the potential perturbation, the so‐called mass/potential TF, / . Essential to this technique, alike typical EIS measurements, the data needs to be fitted with a suitable model to extract parameters related to the interfacial transfer. The fitting methodology has been described in several works27–31 and is recalled at the Supporting Information Part IV. This method was then employed for the Electrode‐Electrolyte Interface (EEI) analysis of HxIrO4 composite electrode as shown schematically in Figure SI‐6. The measurements were done at various stationary potentials in the same potential range used for the EQCM measurements (Figure 3). The main results of AC‐electrogravimetry are gathered in the Figure 5.
Figure 5. AC‐electrogravimetry analyses of H4IrO4. a Charge/potential / and b mass/potential
/ transfer functions at 0.15 V vs. Hg/Hg2SO4, both experimental and theoretical curves are
given. The different loops are labelled with the involved species. Fitting parameters are provided in Table SI‐1. c Evolution of kinetic parameters , interfacial transfer resistances and d relative concentration variation of each species, represented as a function of the potential. e Comparison of the mass variation by classical EQCM measurement (at 5 mV/s) with recalculated mass variation by AC‐ electrogravimetry.
The AC‐electrogravimetry results obtained at 0.15 V vs. Hg/Hg2SO4 (situated in Region I) are shown in Figure 5.a,b. The charge/potential transfer function, / , has been presented instead of classical impedance representation (i.e. potential/intensity, / ) where the following relation exists between the two: (with : the electrolyte resistance and : the double layer capacitance). This representation is more convenient to decouple the contribution of charged species, as one loop corresponds to one charged species. The collected spectrum of / at 0.15 V shows two loops implying that two charged species (ion 1 and ion 2) are involved in the charge compensation process (Figure 5.a). Then, to identify and clarify the contribution of the charged and also uncharged species (free electrolyte molecules), the experimental mass/potential transfer function / is considered (Figure 5.b). One big loop appears in the 3rd quadrant at medium and low frequencies. It is noted that the loops in the 3rd quadrant are characteristic for cation contribution or free solvent molecules in the same flux direction as cations. Another small contribution appears at high frequency domain in the 1st quadrant. The loops in this latter are characteristic for anion contribution or free solvent molecules in the same flux direction of anions (details are given in Figure SI‐7). The initial assessment of the experimental TFs in Figure 5.a,b indicates: the charge/potential transfer function demonstrates the contribution of two charged species without a clear identification (either two cations, two anions, or one cation and one anion) and the mass/potential transfer function shows a slight contribution of one anion or one solvent molecule at high frequency and one cation or one solvent molecule at medium frequency domain.
Then, the experimental TFs were fitted with a model described in the Supporting Information Part IV. Concerning experimental / TF, it was fitted with the theoretical equation given in Equation SI‐16, involving two charged species. A good agreement is evident between the experimental and theoretical curve in Figure 5.a, both in terms of shape and frequency distribution. The fitting parameters, (kinetics of transfer) and (related to interfacial transfer resistance) are obtained for the two ions. At this stage, it is not possible to identify these ionic contributions. To do so, the mass/potential transfer function / is fitted using theoretical equation given in Equation SI‐ 19. The and parameters previously estimated in the fitting of the / TF are used. Then, the molar mass of the species ( parameters in Equation SI‐19) were estimated which can lead to a
good fit of the experimental data. Several possibilities are considered. In the simpler case, one anion at high frequency and one cation at medium frequency are involved in the charge storage mechanism. The anion assignment is straightforward since perchlorate anions (ClO4‐) are solely present in the electrolyte during the measurements. For cations, there are two possibilities i.e. hydronium ion (H3O+) and proton (H+). Thus, two couples of charged species are possible: H+/ClO4‐ and H3O+/ClO4‐. Both have been tested to fit the mass/potential transfer functions but neither of them were satisfactory due to the impossibility to fit the massive loop in the 3rd quadrant (Figure 5.b) with the low value of molar mass of the possible cations. In contrast, a more robust model has been obtained by injecting free solvent molecules. This solvent contribution could not be distinguished at first glance due to not sufficiently different time constants between the water molecule and the cation species, which results in one merged loop in Figure 5.b.
Therefore, the model enlisting anions (ClO4‐) at high frequency, cations (H+) and solvent molecules (H2O) at medium and low frequency was taken into account. The outcome of this fitting of the experimental TFs with this model is displayed in the Figure 5.a,b with the corresponding species identified in the mass/potential TF. Fits with hydronium ion instead of the proton have been considered but the partial mass/potential TF (a cross‐check procedure of the fitting) where the cation contribution has been removed were not satisfactory (Figure SI‐8) which lead us to maintain the contribution of H+ as the cationic species in our model. Thus, as a whole, AC‐electrogravimetry has
confirmed the contribution of water molecule and protons in the charge compensation associated to the Ir5+ → Ir3.25+ redox process while refuting the hydronium ions possibility. Surprisingly, there is also a minute participation of the perchlorate ions to the overall process and their contribution will be discussed quantitatively in the following.
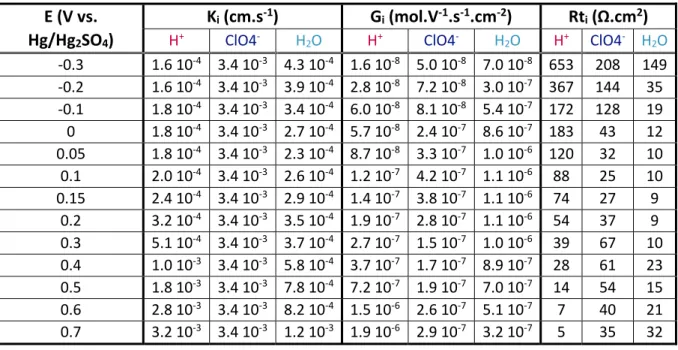
A similar fitting procedure described for the 0.15 V vs. Hg/Hg2SO4 (Figure 5.a,b) was carried out for all the other measurements performed in the potential range of ‐0.3 to 0.7 V vs. Hg/Hg2SO4. The results of the fitting procedure provided the (kinetics of transfer), (related to interfacial transfer resistance by 1 ) and parameter (molar mass, thus identification of the species). Although in different quantity and kinetics of transfer, the contribution of three different species (ClO4‐, H+ and H2O) is found to be persistent at all the potentials studied. The obtained values are shown in Figure 5.c. Independently of the potential, the perchlorate anion has always a faster kinetic than that of the proton and the water molecule. The proton kinetics in contrast is potential dependent: they are slower than that of the water molecule in the potential range below 0.2 V vs. Hg/Hg2SO4. Beyond this potential, the proton kinetic increases rapidly to become as rapid as the anion species. Meanwhile, the water molecule keeps an almost steady kinetic throughout the overall potential window. While interfacial transfer resistance (Rti) of proton species decreases constantly from low to high potential in Figure 5.c, note that of water shows a parabola shape with a minimum at 0.15 V vs. Hg/Hg2SO4 consistent with a water incorporation in the potential Region I, as suggested by the EQCM, TGA and ex
situ XRD results.
With a further calculation using the AC‐electrogravimetry data, the concentration variation of the three different species in the active material film as a function of the potential can be determined (Equation SI‐22) represented in the Figure 5.d). The H+ concentration varies nearly linearly with increasing potential, hence proving its steady insertion in both Regions I and II. The water concentration in contrast undergoes a huge drop over the short potential window (‐0.1 to 0.2 V vs. Hg/Hg2SO4) corresponding to Region I. Additionally it can be noted that the concentration variation related to anion (ClO4‐) is much smaller compared with cation and solvent concentration changes (Figure 5.d). Their fast kinetic led us to believe that their participation is rooted in their electroadsorption on the underlying gold surface of the EQCM and not as inherent part of the active material redox process. Even if the film at the surface of the electrode is homogeneous, some spots are indicating the contact between the electrolyte and the gold surface as shown in the SEM picture of the Figure SI‐9. Perchlorates are known for their lower affinity to be adsorbed on gold substrate that is why we selected them at the first place as counter ions instead of chlorides or sulfates.32 To ensure the robustness of our data analysis by AC‐electrogravimetry, through which we claimed that the EQCM global mass variation (in Figure 3.a and 5.e) can be deconvoluted into distinct contributions of ClO4‐, H+ and H2O, a verification procedure is applied. The mass variation of each species has been recalculated using their concentration change in Figure 5.d. The total of these contributions (re‐ calculated from AC‐electrogravimetry) was compared with the mass variation obtained by classical EQCM. The difference of active material mass loading between the film for classical EQCM and AC‐ electrogravimetry was taken into account in our calculations by a simple renormalization. These results nicely compare hence validating the model involving three different species contributing to charge compensation process in HxIrO4 composite electrode.
Conclusion
We have revisited the electrochemical activity of HxIrO4 in aqueous media with emphasis on its mechanism via the use of in situ additional analytical techniques EQCM and AC‐electrogravimetry together with operando XAS. Interestingly, by increasing the acidity of the leaching solution we could
synthesize from Li3IrO4 a water‐free protonated phase containing four protons (H4IrO4) as opposed to 3.4 for the H3.4IrO4 phase previously reported. Alike its predecessor, H4IrO4 was shown to reversibly exchange nearly 1.75 e‐ per formula unit with the charge being counterbalanced by Ir whose oxidation state reversibly switches from +V (H3Ir5+O4) to +III/+IV (H4.75Ir0.254+Ir0.753+O4), as deduced by XAS. However, cyclic voltammetry performed at different rates provided evidence for a potential‐ dependent mechanism with a threshold at 0.3 V vs. Hg/Hg2SO4. Additionally, ex situ XRD had revealed that the process was accompanied by a continuous but non‐uniform variation of the lattice parameter providing evidence for a bulk rather than a core‐shell mechanism, but also suggesting the presence of two different reacting species.
The potential dependence of the reacting species was confirmed by EQCM which also enables to identify, via mass determination, the two contributing species H+ and H+(H2O). Moreover, we could demonstrate that the proton was inserted on the whole potential window while water molecules are mostly inserted at low potentials as further confirmed by TGA analyses. Based on this evidence for water participation, the small c‐lattice parameter variation (c/3 = 0.12 Å) when water molecules participate in the insertion process is at first surprising. However, Srimuk and co‐workers33 have previously demonstrated the incorporation of one water molecule per sodium cation during the cycling of TiS2 in aqueous electrolyte measured by classical EQCM was solely accompanied by small variation of the interlayer distance (c = 0.06 Å). Based on this work and the recent findings of Tepavcevic and co‐workers34 who have studied the benefits of structural hydroxyl groups in enhancing the performance of electrochemically synthesized bi‐layer V2O5, we can propose a simple scenario to explain the small variation observed in the c‐axis. We believe that alike in V2O5, that protons in the interlayers forming structural hydroxyl groups maintain a sufficient interlayer spacing to permit the diffusion of cations and free solvent molecules as they preserve a solvating environment in the bilayer. However, to secure this explanation, it becomes essential to determine the water conformation and the proton position within this layer structure. Neutron experiments using acid‐d2 in deuterated water (D2O) are being planned. Lastly, AC‐Electrogravimetry was demonstrated to be of great help to provide insights into the origin of the kinetic difference spotted by cyclic voltammetry as it enabled the decoupling between electrode‐electrolyte interface processes pertaining to the insertion of the two species. For instance, we clearly show that the proton transfer resistance at the interface is not affected by the concomitant water incorporation. In contrast, it is more dependent on the charge repulsion created by the accumulation of protons within the material during insertion. Turning to the water, its presence is slowing drastically the proton insertion kinetic due to steric hindrance. In short it must be recognized that in protonic aqueous system, water molecules can improve the electrode electrochemical capacity by shielding the proton charge as it has been already proven for Mg35 or Zn‐ion36 nonaqueous batteries where water acts as an additive. However, in our study this shielding effect has a prize since it negatively affects the kinetic of the insertion process. To the best of our knowledge, no detrimental influence of the incorporated water has been proven on the kinetic of insertion, neither no other compounds have shown a dependency of the inserted species as function of the applied potential. Moreover, we demonstrated that the desolvation process happening at the Electrode‐Electrolyte Interface is the rate limiting step for insertion (Region I). Therefore, water molecules could play a key role, since replacing an organic by an aqueous solvation shell, should reduce desolvation energy at the interface. As it has been shown for Zn‐ion36 or LFP37 batteries, the water shell permits a faster insertion kinetic but contrary to our case, it is not accompanying the cation in the structure. The present results shed new light on H‐based mechanisms that may lead to systematically improved battery performances. Hence, the implementation of EQCM to those systems further demonstrated the richness of this analytical technique within the battery field.
References (1) Larcher, D.; Tarascon, J.‐M. Towards Greener and More Sustainable Batteries for Electrical Energy Storage. Nat. Chem. 2015, 7 (1), 19–29. https://doi.org/10.1038/nchem.2085. (2) Zeng, X.; Hao, J.; Wang, Z.; Mao, J.; Guo, Z. Recent Progress and Perspectives on Aqueous Zn‐ Based Rechargeable Batteries with Mild Aqueous Electrolytes. Energy Storage Mater. 2019, 20, 410–437. https://doi.org/10.1016/j.ensm.2019.04.022. (3) Liu, S.; Hu, J. J.; Yan, N. F.; Pan, G. L.; Li, G. R.; Gao, X. P. Aluminum Storage Behavior of Anatase TiO2 Nanotube Arrays in Aqueous Solution for Aluminum Ion Batteries. Energy Environ. Sci. 2012, 5 (12), 9743. https://doi.org/10.1039/c2ee22987k. (4) Liu, S.; Ye, S. H.; Li, C. Z.; Pan, G. L.; Gao, X. P. Rechargeable Aqueous Lithium‐Ion Battery of TiO2∕LiMn2O4 with a High Voltage. J. Electrochem. Soc. 2011, 158 (12), A1490–A1497. https://doi.org/10.1149/2.094112jes. (5) Kim, Y.‐S.; Kriegel, S.; Harris, K. D.; Costentin, C.; Limoges, B.; Balland, V. Evidencing Fast, Massive, and Reversible H + Insertion in Nanostructured TiO 2 Electrodes at Neutral PH. Where Do Protons Come From? J. Phys. Chem. C 2017, 121 (19), 10325–10335. https://doi.org/10.1021/acs.jpcc.7b02395. (6) Sun, W.; Wang, F.; Hou, S.; Yang, C.; Fan, X.; Ma, Z.; Gao, T.; Han, F.; Hu, R.; Zhu, M.; et al. Zn/MnO 2 Battery Chemistry With H + and Zn 2+ Coinsertion. J. Am. Chem. Soc. 2017, 139 (29), 9775–9778. https://doi.org/10.1021/jacs.7b04471.
(7) Perez, A. J.; Beer, R.; Lin, Z.; Salager, E.; Taberna, P.‐L.; Abakumov, A. M.; Simon, P.; Tarascon, J.‐M. Proton Ion Exchange Reaction in Li 3 IrO 4 : A Way to New H 3+ x IrO 4 Phases
Electrochemically Active in Both Aqueous and Nonaqueous Electrolytes. Adv. Energy Mater. 2018, 8 (13), 1702855. https://doi.org/10.1002/aenm.201702855. (8) Sauerbrey, G. Verwendung von Schwingquarzen Zur Wägung Dünner Schichten Und Zur Mikrowägung. Z. Für Phys. Hadrons Nucl. 1959, 155 (2), 206–222. (9) Dargel, V.; Shpigel, N.; Sigalov, S.; Nayak, P.; Levi, M. D.; Daikhin, L.; Aurbach, D. In Situ Real‐ Time Gravimetric and Viscoelastic Probing of Surface Films Formation on Lithium Batteries Electrodes. Nat. Commun. 2017, 8 (1). https://doi.org/10.1038/s41467‐017‐01722‐x. (10) Shpigel, N.; Levi, M. D.; Sigalov, S.; Girshevitz, O.; Aurbach, D.; Daikhin, L.; Pikma, P.; Marandi, M.; Jänes, A.; Lust, E.; et al. In Situ Hydrodynamic Spectroscopy for Structure Characterization of Porous Energy Storage Electrodes. Nat. Mater. 2016, 15 (5), 570–575. https://doi.org/10.1038/nmat4577. (11) Shpigel, N.; Levi, M. D.; Sigalov, S.; Daikhin, L.; Aurbach, D. In Situ Real‐Time Mechanical and Morphological Characterization of Electrodes for Electrochemical Energy Storage and Conversion by Electrochemical Quartz Crystal Microbalance with Dissipation Monitoring. Acc. Chem. Res. 2018, 51 (1), 69–79. https://doi.org/10.1021/acs.accounts.7b00477. (12) Dargel, V.; Levi, M. D.; Daikhin, L.; Aurbach, D. In Situ Tracking of Hydrodynamic and Viscoelastic Changes in Electrophoretically Deposited LiFePO4 Electrodes during Their Charging/Discharging. Russ. J. Electrochem. 2017, 53 (9), 980–993. https://doi.org/10.1134/S1023193517090038. (13) Shpigel, N.; Sigalov, S.; Levi, M. D.; Mathis, T.; Daikhin, L.; Janes, A.; Lust, E.; Gogotsi, Y.; Aurbach, D. In Situ Acoustic Diagnostics of Particle‐Binder Interactions in Battery Electrodes. Joule 2018, 2 (5), 988–1003. https://doi.org/10.1016/j.joule.2018.02.014. (14) Yang, Z.; Gewirth, A. A.; Trahey, L. Investigation of Fluoroethylene Carbonate Effects on Tin‐ Based Lithium‐Ion Battery Electrodes. ACS Appl. Mater. Interfaces 2015, 7 (12), 6557–6566. https://doi.org/10.1021/am508593s. (15) Yang, Z.; Dixon, M. C.; Erck, R. A.; Trahey, L. Quantification of the Mass and Viscoelasticity of Interfacial Films on Tin Anodes Using EQCM‐D. ACS Appl. Mater. Interfaces 2015, 7 (48), 26585–26594. https://doi.org/10.1021/acsami.5b07966.
(16) Kitz, P. G.; Lacey, M. J.; Novák, P.; Berg, E. J. Operando EQCM‐D with Simultaneous in Situ EIS: New Insights into Interphase Formation in Li Ion Batteries. Anal. Chem. 2019, 91 (3), 2296– 2303. https://doi.org/10.1021/acs.analchem.8b04924. (17) Gabrielli, C.; Keddam, M.; Torresi, R. Calibration of the Electrochemical Quartz Crystal Microbalance. J. Electrochem. Soc. 1991, 138 (9), 2657–2660. https://doi.org/10.1149/1.2086033. (18) Gabrielli, C.; Keddam, M.; Nadi, N.; Perrot, H. Ions and Solvent Transport across Conducting Polymers Investigated by Ac Electrogravimetry. Application to Polyaniline. J. Electroanal. Chem. 2000, 485 (2), 101–113. https://doi.org/10.1016/S0022‐0728(00)00093‐0. (19) Briois, V.; La Fontaine, C.; Belin, S.; Barthe, L.; Moreno, T.; Pinty, V.; Carcy, A.; Girardot, R.; Fonda, E. ROCK: The New Quick‐EXAFS Beamline at SOLEIL. J. Phys. Conf. Ser. 2016, 712, 012149. https://doi.org/10.1088/1742‐6596/712/1/012149. (20) Lesage, C.; Devers, E.; Legens, C.; Fernandes, G.; Roudenko, O.; Briois, V. High Pressure Cell for Edge Jumping X‐Ray Absorption Spectroscopy: Applications to Industrial Liquid Sulfidation of Hydrotreatment Catalysts. Catal. Today 2019, 336, 63–73. https://doi.org/10.1016/j.cattod.2019.01.081. (21) Augustyn, V.; Simon, P.; Dunn, B. Pseudocapacitive Oxide Materials for High‐Rate Electrochemical Energy Storage. Energy Environ. Sci. 2014, 7 (5), 1597–1614. https://doi.org/10.1039/c3ee44164d. (22) Long, J. W.; Swider, K. E.; Merzbacher, C. I.; Rolison, D. R. Voltammetric Characterization of Ruthenium Oxide‐Based Aerogels and Other RuO2 Solids: The Nature of Capacitance in Nanostructured Materials. Langmuir 1999, 15 (3), 780–785. https://doi.org/10.1021/la980785a. (23) Dmowski, W.; Egami, T.; Swider‐Lyons, K. E.; Love, C. T.; Rolison, D. R. Local Atomic Structure and Conduction Mechanism of Nanocrystalline Hydrous RuO2 from X‐Ray Scattering. J. Phys. Chem. B 2002, 106 (49), 12677–12683. https://doi.org/10.1021/jp026228l. (24) Liu, Y.; Zhou, F.; Ozolins, V. Ab Initio Study of the Charge‐Storage Mechanisms in RuO2‐Based Electrochemical Ultracapacitors. J. Phys. Chem. C 2012, 116 (1), 1450–1457. https://doi.org/10.1021/jp207616s. (25) Prosini, P. Determination of the Chemical Diffusion Coefficient of Lithium in LiFePO4. Solid State Ion. 2002, 148 (1–2), 45–51. https://doi.org/10.1016/S0167‐2738(02)00134‐0. (26) Shpigel, N.; Levi, M. D.; Aurbach, D. EQCM‐D Technique for Complex Mechanical Characterization of Energy Storage Electrodes: Background and Practical Guide. Energy Storage Mater. 2019, 21, 399–413. https://doi.org/10.1016/j.ensm.2019.05.026.
(27) Garcı ́a‐Jareño, J. J.; Sanmatı ́as, A.; Vicente, F.; Gabrielli, C.; Keddam, M.; Perrot, H. Study of Prussian Blue (PB) Films by Ac‐Electrogravimetry: Influence of PB Morphology on Ions Movement. Electrochimica Acta 2000, 45 (22), 3765–3776. https://doi.org/10.1016/S0013‐ 4686(00)00470‐9. (28) Gabrielli, C.; García‐Jareño, J. J.; Keddam, M.; Perrot, H.; Vicente, F. Ac‐Electrogravimetry Study of Electroactive Thin Films. I. Application to Prussian Blue. J. Phys. Chem. B 2002, 106 (12), 3182–3191. https://doi.org/10.1021/jp013924x. (29) Kim, L. T. T.; Gabrielli, C.; Perrot, H.; Garcia‐Jareno, J.; Vicente, F. Redox Switching of Prussian Blue Thin Films Investigated by Ac‐Electrogravimetry. Electrochimica Acta 2012, 84, 35–48. https://doi.org/10.1016/j.electacta.2012.06.049. (30) Arias, C. R.; Debiemme‐Chouvy, C.; Gabrielli, C.; Laberty‐Robert, C.; Pailleret, A.; Perrot, H.; Sel, O. New Insights into Pseudocapacitive Charge‐Storage Mechanisms in Li‐Birnessite Type MnO 2 Monitored by Fast Quartz Crystal Microbalance Methods. J. Phys. Chem. C 2014, 118 (46), 26551–26559. https://doi.org/10.1021/jp508543h. (31) Razzaghi, F.; Debiemme‐Chouvy, C.; Pillier, F.; Perrot, H.; Sel, O. Ion Intercalation Dynamics of Electrosynthesized Mesoporous WO 3 Thin Films Studied by Multi‐Scale Coupled Electrogravimetric Methods. Phys. Chem. Chem. Phys. 2015, 17 (22), 14773–14787. https://doi.org/10.1039/C5CP00336A.
(32) Kasuya, M.; Sogawa, T.; Masuda, T.; Kamijo, T.; Uosaki, K.; Kurihara, K. Anion Adsorption on Gold Electrodes Studied by Electrochemical Surface Forces Measurement. J. Phys. Chem. C 2016, 120 (29), 15986–15992. https://doi.org/10.1021/acs.jpcc.5b12683. (33) Srimuk, P.; Lee, J.; Budak, Ö.; Choi, J.; Chen, M.; Feng, G.; Prehal, C.; Presser, V. In Situ Tracking of Partial Sodium Desolvation of Materials with Capacitive, Pseudocapacitive, and Battery‐like Charge/Discharge Behavior in Aqueous Electrolytes. Langmuir 2018, 34 (44), 13132–13143. https://doi.org/10.1021/acs.langmuir.8b02485. (34) Tepavcevic, S.; Connell, J. G.; Lopes, P. P.; Bachhav, M.; Key, B.; Valero‐Vidal, C.; Crumlin, E. J.; Stamenkovic, V. R.; Markovic, N. M. Role of Structural Hydroxyl Groups in Enhancing Performance of Electrochemically‐Synthesized Bilayer V2O5. Nano Energy 2018, 53, 449–457. https://doi.org/10.1016/j.nanoen.2018.09.005. (35) Song, J.; Noked, M.; Gillette, E.; Duay, J.; Rubloff, G.; Lee, S. B. Activation of a MnO 2 Cathode by Water‐Stimulated Mg 2+ Insertion for a Magnesium Ion Battery. Phys. Chem. Chem. Phys. 2015, 17 (7), 5256–5264. https://doi.org/10.1039/C4CP05591H. (36) Kundu, D.; Hosseini Vajargah, S.; Wan, L.; Adams, B.; Prendergast, D.; Nazar, L. F. Aqueous vs. Nonaqueous Zn‐Ion Batteries: Consequences of the Desolvation Penalty at the Interface. Energy Environ. Sci. 2018, 11 (4), 881–892. https://doi.org/10.1039/C8EE00378E. (37) Zheng, J.; Hou, Y.; Duan, Y.; Song, X.; Wei, Y.; Liu, T.; Hu, J.; Guo, H.; Zhuo, Z.; Liu, L.; et al. Janus Solid–Liquid Interface Enabling Ultrahigh Charging and Discharging Rate for Advanced Lithium‐Ion Batteries. Nano Lett. 2015, 15 (9), 6102–6109. https://doi.org/10.1021/acs.nanolett.5b02379. Acknowledgments The authors would like to extend their appreciation to Paul E. Pearce for the Li3IrO4 synthesis and for the help with the Rietveld refinements. The authors would also like to thank Laura Albero Blanquer for carrying out the TGA measurements. The authors would like to express their gratitude to Camille Douard, Fanch Guillou and Thierry Brousse from the Institut des Matériaux Jean Rouxel in Nantes, France for lending us the operando XAS cell used for this study. J.‐M.T. acknowledges funding from the European Research Council (ERC) (FP/2014)/ERC Grant‐Project 670116‐ARPEMA. This work is based on experiments performed on the ROCK beamline at Soleil Synchrotron (France) financed by the French National Research Agency (ANR) as part of the “Investissements d’Avenir” program (reference: ANR‐ 10‐EQPX‐45). FEGSEM & EDX instrumentation was hosted at the Institut des Matériaux de Paris Centre (IMPCFR2482) and was funded by Sorbonne Université, CNRS and by the C’Nano projects of the Région Ile‐de‐France.
For Table of Contents Only
Supplementary Information
Elucidating the Origin of the Electrochemical Capacity in a Proton‐Based
Battery H
xIrO
4via Advanced Electrogravimetry
Pierre Lemaire†,‡,§, Ozlem Sel¦,*, Daniel Alves Dalla Corte†,§, Antonella Iadecola§, Hubert Perrot¦, Jean‐ Marie Tarascon†,§,* † Chimie du Solide et de l’Energie, UMR 8260, Collège de France, 11 Place Marcelin Berthelot, 75231 Paris Cedex 05, France ‡ Sorbonne Université, 4 Place Jussieu, 75005 Paris, France § Réseau sur le Stockage Electrochimique de l’Energie (RS2E), CNRS FR 3459, 33 Rue Saint Leu, 80039 Amiens Cedex, France ¦ Sorbonne Université, CNRS, Laboratoire Interfaces et Systèmes Electrochimiques, LISE, 75005 Paris, France * Corresponding authors Jean‐Marie Tarascon: jean‐marie.tarascon@college‐de‐france.fr Ozlem Sel: ozlem.sel@upmc.fr Part I: X‐ray Absorption Spectroscopy.
Figure S1. Operando XAS data treatment and experimental setup. a Picture of the lab‐made electrochemical cell for operating operando XAS experiments, using carbon paper loaded with 7
mg/cm2
geo of HxIrO4 as working electrode, porous graphite rod as counter electrode and Hg/Hg2SO4
(saturated K2SO4) as reference electrode. b Determination of the White Line energy thanks to derivative
of the normalized absorption spectrum with the binding energy for which the curve is equal to zero.
Figure S2. Follow‐up of the White Line energy (fingerprint of the Ir oxidation state) thanks to the derivative of the normalized absorption spectra as a function of the galvanostatic charge/discharge of
the HxIrO4 phase in acidic electrolyte.
Part II: Diffusion coefficient determination.
Diffusion coefficient of the involved species was determined by Galvanostatic Intermittent Titration Technique (GITT) on self‐standing PTFE electrodes in three‐electrode PFA Swagelock cell. The GITT procedure consists of a series of current pulses at 1C during 2 minutes, each followed by a relaxation time of 30 minutes, in which no current passes through the cell. During a discharge, the cell potential quickly fells to a value proportional to ohmic drop (iR), where R is the sum of the uncompensated and charge transfer resistances. Then, the potential slowly decreases, due to the galvanostatic discharge pulse, in order to maintain a constant concentration gradient. During the relaxation time, the composition in the electrode tends to become homogeneous by protons diffusion. Consequently, the potential suddenly increases by a value proportional to iR, and then it slowly increases, until the electrode is in equilibrium (i.e., when dE/dt ≈ 0) and the open circuit potential of the cell is reached.