• Aucun résultat trouvé

Analysis of membrane fouling during cross-flow microfiltration of wine

N/A
N/A
Protected

Academic year: 2021

Partager "Analysis of membrane fouling during cross-flow microfiltration of wine"

Copied!
12
0
0

Texte intégral

Loading

Figure

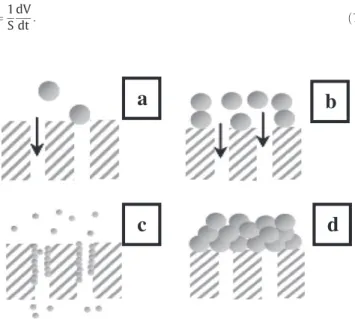
Fig. 1. Illustration of the fouling mechanisms considered by the blocking laws.
Fig. 5 shows the experimental data for the permeate flux as a function of filtered volume for filtered wines (FW) added with  dif-ferent concentrations of tannins (1.25 g/l and 2.5 g/l) filtered at 2 different transmembrane pressures (ΔP): 0.5 and 1 × 10 5 Pa
Fig. 4. Summary of dead-end microfiltration experiments.
Fig. 5. Permeate flux profiles of FW wines loaded with different concentrations of tan- tan-nins (—: 0.5×10 5 Pa; ‐‐‐: 1×10 5 Pa).
+4

Références

Documents relatifs