To link to this article : DOI:10.1016/j.mvr.2013.11.003
http://dx.doi.org/10.1016/j.mvr.2013.11.003
To cite this version : Lorthois, Sylvie and Lauwers, Frederic and Cassot,
Francis Tortuosity and other vessel attributes for arterioles and venules of the
human cerebral cortex. (2014) Microvascular Research, vol. 91 . pp. 99-109.
ISSN 0026-2862
OATAO is an open access repository that collects the work of Toulouse researchers
and makes it freely available over the web where possible.
This is an author-deposited version published in :
http://oatao.univ-toulouse.fr/
Eprints ID : 10666
Any correspondance concerning this service should be sent to the repository
Tortuosity and other vessel attributes for arterioles and venules of the
human cerebral cortex
Sylvie Lorthois
a,b,⁎
, Frederic Lauwers
c,d,e, Francis Cassot
c,daCNRS, IMFT (Institut de Mécanique des Fluides de Toulouse), Allée Camille Soula, F-31400 Toulouse, France
bUniversité de Toulouse, INPT, UPS, IMFT (Institut de Mécanique des Fluides de Toulouse), Allée Camille Soula, F-31400 Toulouse, France cINSERM, UMR 825, Cerebral Imaging and Neurological Handicaps, Toulouse F-31000, France
dUniversité Toulouse III Paul Sabatier, UMR 825, Toulouse F31000, France
eDepartment of Anatomy, LSR44, Faculty of Medicine Toulouse-Purpan, Toulouse, France
a b s t r a c t
Despite its demonstrated potential in the diagnosis and/or staging of disease, especially in oncology, tortuosity has not received a formal and unambiguous clinical definition yet. Using idealized three-dimensional vessel models (wavy helices) with known characteristics, we first demonstrate that, among various possible tortuosity indices, the standard deviation of the curvature Ksdbest satisfies i) scale invariance and ii) positive monotonic
re-sponse with respect to the amplitude and frequency of vessel oscillations. Ksdcan thus be considered as a robust
measure of tortuosity. On the contrary, indices previously considered as tortuosity metrics, such as the distance factor metrics (DFM), are highly scale dependent and inappropriate for that purpose.
The tortuosity and other vessel attributes (curvature, length-to-diameter ratio (LDR),…) of more than 15,000 cortical vessels are subsequently studied, establishing their statistical properties as a function of the vessel nature (arterioles versus venules) or topological order (hierarchical position). In particular, arterioles have a higher LDR than venules, but the two kinds of vessels have the same mean curvature and tortuosity. Moreover, the lower the order of the vessels, i.e. the nearer to the capillary network, the more curved and tortuous they are. These results provide an essential reference both for diagnosis and for a future large reconstruction of the cerebral microvas-cular network.
Introduction
Vascular architecture, particularly of cerebral microvessels, has pro-found implications upon both health and disease. In fact, quotingBullitt et al. (2005a), “almost every disease from cancer to the common cold af-fects blood vessel attributes (vessel number, radius, tortuosity and branching pattern)”. Vascular alterations associated with pathology are attracting attention (Lu et al., 2004) with pathological angiogenesis being a recognized hallmark of disease (Carmeliet, 2005; Carmeliet and Jain, 2000; Fukumura and Jain, 2008). Furthermore, cerebral microcir-culation is linked to many other areas such as functional neuroimaging (Lorthois et al., 2011a,b; Uludağ et al., 2009; Weber et al., 2008), Alzheimer's disease (Meyer et al., 2008), vascular occlusions in cerebro-vascular disease (Nishimura et al., 2007), and blood vessel morphologic changes during growth and subsequent treatment of brain tumors (Baish and Jain, 2000; Baish et al., 1996; Bullitt et al.,
2005b, 2007b; Jain, 2005). Thus, providing accurate and comprehen-sive measurements of vascular morphology is essential in the analy-sis of vascular formation and structural adaptations under physiological (development, growth and exercise) or patho-physiological conditions (inflammation, hypertension, diabetes, obesity and metabolic syn-drome, cancer) (Jonk et al., 2007; Levy et al., 2008; Murfee and Schmid-Schonbein, 2008; Patton et al., 2005; Pries and Secomb, 2008; Pries et al., 2005; Wiernsperger et al., 2007).
In this context, a wide variety of morphometric parameters, or vessel attributes, are potentially available for automated analyses. For exam-ple, a user-interactive software quantifying local vessel diameter, tortu-osity, fractal dimension, and avascular spacing of two-dimensional (2D) digitized vascular trees is now commercially available (Vickerman et al., 2009). Among these parameters, vessel tortuosity has a demonstrable importance in the diagnosis of many diseases. For example, the clinical recognition of abnormal vascular tortuosity can lead to the diagnosis of tumors and retinopathies, among other conditions (Johnson and Dougherty, 2007).
Regarding tumors, malignancy induces characteristic vascular mor-phological changes, described as “…a profound sort of tortuosity, with many smaller bends upon each larger bend” (Baish and Jain, 2000). This abnormal tortuosity may be related to increases in nitrous oxide
⁎ Corresponding author at: Institut de Mécanique des Fluides de Toulouse, Allée du Prof. Camille Soula, F-31400 Toulouse, France.
induced by VEGF (Folkman, 2000) and is found in a wide variety of ma-lignant tumors including those of the breast (Huang et al., 2008; Lau et al., 1999), brain (Burger et al., 1991), colon (Siemann, 2002), lung (Helmlinger et al., 2002), and skin (Astner et al., 2008). The widespread view is that these microvascular shape abnormalities and severe abnor-mal network architecture increase the geometric resistance to blood flow – which in general is significantly higher in tumors than in normal tissues – and decrease overall perfusion (Baish et al., 1996; Jain, 1988). The resulting – heterogeneous and/or compromised – inadequate blood supply hinders the delivery of therapeutic agents to tumors and causes an abnormal microenvironment within them, a feature that se-lects out more aggressive and metastatic cancer cells and favors tumor growth. However, a recent study (Gaustad et al., 2009) suggested that differences in blood supply between individual tumors growing in a mouse dorsal window chamber mainly are a consequence of differences in the geometric resistance of the tumor-supplying arteries (i.e., differ-ences in vessel tortuosity and diameter) rather than features of the tumor microvascular network.
Vessel shape abnormalities indeed extend far beyond tumor con-fines and involve initially healthy vessels coursing in the tumor vicinity (Li et al., 2000). It is possible to visualize these larger vessels using high-resolution non-invasive magnetic resonance angiography (MRA), as demonstrated by Bullitt et al. in a series of papers on the breast and brain tumors (Bullitt et al., 2003, 2005a,b, 2006a,b, 2007a,b). In these papers, a new “Malignancy Probability” equation, based on a quantita-tive, statistical measure of vessel tortuosity derived from two different tortuosity indexes, has been introduced. On this basis, all but one of 30 human brain tumors have been successfully classified as benign or malignant, by reference to histological evaluation. In a study on choroid plexus carcinoma in genetically engineered mice, these analyses of ves-sel tortuosity correctly identified emerging malignancy even in very small lesions (0.3 to 1 mm3in size), which had posed problems for other diagnosis modalities (Bullitt et al., 2006b). Thus, vessel shape may predict tumor response several months in advance of traditional methods. Interestingly, abnormal vessel tortuosity appears to resolve rapidly with effective treatment (Baish et al., 1996; Jain, 2001; Li et al., 2000), making the approach potentially useful for therapeutic develop-ment and assessdevelop-ment in preclinical murine models and for rapid assess-ment of treatassess-ment in human subjects.
As such, analysis of vessel tortuosity may offer a complementary approach to magnetic resonance perfusion imaging: assessment of ma-lignant tumors by analyzing their vascular tortuosity has already been performed on images acquired from 3D power Doppler ultrasound (e.g. ovarian mass,Sladkevicius et al., 2007) and in vivo fluorescence confocal microscopy (e.g. skin cancer,Astner et al., 2008; Lademann, 2008).
Regarding retinopathies, ophthalmologists use morphological features of the retinal vascular tree as signs suggesting their onset or prognosis. For example, morphological features of the retinal vascu-lar tree are often the early symptoms indicating the onset of hyperten-sive retinopathy (Grisan et al., 2008). Tortuosity is also increased in diabetes, although it predominantly affects venules (Sutter and Helbig, 2003). Moreover, in plus disease, which is a major component of the international classification for retinopathy of prematurity (ROP) and is characterized by arteriolar tortuosity and venous dilation, computer-based image analysis systems have shown a higher diagnosis accuracy than ROP experts (Gelman et al., 2007; Kemper et al., 2008).
In addition, in the retinal microcirculation, the arteriolar length-to-diameter ratio (LDR) has been found to increase in hypertension (Wong et al., 2001, 2002, 2003) and, very recently, in Alzheimer's disease (AD) (Frost et al., 2013). This increase was associated with increased stroke mortality (Witt et al., 2006), suggesting that evaluation of the retinal microvasculature may be a useful predictor of target organ damage and cardiovascular risk. An unexpected relationship between reduced tortuosity and death from ischemic heart disease (IHD), inde-pendent on blood pressure, has also been observed (Witt et al., 2006).
Reduction of venous tortuosity has also been demonstrated in AD (Frost et al., 2013).
Other clinical applications have been proposed in neurology, where a morphometric analysis of arteriolar tortuosity in human cerebral white matter demonstrated changes associated with clinical vascular dementia (Brown et al., 2009).
Despite its demonstrated potential in the diagnosis and/or stag-ing of disease, tortuosity has not received a formal and unambiguous clinical definition yet. The clinical findings reviewed above indeed rely on diverse methodologies used for measuring the microvascular changes, either qualitatively or quantitatively: several possible in-dexes have been proposed, including the distance factor metric (Hart et al., 1999; Smedby et al., 1993), the number of inflection points (Bullitt et al., 2003), the angle change along segments (Bullitt et al., 2003; Gelman et al., 2007) and various line integrals of local curvature values (Hart et al., 1997, 1999), but none has gained universal acceptance or utility. Results derived from these different measures are sometimes contradictory or even directly op-posite, as noted byBullitt et al. (2005b). As they point out, “it might be desirable to formulate a single tortuosity metric capable of detect-ing both large and small scale tortuosity abnormalities at the same time, but we have not yet been able to do so.”
Thus, in spite of the promising results obtained by this group, the question of finding an index that adequately matches intuitive no-tions of tortuosity remains open. Adding to the difficulty is the fact that tortuosity does not have a formal clinical definition. ForHart et al. (1997, 1999)andJohnson and Dougherty (2007), several intui-tive properties like reproducibility, invariance to affine transformations and compositionality need to be satisfied in order to yield a clinically meaningful tortuosity measure. In addition to these properties, a mono-tonic relationship with respect to amplitude and frequency of the vessel bends is needed (Grisan et al., 2008).
Hart et al. (1999)described seven measures of tortuosity and test-ed their ability to classify the data extracttest-ed from retinal images in tortuous or non-tortuous vessels. While no single tortuosity measure was clearly superior, they recommended a total squared curvature measure. However, as with most of the previous research until re-cently, their analysis was applied to 2D images and is therefore inad-equate for analyzing 3D data (O'Flynn et al., 2007).Johnson and Dougherty (2007)also proposed a mean square curvature measure. Their approach was tested in 3D on model objects, by manipulating the parameters of simple noisy helices simulated by adding small random components to the helix radius. More recently, they applied their metrics to abdominal aortograms of low tortuosity and established their validity through a strong observed correlation with the ranking of an expert panel of three vascular surgeons (Dougherty and Johnson, 2008).O'Flynn et al. (2007)introduced a method for the three-dimensional geometric characterization of the arterial vasculature from MR angiograms, with possible applica-tions in planning of endovascular interventional procedures and in improving endovascular device design and endograft sizing. Howev-er, in this work, the centerline data are smoothed by using a ninth-order polynomial approximation. If this is reliable in large and rela-tively straight arteries such as the aorta, it would probably become much less accurate when applied to the tortuous vessels of brain microcirculation.
Ultimately, despite the importance of abnormal vessel attributes in clinics, little is known about the statistical properties of vessel at-tributes or branching patterns, even in healthy conditions. In partic-ular, it is unclear whether the statistical properties of various vessel attributes fit a Gaussian distribution, and how dependent upon ana-tomical location they might be (Bullitt et al., 2005a). These uncer-tainties impair our ability to reveal signatures of normal vascular trees (Cassot et al., 2010) and to design studies that compare pa-tients with suspected disease to a database of healthy subjects (Bullitt et al., 2005a).
Therefore, the first objective of this paper is to propose a three-dimensional methodology yielding new and more robust indexes of tortuosity and curvature. For that purpose, idealized vessel models are considered. Using such idealized vessels, with known characteristics, the validity and geometrical significance of this new methodology can be checked and discussed by comparison with various indexes pro-posed in the literature. The second objective is to apply this methodol-ogy to a large microvascular database of the human cerebral cortex. This will allow the statistical data needed as reference or rationale for further assessment of vessel attributes under pathological conditions for the purpose of clinical diagnosis and disease staging to be obtained. For that purpose, a 3D quantitative anatomical data library on the architec-ture of the microcirculation of the human cerebral cortex, previously produced by our group (Cassot et al., 2006), is exploited.
This same data library has previously been used with success to as-sess the general morphometric and topological characteristics of the ar-teriolar, venular and capillary cortical networks (Cassot et al., 2006; Lauwers et al., 2008), their multi-scale properties (Cassot et al., 2009; Lorthois and Cassot, 2010) and the variations of microvascular density as a function of cortical depth (Lauwers et al., 2008). These data have fed a significant number of simulation studies. These studies include blood flow simulations by our group in the corresponding anatomical network, which enabled to study brain blood flow regulation in the con-text of functional neuroimaging (Lorthois et al., 2011a,b). They also in-clude modeling approaches of blood flow and oxygen transfers based on the generation of synthetic vascular architecture (Su et al., 2012; Linninger et al., 2013). In these papers, however, straight vessels were considered, while the influence of tortuosity on oxygen transfers has been demonstrated (Goldman and Popel, 2000).
In the present paper, we consider the vessel attributes (curvature, tortuosity, length-to-diameter ratio) of cortical vascular trees, establish-ing their statistical properties as a function of the vessel nature (arteri-oles versus venules) or the segment topological order (hierarchy). Materials and methods
Creation of a microvascular network database of the human cerebral cortex The procedures used for image acquisition, mosaic construction and vessels segmentation have been described in detail elsewhere (Cassot et al., 2006) and are briefly outlined below.
Data acquisition
Digital three-dimensional images of the intra-cortical vascular net-work were obtained from thick sections (300 μm) of India ink-injected human brain (Duvernoy et al., 1981) by confocal laser microscopy. The specimen used in this study was a 60-year old female who died from an abdominal lymphoma with no evidence of vascular or cerebral dis-ease. The secondary cortex next to the collateral sulcus in the right tem-poral lobe was the anatomical region chosen for this study owing to the outstanding quality of the injection in this area. While it is noteworthy that anatomical preparation is likely to induce shrinkage, generating an underestimation of morphometric data (length, diameter), the tech-nique of injection, used to “mark” the vessels and give a complete and physiological-like perfusion of the whole vascular system of the brain, is likely to generate uniform shrinkage in the specimen.
The entire volume of the cortex on both sides of the sulcus (fusi-form and parahippocampal gyrii) was digitized on 3 adjacent coronal sections. Each elementary dataset contained 70 sections of 512 × 512 pixels, with a voxel size of 1.22 × 1.22 × 3 μm.
These individual datasets covering a large zone were then summat-ed in a special data object callsummat-ed an image mosaic and realignsummat-ed to en-sure that the vessels in the overlapping area matched perfectly. Ten mosaics were so constructed to cover the entire cortex area chosen cor-responding to a cortical volume of 28.6 mm3.
3D microvascular network segmentation and extraction of tree-like vessels Each image mosaic contains a large quantity of data (typically sever-al gigabytes) and is too large to be processed at once in the memory of a standard personal computer. Adapted methods were developed to ade-quately process such images (Cassot et al., 2006; Fouard et al., 2006). Their main feature and advantage are that they process data locally while preserving global properties. They allowed the extraction of ves-sel center lines and the computation of distance maps which measure the distance between any points within a vessel to the nearest vessel wall, providing for each center line point a good estimation of the vessel radius. Finally, a graph representation (skeleton) of the 3D microvascu-lar network was obtained for each mosaic and a value of the vessel radi-us estimated from the distance map was attached to every vertex. For further processing of the morphometric data and analysis of the topolo-gy, the skeleton lineset was stored in an ASCII file. Each line of this file corresponds to a vertex (center line point) and contains its x, y, z coor-dinates and the radius of the vessel at this point. The vertices of a given segment, i.e. a blood vessel between two successive bifurcations, are listed successively, and vessel segments are separated.
Next, to account for the dual nature of the network architecture (Lorthois and Cassot, 2010), the tree-like arterioles and venules were separated from the whole skeleton, which also includes capillary ves-sels. To extract a vascular tree, its origin in the sulcus was identified and all the paths from this origin through vessel segments in which re-sistance to flow is lower than a prescribed value were detected (Cassot et al., 2006). Each tree was classified as arterial or venous according to its morphological features, following Duvernoy's classification (Duvernoy et al., 1981; Reina-De La Torre et al., 1998).
Vessel taxonomy
The topology of these vascular trees was analyzed according to the diameter-defined Strahler taxonomy (Kassab et al., 1993). This taxono-my produced a hierarchical ranking of vessel segments, assigning them an order from 0, for the “terminal” branches closest to the capillaries, to a maximal rank for the branches closest to the pial tree origin. In many instances, several vessel segments of the same order are connected in series: their combination is then called an element (Cassot et al., 2006). Derivation of geometrical parameters
In order to remove any spurious local curvature discontinuity of the vessel which may arise from voxel-sized artefacts or from the segmenta-tion process, centerline coordinate data of each vascular segment were smoothed prior to 3D geometrical analysis. For this purpose, a simple five-points weighted local smoothing, centered on each vertex, was applied to each coordinate of the centerline points (Abramovitz and Stegun, 1972). Arc length s was then determined at each vertex. This smooth curve description was then resampled using cubic spline interpolation to yield vertices at constant intervals (Δs = 0.5 μm) along the curve length. First, second and third derivatives with respect to the arc length s were derived for each vertex of the resampled curves. This smoothing and interpolating process led to define parameterized centerline curves for each vascular segment in the form r(s) = (x(s),y(s),z(s)) with their corresponding derivatives r′(s) = (x′(s),y′(s),z′(s)), the unit tangent vector (Korn and Korn, 2000), r″(s) and r‴(s).
Vessel curvature and torsion
The Frenet frame (t, b, n) at each vertex is straightforwardly defined using the following formulae (Korn and Korn, 2000):
t ¼ r′ ; b ¼ r′" r″= r″ ! ! ! ! ! ! ; n ¼ b " t;
Provided with the parametric representation of the curve defined above and using the Frenet–Serret theory of differential geometry, cur-vature κ and torsion τ can be derived using standard formulas (Korn and Korn, 2000): κ ¼ r″ð Þs ! ! ! ! ! ! and τ ¼ r′ð Þ; rs ″ð Þ; rs ‴ð Þs h i r″ð Þs ! ! ! !2
where [r′(s),r″(s),r‴(s)] denotes a scalar triple product.1These
param-eters are computed at all vertices of the interpolated centerline curves. Assessment of vessel tortuosity
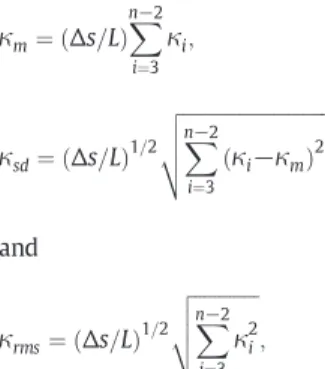
In order to quantify the tortuous nature of vessels, various line inte-grals of local curvature values have previously been used. In the present work, the curvature average value by unit length (κm) as well as its stan-dard deviation (κsd) and root mean square (κrms) are computed for each segment according to:
κm¼ Δs=Lð Þ X n−2 i¼3 κi; κsd¼ Δs=Lð Þ1=2 ffiffiffiffiffiffiffiffiffiffiffiffiffiffiffiffiffiffiffiffiffiffiffiffiffiffiffiffiffi X n−2 i¼3 κi−κm ð Þ2 v u u t and κrms¼ Δs=Lð Þ1=2 ffiffiffiffiffiffiffiffiffiffiffiffiffi X n−2 i¼3 κ2i v u u t ;
where L is the total path length of the vascular segment.
Other indexes of tortuosity have been defined such as the “Distance Metric” (DM) defined as the total path length L of a vessel divided by the linear distance between its endpoints Dex(Bullitt et al., 2003, 2005a), or the “Distance Factor Metric” (DFM) which measures the relative lengthening of a vessel and is simply defined as DFM = DM-1 (O'Flynn et al., 2007). The “Inflection Count Metric” (ICM) multiplies the number of inflections (plus one) present in a 3D space curve by the DM (Bullitt et al., 2003, 2005a). The “Sum of Angles Metric” (SOAM) sums the unsigned angular variations between successive points along a sampled space curve and normalizes by path length2
(Bullitt et al., 2003, 2005a).
Another widely used shape factor: the length-to-diameter ratio
A simple and robust way to characterize the vessel shape is to com-pute the length-to-diameter ratio for each segment and to analyze the statistical distributions of this ratio on the whole segments and on sub-groups defined as a function of their nature and taxonomy.
Validation using helical curves
Circular helices (x = R cos t; y = R sin t; z = λt; t ∈ [0,tmax]) have uniform curvature and torsion given by κ ¼ R
R2þλ2 and τ ¼R2þλλ2.
Moreover, their path length (tmax
ffiffiffiffiffiffiffiffiffiffiffiffiffiffiffiffi R2þ λ2 p
) is proportional to the max-imal range of the parameter t. For further analysis, we introduce the angular extension A of the helix in the Oxy plane as multiples of π/4 angles (i.e. tmax= A. π/4).
To simulate “smaller bends over a larger bend” (Baish and Jain, 2000), we added a sinusoidal component to the constant radius R so that R = R0+ α sin 2kt, where α is the amplitude of the oscillations and k is their angular frequency. Such wavy helices, some of which are displayed inFig. 1, are fully defined by the following set of five param-eters (R0, λ, α, k, A). In this particular case, and more generally when the coordinates of a segment can be described analytically, the curva-ture can be calculated semi-analytically, which can then be used to val-idate the various indexes and the numerical methods proposed above. Finally, noisy vessels (seeFig. 1) were simulated by adding a random component β = (0.5 − ρ)/2χwhere ρ is a random number between 0 and 1 and χ = 1, 2 or 3 for a signal-to-noise ratio of 6, 9 and 12 dB, respectively.
Statistical data analysis
A standard statistical analysis was applied to the vessel attributes populations. To determine statistical significance of differences, espe-cially between the mean or median values of the vessel attributes as a
1Note that these expressions are different from the expressions of curvature and
tor-sion used byO'Flynn et al. (2007)(see Eqs. 3 and 5 in their paper). However, these equa-tions can be simplified by taking into account that |r′(s)| = 1.
2Note that, with an alternative definition using the signed angular variations instead of
the unsigned ones, the SOAM would be very close to the mean curvature, as the signed an-gular variation between successive points dα can be approximated by ds/r(s), r(s) being the local radius of curvature.
Fig. 1. Examples of wavy helices (a to d) and effect of noise (e). R0= 30; λ = 6. (a) T = 5,
k = 4, α = 2; (b) T = 2, k = 8, α = 6; (c) T = 3, k = 3, α = 3; (d) T = 8, k = 6, α = 1; (e) T = 4, k = 4, α = 2, S/N = 6 dB. Small spheres show inflection points and large spheres local maxima.
function of the nature and taxonomy, we carried out various statistical analyses, including paired or unpaired Student t tests, Kruskal–Wallis and Wilcoxon–Mann–Whitney non-parametric tests. From the histo-grams of local curvature for each segment, the probability densities (functions) of the curvature were derived for subgroups gathered ac-cording to their taxonomy, i.e. their order index.
Results
Adequacy of various indexes of tortuosity: assessment on model vessels The accuracy of the numerical methods presented above has first been tested by comparing the computed values of the six potential in-dexes of tortuosity defined above (κm, κsd, κrms, DFM, SOAM and ICM) for circular helices to their analytical values. Then, the significance of these six parameters as tortuosity indexes, and their robustness to noise, has been studied using wavy helices.
Such wavy helices are defined by five parameters (R0, λ, α, k, A) (see
Materials and methods). In the whole following, the values of the mean helix radius R0and pitch 2πλ are fixed to 30 and 37.7 (arbitrary units), respectively. Sets of wavy helices have been generated by varying α, k and Α by unit steps in the following ranges: k∈[0–16]; α∈ [0–10]; A ∈[1,8], with a constant sampling Δt = π/256. For each model vessel corresponding to a particular combination of k, α, and A, the same six parameters have been computed.
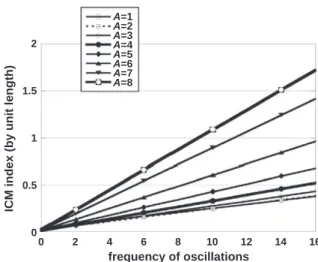
It is first noteworthy that neither DFM nor ICM are scale invariant: for a given amplitude and frequency of the oscillations superimposed to the circular helix, their value depends on the helix angular extension A (Figs. 2 and 3). The strong variations of DFM with the helix angular ex-tension (Fig. 2) are consistent with the influence of segment recurrence, a known drawback of this widely-used tortuosity index. Some authors (Bullitt et al., 2003) proposed the ICM index to overcome this difficulty. However, while the ICM by unit length is almost independent on the os-cillation amplitude, it is still highly dependent on the helix angular ex-tension and on the oscillation frequency (Fig. 3): ICM thus remains highly scale dependent.
By contrast, Km, SOAM, Ksdand Krmsare scale invariant. As suggested byGrisan et al. (2008), a relevant index of tortuosity would behave monotonically as a function of the oscillation amplitude and fre-quency, i.e. it should increase i) with the frequency for a given ampli-tude and ii) with the ampliampli-tude for a given frequency. Condition i) is fulfilled by the four scale invariant indexes (Km, SOAM, Ksdand Krms), but not condition ii), seeFig. 4a–b, where the dashed lines correspond to the zeros of the partial derivatives of each index with respect to the amplitude. Each line delineates two areas: under the line, the corre-sponding shape parameter increases monotonically; above the line it decreases. Within the lower left area, the shape factor fulfills condition ii) whatever the amplitude and the frequency. Within the upper right area, this condition is not met. Excepting at very low frequencies (k b = 3), the mean curvature (Km) does not vary in a monotonic fash-ion with the amplitude. The mean curvature indeed decreases – even steeply – for nearly half the range of amplitudes and frequencies consid-ered here, while the vessel is more tortuous. By contrast, the standard deviation of curvature Ksdincreases monotonically with amplitude even for relatively high frequencies (k b = 10). Only for a very small upper part of the amplitude–frequency domain, this index decreases very moderately while the vessel tortuosity actually increases. The root mean square curvature, which is the root of the sum of the squares of Kmand Ksd, behaves intermediately, with a monotonic increase at low to moderate frequencies (k b = 7) and a moderate decrease at higher frequencies for amplitudes greater than a value which itself decreases with frequency (data not shown).
Of course, these indexes are sensitive to noise (Fig. 5): the superim-position of random, artificial noise on to model vessels induces estima-tion errors for both Kmand Ksdwhich naturally decrease as the S/N ratio increases but also as the oscillations amplitude (α) increases. However, the influence of the oscillation frequency (k) on the noise-induced esti-mation errors depends on the considered index. Regarding the mean curvature Km, the estimation errors are always positive and decrease exponentially with k from a maximal value at zero frequency to very negligible values (b0.004) at the highest frequencies. The maximal value of the error strongly decreases from 0.2 to 0.02 (i.e. a tenfold decrease) when the signal-to-noise ratio increases from 6 to 12 dB. Re-garding the curvature standard deviation Ksd, the estimation errors also decrease with k at very low frequencies but become negative for low (k = 2) to moderate (k = 6) frequencies depending on the oscillation
Fig. 2. DFM's variations as a function of the helix angular extension (A) for 10 different cases of tortuosities in wavy helices: completely smooth circular helices with no oscilla-tions (α = 0), with small (SA, α = 2), medium (MA, α = 6) and large (LA, α = 10) am-plitude, and with low (LF, k = 4), medium (MF, k = 8) and high (HF, k = 12) frequency oscillations superimposed. The non-constant and non-linear behavior of DFM with angu-lar extension is noteworthy (note that the HFSA and LFMA curves are practically superimposed). The red horizontal line indicates a constant DFM value of 4. This line inter-cepts nearly all the curves, indicating that this particular DFM value can be associated to nearly all tortuosity cases.
A=1
2
1.5
ICM index (by unit length)
frequency of oscillations 1 0.5 0 0 2 4 6 8 10 12 14 16 A=2 A=3 A=4 A=5 A=6 A=7 A=8
Fig. 3. ICM index normalized by path length as a function of the frequency of the superimposed oscillations (k) in wavy helices. The normalized ICM can be calculated
ana-lytically as kA
4þ 1 Dex
, where Dexdenotes the linear distance between the wavy helix
end-points. It is straightforward to demonstrate that Dexis independent on the oscillation
amplitude α for even values of k, when A is an integer. For other cases, the normalized ICM is almost independent on α.
amplitude. At higher frequencies, Ksdcomputed from the noisy vessels systematically underestimates the real value, but the absolute values of the estimation errors progressively decrease towards very negligible values (b0.005) for the highest frequencies. The relative errors vary in the same way decreasing to zero at high frequencies. Regarding Ksd, their absolute values typically remain smaller than 10% over a large range of parameters, except at very low frequencies, i.e. k b 2 for high
S/N ratios, and reaching k b 6 for low S/N ratios. By comparisons, the range of parameters for which the Kmrelative errors remains smaller than 10% is reduced, i.e. k b 4 for high S/N ratios, and reaching k b 9 for low S/N ratios.
In the light of these tests, the standard deviation of curvature (Ksd) can be considered as a robust measure of tortuosity. Its mean (Km) is much less robust for assessing vessel tortuosity. In particular, for model vessels of given amplitude, Kmincreases with Ksdbut at decreas-ing rate (Fig. 6a, plain lines). Moreover, for model vessels of given fre-quency, it exhibit a non-monotonic behavior, with an initial increase and a subsequent decrease over a large range of Ksdvalues (Fig. 6a, dashed lines). The mean curvature (Km) is nevertheless scale invariant and is useful in order to assess the global curvature of a segment. As ex-pected (see2), the SOAM index is a close approximation of the mean
curvature and is linearly related to the mean curvature (SOAM ~ 0.92 Km+ 0.002; R2~ 0.989) (Fig. 6b). Finally, DFM and ICM, because they are not scale invariant, should not be used as curvature nor tortuosity indexes.3
General data on extracted vascular trees
228 vascular trees were extracted from 10 mosaics (covering a surface of approximately 1.5 cm2and encompassing a cerebral tissue volume of 28.6 mm3). They were divided into 152 arterial and 76 venous trees according to their morphological features. These trees were segmented in 17,976 segments, i.e. vessel sections connecting two successive bifurcations, including 10,365 arterial and 7611 venous segments. The total number of orders between a postcapillary venule or a precapillary arteriole and its pial origin in the sulcus, according to the diameter-defined Strahler taxonomy, ranged from 3 to 5. The corre-sponding number of vessel elements was 13,196, including 7604 arteri-al and 5592 venous elements.
Statistical distributions of vessel attributes. Correlations
As demonstrated above by using wavy helices, the mean (Km) and standard deviation (Ksd) of curvature can be considered as measures of global curvature and tortuosity, respectively. These parameters have been computed for the 17,976 vascular intra-cortical segments considered in the present study, as well as the root mean square curva-ture Krms. In addition, the length-to-diameter ratio (LDR), the DFM, the sum of angles SOAM and the normalized ICM have also been computed. Since these vessel attributes are either scale invariant or are the ratios of lengths (as DFM) or of length to diameters, their values remain inde-pendent of shrinkage.
Their main statistical parameters are displayed inTable 1. The mean and median values of Kmand Ksdare close to 0.15 μm−1and 0.09 μm−1, respectively, while DFM has a median of 1.135.
These values mirror the values taken by these parameters for a model vessel (wavy helix) with low amplitude (α = 2) and moder-ate frequency (k = 6) of the superimposed oscillations. Clearly, the real vessels are much less regular and their shape variations have much more complex frequency contents, but nevertheless this is an interesting observation. In particular, while around these values, Kmincreases with both α and k (and thus with Ksd), it rapidly saturates and decreases for moderate increases of the oscillation amplitude (Figs. 4a and6a), i.e. in the physiologic range.
The mean and standard deviation of curvature can be considered as normally distributed (mean ~ median, small skewness and excess). Their histograms are well fitted (R2= 0.979 and 0.978, respectively)
3Note that, while other parameters have been considered, such as the mean length of
subsegments between successive inflection points, it has not been possible, by combining these parameters, to derive other indexes with a dominant dependence on the helix angu-lar extension A, the oscillation frequency k or amplitude α.
k=1
k=16
k=1
k=16
a
b
Fig. 4. Mean curvature (a) curvature standard deviation (b) in wavy helices as a function of the amplitude of superimposed oscillations, for k∈[1–16].
Fig. 5. Influence of noise on Kmand Ksdas a function of the frequency of superimposed oscillations in wavy helices. k=6 =4 =2 =6 =8 =10 k=14 k=10k=12 k=16 k=8 0 0.05 0.1 0.15 0.2 0.25 0.3 0.35 0.4 0.45 0.5 0 0.2 0.4 0.6
K
mK
sd 0 0.05 0.1 0.15 0.2 0.25 0.3 0.35 0.4 0.45 0.5 0 0.2 0.4 0.6S
O
AM
K
m α α α α αa
b
Fig. 6. Comparison of various possible tortuosity measures in wavy helices and in cortical vessels (filled circles) (a) Mean curvature as a function of curvature standard deviation. Plain lines: iso-frequency of the superimposed oscillation in wavy helices; Dashed lines: iso-amplitude of the superimposed oscillation; Black circles: Mean ± SD of Kmvalues corresponding
to cortical vessels with Ksdin 0.05 μm−1intervals centered around the corresponding circles; Dashed line: best adjustment to a power law (Km= 0.41Ksd0.43, R2= 0.98). (b): Correlation
between SOAM and mean curvature. Open symbols: wavy helices; Black circles: Mean ± SD of SOAM values corresponding to cortical vessels with Kmin 0.05 μm−1intervals centered
by Gaussian distributions with mean equal to 0.155 and 0.095 and var-iance equal to 0.04542and 0.0282, respectively, with a small asymmetry towards the low values. By contrast, the histogram of the relative vessel lengthening (DFM) is best fitted (R2= 0.988) by a lognormal distribu-tion with mean and variance equal to −2.65 and 1.122, respectively. The histogram of the logarithm of the LDR is almost perfectly fitted (R2
N 0.99) by a Gaussian curve centered on a value of 2.04 (correspond-ing to a LDR median value of 7.69) with a standard deviation of 1.31.
The standard deviation of curvature and its mean are not independent parameters. For the considered vessel population, Km= 0.41Ksd0.43 (R2= 0.98), seeFig. 6
a (black circles and dotted line), i.e. a significant de-viation to linearity, where Kmincreases with Ksdbut at decreasing rate. This highlights the loss of robustness of Kmas a tortuosity index for the most tortuous vessels, which correspond to wavy helices of low to medi-um amplitude (α ~ 4) and medimedi-um to high frequency (k ~ 10) of the superimposed oscillations. In these vessels, SOAM, while remaining line-arly related to Km, also slightly begins to underestimate the mean curva-ture (Fig. 6b). By contrast, the DFM is very weakly correlated with either Kmor Ksd(R2= 0.17 and 0.25, respectively). A particular value of DFM can be virtually associated with any value of Kmand Ksd, except for values of DFM very close to unity, which would yield very low values of mean and standard deviation of curvature, or for very high values of the DFM, which are generally associated with high values of Kmand Ksd. Over-all, this confirms that DFM does neither provide an adequate estimation of the curvature nor the tortuosity.
As the standard deviation of curvature provides a simple and ro-bust scalar index of tortuosity for each vascular segment, the statisti-cal distribution of curvature along each vessel was further analyzed.
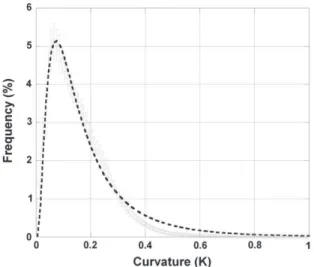
Fig. 7displays the mean histogram obtained for the 17,976 segments analyzed. The curvature at any point of a given vascular segment is distributed according to a lognormal law with mean and variance equal to −1.962 and 0.648, respectively (75% of the vessels have a cur-vature b0.2 μm−1, 90% of the vessels have a curvature b0.3 μm−1, 5% of the vessels have a curvature N1/3 μm−1(curvature radius b 3 μm)).
Variations of vessel attributes with the nature and topological order of vascular segments
In the previous subsections we described the global statistics of 6 vessels attributes (LDR, Km, SOAM, Ksd, Krms, DFM). In the present section, we investigate how these attributes depend on the type – arteriole or venule – and on the hierarchical location of the vessel in the vascular tree, as defined by its order in the diameter-defined Strahler classification. The simplest of these shape factors, the LDR, displays marked differ-ences both according to the type and location of the segments (Fig. 8). The arterioles have a median LDR more than 30% higher, and very signif-icantly so (P b 0.001), than that of the venules (i.e. 8.46 vs. 6.42). The differences between the LDR median values are even more marked as a function of the vessel order: the median LDR of the 0-order (terminal) segments (8.77) is almost twice that of higher order (N = 3) segments (4.6). The logarithm of the LDR decreases linearly (log(LDR) = 0.9397 −0.0971 N; R2= 0.98), consistent with the fractal nature of these tree-like vessels (Cassot et al., 2006; Lorthois and Cassot, 2010). However, the slope of this linear de-crease cannot be deduced from Horton's laws, which indeed relate the logarithm of the element lengths and diameters versus order (Cassot et al., 2006), while result presented here is for vessel seg-ments. When considering vessel elements, the logarithm of the LDR increases linearly (log(LDRelements) = 0.194 N + 0.911; R2= 0.864). Slope and intercept are consistent with slope (0.208) and intercept (1.039) deduced from Horton's laws (log(Lelements) = 0.127 N + 0.936 and log(Delements) = 0.335 N + 1.975, unpublished data for the same population). With regards to vessel elements, the difference between arteries and veins, while slightly smaller (~ 25%), is still highly significant (P b 0.001).
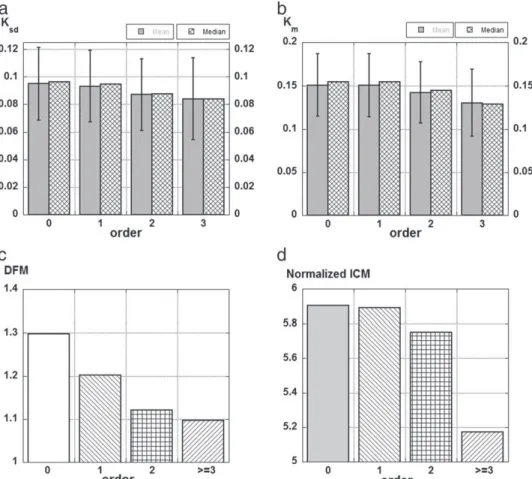
There is no significant difference between the mean values of Kmand Ksdfor the arteriolar and venular groups (t probability = 0.053 and 0.13, respectively). However, the mean value of DFM for the arteriolar group (1.25) is slightly but significantly (t probability b 0.001) higher than for the venular group (1.22). Moreover, the considered vessel attri-butes decrease as the segment order increases (Fig. 9): the vessels get more curved and tortuous as they get closer to the capillary network. The distribution of probability of the curvature – Pr(κ b Κ) – along a given segment varies in the same way as its order (Fig. 10): for instance, the probability that a point has a curvature less than 0.1 μm− 1
− Pr (κ b 0.1) – varies from 0.38 (segment of order 0 or 1) to more than 1/2 (0.57) (segment of order 4), with intermediate values of 0.41 and 0.48 for segments of order 2 and 3.
Table 1
Main statistics (mean, median and standard deviation) of various vessel attributes (LDR, curvature (Km, SOAM), tortuosity (Ksd), Krmsand DFM) in 17,976 cortical vessels (10,365
arterioles and 7611 venules).
Stats LDR Km(µm−1) SOAM (µm−1) Ksd(µm−1) Krms(µm−1) DFM
Mean 10.37 0.149 0.163 0.093 0.188 1.234 Median 7.46 0.153 0.168 0.094 0.191 1.135 SD 9.41 0.036 0.045 0.026 0.052 0.351
Fig. 7. Mean curvature histogram obtained for 17,976 cortical vessels. This histogram rep-resents the mean ± standard deviation of the frequencies corresponding to each curva-ture bins in the individual histograms of each segments.
Fig. 8. Median of the length-to-diameter ratio as a function of type and hierarchical posi-tion for 17,976 cortical vessels.
Discussion
Abnormal vessel attributes, especially vascular tortuosity, have de-monstrable importance in the diagnosis of many diseases, such as can-cer and retinopathies. Paradoxically, until now, tortuosity has not received a formal and unambiguous clinical definition. In this context, the objectives of the present study were:
to propose a new and more robust definition and methodology for the estimation of vessel attributes, in particular tortuosity, and to test this methodology on model vessels,
to apply this methodology to a large microvascular database of the human cerebral cortex in order to obtain the statistical data needed as reference or rationale for further assessment of vessel attributes under pathological conditions for the purpose of clinical diagnosis. The methodology proposed was based on a two-step procedure, including:
a smoothing/resampling step designed both to normalize the lineset obtained through the skeletonization process and to resample the data points at equally spaced curvilinear abscissa, using a cubic spline interpolation algorithm,
the computation of the three-dimensional geometrical characteris-tics of a vessel, solidly grounded on the classical formulation of dif-ferential geometry and robust numerical derivation techniques. With respect to some recent work with similar objectives, the meth-odology proposed here differs in significant ways:
the resampled vessels go through the smoothed original data points, a condition which is not always fulfilled either by the polynomial curve-fitting method (O'Flynn et al., 2007) nor by the interpolation method (Johnson and Dougherty, 2007) used in previous works. This is a necessary condition to avoid uncontrolled, significant diver-gences from the real data,
the methodology is based on the direct computation of the curvilin-ear abscissa, without any parameterization. This allows a straightfor-ward derivation of the unit tangent vector components and, in consequence, a better accuracy of the numerical method based on simpler analytical formulas,
in this study, we have not considered measurements of torsion as proposed byO'Flynn et al. (2007). The calculation of torsion would require the numerical computation of the third derivatives of the
Fig. 9. Influence of hierarchical position of vessels on their vessel attributes for 17,976 cortical vessels.(a) Ksdmean ± standard deviation and median; (b) Kmmean ± standard deviation
and median; (c) DFM median; and (d) normalized ICM median.
vertex coordinates. This would certainly be much more sensitive to noise than the computation of lower order derivatives necessary to estimate the parameters considered here. While the impact of noise on the indexes proposed in this paper has been shown to be small even at low S/N ratio, this would not remain the case when es-timating the torsion from currently available vascular imaging techniques.
However the most significant methodological advance in this study concerns the definition of a reliable tortuosity index satisfying: i) scale invariance and ii) positive monotonic response with respect to the am-plitude and frequency of vessel oscillations (in other words, “the more bends that occur along the length of a vessel, and the greater their ampli-tudes, the larger the tortuosity index should be” (Johnson and Dougherty, 2007)). We performed numerous tests on a large body of vessel models, from those with regular but recurrent curves (low fre-quency and amplitudes, large value of total path length) to those which were more sinuous in nature, generated using simple analytical parameters. These tests allowed to assess method reliability and accura-cy, and demonstrated that the standard deviation of the curvature best satisfied the above criteria over a broad range of vessel models. On the contrary, the measure of mean curvature, which is scale invariant, sat-isfies monotonic variation only at low amplitudes or low frequency (or both) and the measure of root mean square curvature displays paradox-ical variations at moderate or high frequencies. The SOAM index is actu-ally an approximation of the mean curvature and so does not satisfy the second criterion given here. The DFM and ICM indexes are highly scale dependent and this scale dependence still remains after normalization by the vessel length, which reduces their utility as tortuosity indexes.
We therefore propose the measure of the standard deviation of the curvature (Ksd) as a new and reliable index of tortuosity. Note that, using this new methodology and the index of tortuosity, the mean cur-vature (Km) and the curvature root mean square (Krms) can be obtained simultaneously without significant extra computational cost.
The computation of these vessel attributes on a large vascular data-base of the human cerebral cortex allowed the establishment of refer-ence morphometric data and the characterization of their statistical distributions. To our knowledge, this has never been done before, and certainly not with regard to such a large database, for any organ, human or otherwise. The most important findings of this part of our study are:
- Mean, standard deviation and root mean square of the curvature are normally distributed around values which, by comparison with ves-sel models, would correspond to low amplitude (α ~ 2) and moder-ate frequency oscillations (k ~ 6). They display relatively high coefficients of variation (from 25% to 40% approximately) highlight-ing a marked intervascular heterogeneity, with a twofold increase in both amplitude and frequency for the most tortuous vessels. This heterogeneity may be due to the multi-frequency components of the vessel curvature, and comparison with vessel models should be made with caution. The distributions of the length-to-diameter ratio (LDR) and of the relative lengthening (DFM) are lognormal. These findings are coherent with the lognormal distribution of ves-sel length (Lauwers et al., 2008).
- DFM is very weakly correlated with Kmand Ksd, indicating that a par-ticular value of this index can be associated with nearly any value of mean curvature or tortuosity. This confirms that this simple mea-surement can reliably assess neither curvature nor tortuosity. Thus, the large body of literature where DFM is considered as a tortuosity index should be interpreted with caution.
- Arterioles have a higher median LDR than venules, but the two kinds of vessels have the same mean curvature and tortuosity.
- Length-to-diameter ratio decreases very significantly and markedly with vessel order, the LDR logarithm following a linear relationship with vessel order consistent with the fractal nature of the tree-like vessels of the cerebral cortex.
- While clinical papers based on the assessment of the LDR often con-sider separately arteriolar and venous vessels, the hierarchical posi-tion of the vessels in the vascular tree should also be considered in a perspective of diagnosis and/or staging,
- The lower the order of the vessels, i.e. the nearer to the capillary net-work, the more curved and tortuous the vessels are. The analysis of the probability distribution of the curvature along a given vessel confirms this finding, showing that the probability that the curva-ture at a given vessel point is less than a prescribed value increases with the order of the vessel. This is consistent with the predictions of a theoretical model of vascular morphogenesis highlighting the influence of mechanical forces induced by blood flow and tissue growth during development, which lead to straighter and longer proximal vessels (Nguyen et al., 2006). Thus, it is likely to be the consequence of ubiquitous physical constraints and to hold in other organs, especially in the retina, the vasculature of which is known to share similar anatomic, physiological, and embryological characteristics to the cerebral vessels (Baker et al., 2008; Patton et al., 2005).
Many recent researches have shown that changes of the vessel tor-tuosity, for instance, might be an early “marker” of tumor malignancy. Vessel “normalization” (Jain, 2005), in particular a marked reduction of their tortuosity might permit analysis of the efficacy of cancer thera-py. In this context, the analysis of various vessel attributes performed on vessel models has highlighted the drawbacks of empirical methods cur-rently used, especially for highly tortuous vessels, and has validated a new and robust tortuosity index. The superiority of this new index com-pared to previous ones must be confirmed in studies focused on tumor vessels, the tortuosity of which is likely to be greater than the one of the most tortuous healthy vessels in the present study, for which a loss of robustness of previous tortuosity indexes has been demonstrated. Acknowledgments
This work has been partially funded by grants DAER-Recherche 10012137 and 11051133 from Région Midi-Pyrénées and Projet ANR-2010-Blanc PlanFriz. We gratefully acknowledge Henri Duvernoy who placed his wonderful collection of injected human brains at our disposal and gave us precious indications.
References
Abramovitz, M., Stegun, I.A., 1972.Handbook of Mathematical Functions. Dover Publica-tions Inc., New York (10th printing, chap. 25).
Astner, S., Dietterle, S., Otberg, N., Rowert-Huber, H.J., Stockfleth, E., Lademann, J., 2008.
Clinical applicability of in vivo fluorescence confocal microscopy for noninvasive di-agnosis and therapeutic monitoring of nonmelanoma skin cancer. J. Biomed. Opt. 13, 014003.
Baish, J.W., Jain, R.K., 2000.Fractals and cancer. Cancer Res. 60, 3683–3688.
Baish, J.W., Gazit, Y., Berk, D.A., Nozue, M., Baxter, L.T., Jain, R.K., 1996.Role of tumor vas-cular architecture in nutrient and drug delivery: an invasion percolation-based net-work model. Microvasc. Res. 51, 327–346.
Baker, M.L., Hand, P.J., Wang, J.J., Wong, T.Y., 2008.Retinal signs and stroke. Revisiting the link between the eye and brain. Stroke 39, 1371–1379.
Brown, W.R., Moody, D.M., Thore, C.R., Anstrom, J.A., Challa, V.R., 2009.Microvascular changes in the white mater in dementia. J. Neurol. Sci. 283, 28–31.
Bullitt, E., Gerig, G., Pize, S.M., Lin, W., Aylward, S.R., 2003.Measuring tortuosity of the in-tracerebral vasculature from MRA images. IEEE Trans. Med. Imaging 22, 1163–1171.
Bullitt, E., Muller, K.E., Jung, I., Lin, W., Aylward, S., 2005a.Analyzing attributes of vessel populations. Med. Image Anal. 9, 39–49.
Bullitt, E., Zeng, D., Gerig, G., Aylward, S., Joshi, S., Smith, J.K., Lin, W., Ewend, M.G., 2005b.
Vessel tortuosity and brain tumor malignancy: a blinded study. Acad. Radiol. 12, 1232–1240.
Bullitt, E., Lin, N.U., Ewend, M.G., Zeng, D., Winer, E.P., Carey, L.A., Smith, J.K., 2006a.Tumor therapeutic response and vessel tortuosity: preliminary report in metastatic breast cancer. Med. Image Comput. Comput. Assist. Interv. 9, 561–568.
Bullitt, E., Wolthusen, P.A., Brubaker, L., Lin, W., Zeng, D., Van Dyke, T., 2006b. Malignancy-associated vessel tortuosity: a computer-assisted, MR angiographic study of choroid plexus carcinoma in genetically engineered mice. AJNR Am. J. Neuroradiol. 27, 612–619.
Bullitt, E., Aylward, S.R., Van Dyke, T., Lin, W., 2007a.Computer-assisted measurement of vessel shape from 3 T magnetic resonance angiography of mouse brain. Methods 43, 29–34.
Bullitt, E., Lin, N.U., Smith, J.K., Zeng, D., Winer, E.P., Carey, L.A., Lin, W., Ewend, M.G., 2007b.Blood vessel morphologic changes depicted with MR angiography during treatment of brain metastases: a feasibility study. Radiology 245, 824–830.
Burger, P.C., Scheithauer, B.W., Vogel, F.S., 1991.Surgical Pathology of the Nervous System and its Coverings. Churchill Livingstone, New York.
Carmeliet, P., 2005.Angiogenesis in life, disease and medicine. Nature 438, 932–936.
Carmeliet, P., Jain, R.K., 2000.Angiogenesis in cancer and other diseases. Nature 407, 249–257.
Cassot, F., Lauwers, F., Fouard, C., Prohaska, S., Lauwers-Cances, V., 2006.A novel three-dimensional computer-assisted method for a quantitative study of microvascular networks of the human cerebral cortex. Microcirculation 13, 1–18.
Cassot, F., Lauwers, F., Lorthois, S., Puwanarajah, P., Duvernoy, H., 2009.Scaling laws for branching vessels of human cerebral cortex. Microcirculation 16, 331–344.
Cassot, F., Lauwers, F., Lorthois, S., Puwanarajah, P., Cances-Lauwers, V., Duvernoy, H., 2010.Branching patterns for arterioles and venules of the human cerebral cortex. Brain Res. 1313, 62–78.
Dougherty, G., Johnson, M.J., 2008.Clinical validation of three-dimensional tortuosity metrics based on the minimum curvature of approximating polynomial splines. Med. Eng. Phys. 30, 190–198.
Duvernoy, H.M., Delon, S., Vannson, J.L., 1981.Cortical blood vessels of the human brain. Brain Res. Bull. 7, 519–579.
Folkman, J., 2000.Incipient angiogenesis. J. Natl. Cancer Inst. 92, 94–95.
Fouard, C., Malandain, G., Prohaska, S., Westerhoff, M., 2006.Blockwise processing applied to brain microvascular network study. IEEE Trans. Med. Imaging 25, 1319–1328.
Frost, S., Kanagasingam, Y., Sohrabi, H., Vignarajan, J., Bourgeat, P., Salvado, O., Villemagne, V., Rowe, C.C., Lance Macaulay, S., Szoeke, C., Ellis, K.A., Ames, D., Masters, C.L., Rainey-Smith, S., Martins, R.N., AIBL Research Group, 2013. Retinal vascular biomarkers for early detection and monitoring of Alzheimer's disease. Transl. Psychiatry 3, e233.
http://dx.doi.org/10.1038/tp.2012.150.
Fukumura, D., Jain, R.K., 2008.Imaging angiogenesis and the microenvironment. Apmis 116, 695–715.
Gaustad, J.V., Simonsen, T.G., Brurberg, K.G., Huuse, E.M., Rofstad, E.K., 2009.Blood supply in melanoma xenografts is governed by the morphology of the supplying arteries. Neoplasia 11, 277–285.
Gelman, R., Jiang, L., Du, Y.E., Martinez-Perez, M.E., Flynn, J.T., Chiang, M.F., 2007.Plus dis-ease in retinopathy of prematurity: pilot study of computer-based and expert diagno-sis. J. Aapos 11, 532–540.
Goldman, D., Popel, A.S., 2000.A computational study of the effect of capillary network anastomoses and tortuosity on oxygen transport. J. Theor. Biol. 206, 181–194.
Grisan, E., Foracchia, M., Ruggeri, A., 2008.A novel method for the automatic grading of retinal vessel tortuosity. IEEE Trans. Med. Imaging 27, 310–319.
Hart, W.E., Goldbaum, M., Cote, B., Kube, P., Nelson, M.R., 1997.Automated measurement of retinal vascular tortuosity. Proc. AMIA Annu. Fall Symp. 459–463.
Hart, W.E., Goldbaum, M., Côté, B., Kube, P., Nelson, M.R., 1999.Measurement and classi-fication of retinal vascular tortuosity. Int. J. Med. Inform. 53, 239–252.
Helmlinger, G., Sckell, A., Dellian, M., Forbes, N.S., Jain, R.K., 2002.Acid production in glycolysis-impaired tumors provides new insights into tumor metabolism. Clin. Can-cer Res. 8, 1284–1291.
Huang, S.F., Chang, R.F., Moon, W.K., Lee, Y.H., Chen, D.R., Suri, J.S., 2008.Analysis of tumor vascularity using three-dimensional power Doppler ultrasound images. IEEE Trans. Med. Imaging 27, 320–330.
Jain, R.K., 1988.Determinants of tumor blood flow: a review. Cancer Res. 48, 2641–2658.
Jain, R.K., 2001.Normalizing tumor vasculature with anti-angiogenic therapy: a new par-adigm for combination therapy. Nat. Med. 7, 987–989.
Jain, R.K., 2005. Normalization of tumor vasculature: an emerging concept in antiangiogenic therapy. Science 307, 58–62.
Johnson, M.J., Dougherty, G., 2007.Robust measures of three-dimensional vascular tortu-osity based on the minimum curvature of approximating polynomial spline fits to the vessel mid-line. Med. Eng. Phys. 29, 677–690.
Jonk, A.M., Houben, A.J., de Jongh, R.T., Serne, E.H., Schaper, N.C., Stehouwer, C.D., 2007. Micro-vascular dysfunction in obesity: a potential mechanism in the pathogenesis of obesity-associated insulin resistance and hypertension. Physiology (Bethesda) 22, 252–260.
Kassab, G.S., Rider, C.A., Tang, N.J., Fung, Y.C., 1993.Morphometry of pig coronary arterial trees. Am. J. Physiol. 265, H350–H365.
Kemper, A.R., Wallace, D.K., Quinn, G.E., 2008.Systematic review of digital imaging screening strategies for retinopathy of prematurity. Pediatrics 122, 825–830.
Korn, G.A., Korn, T.M., 2000.Mathematical handbook for scientists and engineers. Defini-tions, theorems and formulas for references and review. Dover PublicaDefini-tions, Inc.
Lademann, J., 2008.Clinical applicability of in vivo fluorescence confocal microscopy for noninvasive diagnosis and therapeutic monitoring of nonmelanoma skin cancer. J. Biomed. Opt. 13, 014003.
Lau, D.H., Xue, L., Young, L.J., Burke, P.A., Cheung, A.T., 1999.Paclitaxel (Taxol): an inhib-itor of angiogenesis in a highly vascularized transgenic breast cancer. Cancer Biother. Radiopharm. 14, 31–36.
Lauwers, F., Cassot, F., Lauwers-Cances, V., Puwanarajah, P., Duvernoy, H., 2008. Mor-phometry of the human cerebral cortex microcirculation: general characteristics and space-related profiles. Neuroimage 39, 936–948.
Levy, B.I., Schiffrin, E.L., Mourad, J.J., Agostini, D., Vicaut, E., Safar, M.E., Struijker-Boudier, H.A., 2008.Impaired tissue perfusion: a pathology common to hypertension, obesity, and diabetes mellitus. Circulation 118, 968–976.
Li, C.Y., Shan, S., Huang, Q., Braun, R.D., Lanzen, J., Hu, K., Lin, P., Dewhirst, M.W., 2000. Ini-tial stages of tumor cell-induced angiogenesis: evaluation via skin window chambers in rodent models. J. Natl. Cancer Inst. 92, 143–147.
Linninger, A.A., Gould, I.G., Marinnan, T., Hsu, C.Y., Chojeckia, M., Alaraj, A., 2013.Cerebral microcirculation and oxygen tension in the human secondary cortex. Ann. Biomed. Eng. 41, 2264–2284.
Lorthois, S., Cassot, F., 2010.Fractal analysis of vascular networks: insights from morpho-genesis. J. Theor. Biol. 262, 614–633.
Lorthois, S., Cassot, F., Lauwers, F., 2011a.Simulation study of brain blood flow regulation by intra-cortical arterioles in an anatomically accurate large human vascular net-work: part I: methodology and baseline flow. Neuroimage 54, 1031–1042.
Lorthois, S., Cassot, F., Lauwers, F., 2011b.Simulation study of brain blood flow regulation by intra-cortical arterioles in an anatomically accurate large human vascular net-work: part II: flow variations induced by global or localized modifications of arterio-lar diameters. 54, 2840–2953.
Lu, M., Zhang, Z.G., Chopp, M., 2004.Analysis of cerebral microvascular architecture— application to cortical and subcortical vessels in rat brain. J. Neurosci. Methods 138, 81–87.
Meyer, E.P., Ulmann-Schuler, A., Staufenbiel, M., Krucker, T., 2008.Altered morphology and 3D architecture of brain vasculature in a mouse model for Alzheimer's disease. Proc. Natl. Acad. Sci. U. S. A. 105, 3587–3592.
Murfee, W.L., Schmid-Schonbein, G.W., 2008.Chapter 12. Structure of microvascular net-works in genetic hypertension. Methods Enzymol. 444, 271–284.
Nguyen, T.H., Eichmann, A., leNoble, F., Fleury, V., 2006.Dynamics of vascular branching morphogenesis: the effect of blood and tissue flow. Phys. Rev. E 73, 061907-1–061907-14.
Nishimura, N., Schaffer, C.B., Friedman, B., Lyden, P.D., Kleinfeld, D., 2007.Penetrating ar-terioles are a bottleneck in the perfusion of neocortex. Proc. Natl. Acad. Sci. U. S. A. 104, 365–370.
O'Flynn, P.M., O'Sullivan, G., Pandit, A.S., 2007.Methods for three-dimensional geometric characterization of the arterial vasculature. Ann. Biomed. Eng. 35, 1368–1381.
Patton, N., Aslam, T., Macgillivray, T., Pattie, A., Deary, I.J., Dhillon, B., 2005.Retinal vascular image analysis as a potential screening tool for cerebrovascular disease: a rationale based on homology between cerebral and retinal microvasculatures. J. Anat. 206, 319–348.
Pries, A.R., Secomb, T.W., 2008.Modeling structural adaptation of microcirculation. Micro-circulation 15, 753–764.
Pries, A.R., Reglin, B., Secomb, T.W., 2005.Remodeling of blood vessels: responses of di-ameter and wall thickness to hemodynamic and metabolic stimuli. Hypertension 46, 725–731.
Reina-De La Torre, F., Rodriguez-Baeza, A., Sahuquillo-Barris, J., 1998.Morphological char-acteristics and distribution pattern of the arterial vessels in human cerebral cortex: a scanning electron microscope study. Anat. Rec. 251, 87–96.
Siemann, D.W., 2002.Vascular targeting agents. Horiz. Cancer Ther. 3, 4–15 (56, 1992).
Sladkevicius, P., Jokubkiene, L., Valentin, L., 2007.Contribution of morphological assess-ment of the vessel tree by three-dimensional ultrasound to a correct diagnosis of ma-lignancy in ovarian masses. Ultrasound Obstet. Gynecol. 30, 874–882.
Smedby, O., Högman, N., Nilsson, S., Erikson, U., Olsson, A.G., Walldius, G., 1993. Two-di-mensional tortuosity of the superficial femoral artery in early atherosclerosis. J. Vasc. Res. 30, 181–191.
Su, S.W., Catherall, M., Payne, S., 2012.The influence of network structure on the transport of blood in the human cerebral microvasculature. Microcirculation 19, 175–187.
Sutter, F.K., Helbig, H., 2003.Familial retinal arteriolar tortuosity: a review. Surv. Ophthalmol. 48, 245–255.
Uludağ, K., Müller-Bierl, B., Uğurbil, K., 2009.An integrative model for neuronal activity induced signal changes for gradient and spin echo functional imaging. Neuroimage 48, 150–165.
Vickerman, M.B., Keith, P.A., McKay, T.L., Gedeon, D.J., Watanabe, M., Montano, M., Karunamuni, G., Kaiser, P.K., Sears, J.E., Ebrahem, Q., Ribita, D., Hylton, A.G., Parsons-Wingerter, P., 2009.VESGEN 2D: automated, user-interactive software for quantifica-tion and mapping of angiogenic and lymphangiogenic trees and networks. Anat. Rec. (Hoboken) 292, 320–332.
Weber, B., Keller, A.L., Reichold, J., Logothetis, N.K., 2008.The microvascular system of the striate and extrastriate visual cortex of the macaque. Cereb. Cortex 18, 2318–2330.
Wiernsperger, N., Nivoit, P., De Aguiar, L.G., Bouskela, E., 2007.Microcirculation and the metabolic syndrome. Microcirculation 14, 403–438.
Witt, N., Wong, T.Y., Hughes, A.D., Chaturvedi, N., Klein, B.E., Evans, R., McNamara, M., Thom, S.A., Klein, R., 2006.Abnormalities of retinal microvascular structure and risk of mortality from ischemic heart disease and stroke. Hypertension 47, 975–981.
Wong, T.Y., Klein, R., Couper, D.J., Cooper, L.S., Shahar, E., Hubbard, L.D., Wofford, M.R., Sharrett, A.R., 2001.Retinal microvascular abnormalities and incident stroke: the ath-erosclerosis risk in communities study. Lancet 358, 1134–1140.
Wong, T.Y., Klein, R., Sharrett, A.R., Schmidt, M.I., Pankow, J.S., Couper, D.J., Klein, B.E., Hubbard, L.D., Duncan, B.B., 2002.Retinal arteriolar narrowing and risk of diabetes mellitus in middle-aged persons. JAMA 287, 2528–2533.
Wong, T.Y., Klein, R., Nieto, F.J., Klein, B.E., Sharrett, A.R., Meuer, S.M., Hubbard, L.D., Tielsch, J.M., 2003.Retinal microvascular abnormalities and 10-year cardiovas-cular mortality: a population-based case–control study. Ophthalmology 110, 933–940.
![Fig. 4. Mean curvature (a) curvature standard deviation (b) in wavy helices as a function of the amplitude of superimposed oscillations, for k∈[1–16].](https://thumb-eu.123doks.com/thumbv2/123doknet/3503909.102489/7.892.78.401.119.964/curvature-curvature-standard-deviation-function-amplitude-superimposed-oscillations.webp)