O
pen
A
rchive
T
OULOUSE
A
rchive
O
uverte (
OATAO
)
OATAO is an open access repository that collects the work of Toulouse researchers and
makes it freely available over the web where possible.
This is an author-deposited version published in :
http://oatao.univ-toulouse.fr/
Eprints ID : 14236
To cite this version : Brès, Étienne F. and Reyes-Gasga, José and
Rey, Christian and Michel, Jean Probe size study of apatite irradiation
in stem. (2014) The European Physical Journal Applied Physics, vol.
67 (n° 2). pp. 1-6. ISSN 1286-0042
Any correspondance concerning this service should be sent to the repository
administrator:
[email protected]
To link to this article : DOI:10.1051/epjap/2014130104
Probe size study of apatite irradiation in stem
´
Etienne F. Br`es1,a, Jos´e Reyes-Gasga1,b, Christian Rey2, and Jean Michel3
1 Unit´e des Mat´eriaux et Transformation (UMET), Universit´e des Sciences et Technologies de Lille, Bˆatiment C6,
59650 Villeneuve d’Ascq, France
2 Ecole Nationale Sup´´ erieure des Ing´enieurs en Arts Chimiques et Technologiques Cirimat-Ensiacet, Ensiacet 4 all´ee
´
Emile Monso, BP44362, 31030 Toulouse cedex 4, France
3 Laboratoire de Recherche en Nanosciences LRN EA4682, UFR Sciences Universit´e de Reims, 21, rue Cl´ement Ader,
51685 Reims cedex 02, France
Abstract. The effect of electron beam irradiation of stoichiometric hydroxyapatite (Ca10(PO4)6(OH)2, HAP) is investigated using electron energy loss spectroscopy (EELS) in the scanning transmission electron
microscope (STEM) mode equipped with a LaB6gun. Initial irradiation at 160 A cm−2dose rate shows no
modification of the low loss spectra. No difference of mass loss for Ca, O and P is observed for two different
probe diameters: 4 nm (dose rate = 160 A cm−2) and 24 nm (dose rate = 70 A cm−2). Furthermore no
formation of CaO is observed for both experimental conditions. It is proposed that the low values of both
electron dose rates and doses (from 350 to 2400 C cm−2) avoid mass loss. At the higher dose rate obtained
with a field emission gun (FEG), transformations are observed for the lowloss signal as well as for the Ca, P and O signals. These results might be very useful for the future studies of apatite particles at the nanoscale.
1 Introduction
Apatites, mainly hydroxyapatite (Ca10(PO4)6(OH)2, HAP), are the main constituents of teeth and bones [1] in which they constitute the nanoscale elements of the tis-sues [2,3]. It is also used as such as biomaterials (e.g., [4]) or in substitutes both as solid materials and surface coat-ings [5]. Therefore, their study, analysis and improvements are very important in the medical and biomaterials fields. On the other hand, transmission electron microscopy (TEM) characterization, both in the mode of high reso-lution electron microscope (HRTEM) and scanning trans-mission electron microscopy (STEM), is necessary for studying apatite crystals at the nanoscale [6,7]. These techniques include: space group determination, defect characterization and surface characterization [8,9]. How-ever, during TEM/STEM observations, organic as well as inorganic samples can undergo onto a series of electron beam damage phenomena: heating, electrostatic charg-ing, ionization damage (radiolysis), displacement damage, sputtering and hydrocarbon contamination [10–15].
a e-mail:[email protected]
b Present address: Instituto de F´ısica, UNAM, Circuito de
la Investigaci´on s/n, Ciudad Universitaria, 04510 Coyoacan,
M´exico, D.F.
Apatite irradiated with an electron beam shows inter-esting behaviors depending on the characteristics of the irradiation [7,13,14,16–18]. So it is important to under-stand the effect of the electron irradiation on the apatite samples as well as for other materials [10–13,16–19].
One of the techniques available in the TEM is the elec-tron energy loss spectroscopy (EELS). The EELS tech-nique analyses the energy loss by the incident beam when it goes through the sample. Even damage can be more sen-sitive and quantifiable when it is analyzed by EELS [20]. EELS experiments have also been performed on HAP and other calcium phosphates [20–24].
The interest in using EELS for study a sample is many-fold:
(1) Defining the extent of the reliable information that one can obtain in a microscope when analyzing our sam-ple. Is the sample observed genuine or is it damage? As long term effects (several minutes) can easily be identi-fied, it is impossible to identify the damage that occurs during the very first seconds of observation [14,17,19]; (2) Optimizing the analysis process in order to obtain the
maximum information;
(3) The damage process itself can yield information on the sample studied. For example: phase transformation [7,16,18,25], geochronology [11,26].
2 Dose rate (fluence rate) and dose (fluence)
Experiments at various dose rates [12,20] have shown a significant dependence of the extent and type of damage at a particular fluence or the fluence rate itself. Nanovoids are formed on the faces of the crystals below 1.6 A cm−2 [13,27]. These voids can be subsequently filled after pro-longed irradiation [14]. This shows a structural destruc-tion without material loss. Above 1.6 A cm−2 the bulk of the crystals become amorphous while CaO particles form at the surface of the crystals [19,27]. Eddisford et al. [20] have reported that a recovery process becomes apprecia-ble above a fluence rate of about 80 A cm−2. They also report that fluence seems to have no influence on damage below a value of about 1600 C cm−2 with no reduction of damage with sample cooling. Lastly, a transformation of the apatite hexagonal phase (space group: P63/m) into a monoclinic phase has been suggested [16,28].
3 Accelerating voltage
Senger et al. [17] have studied the ballistic damage in-duced on the ions inside the HAP unit cell by 300 and 400 kV electrons by comparing the electrostatic binding energies of the ions-eventually increased by the covalent bond energy to the maximum transferable energy for the two voltages. These authors concluded that the hydroxyl and oxygen ions can be ejected and that after the cre-ation of vacancies in the crystal unit cell, in particular the departure of the two hydroxyl ions, the calcium ions become more loosely bound and can be displaced. How-ever, their conclusion that the phosphate ions were stable and not likely to be displaced is obviously in contradiction which the increase of the Ca/P ratio observed by EDX and EELS.
More recent observation [20] show that the damage is more important as the voltage decreases which indicates that the damage process is dominated by radiolysis, which would explain the breaking of the P-O covalent bonds and the displacement of the P5+and O2−ions outside the ap-atite bulk. In addition to this, the formation of dislocation lines and dislocation loops was observed at very high volt-ages, 2 mV, during the observation of HAP crystals [9].
4 Temperature
The temperature at a material irradiated by the electron beam inside an electron microscope is difficult to assess. It not only depends on the experimental parameters but also on the thermal diffusivity of the material itself [29]. Concerning calcium phosphate, indication on the tem-perature at the material level can be given by the existence or the absence of chemical reactions. In situ transformation of octacalcium phosphate (OCP) into hydroxyapatite reported by Nelson and McLean [30] did not show the presence of additional phase. However Br`es et al. [25] have shown the existence of a transient phase
in the transformation of calcium deficient apatite during TEM observation.
In the present paper, the effect of electron irradia-tion of stoichiometric hydroxyapatite (Ca10(PO4)6(OH2) is investigated using STEM-EELS. The mass loss of Ca, O and P was followed for three different probe diame-ters and dose rates: 1 nm (dose rate = 26 000 A cm−2); 4 nm (dose rate = 160 A cm−2) and 24 nm (dose rate = 70 A cm−2).
5 Materials and methods
Stoichiometric HAP single crystals were prepared as pre-viously reported [23]. A Philips CM 30 (LaB6 gun) oper-ating in STEM mode at 200 keV and fitted with a Gatan Enfina EELS spectrometer was used in this work for the low fluence rate experiments (standing probes of 4 and 24 nm nominal diameters corresponding to fluence rates of respectively around 70 and 160 A cm−2). HAP spectra were recorded with a spectrometer aperture of 2 mm, an energy dispersion of 0.05 eV/ch and an energy resolution of 1–1.05 eV (full width at half maximum (FWHM) of the zero-loss peak) except for the oxygen K-edge spectra for the 4 nm probe size for which we used a 0.3 eV/ch energy dispersion to compensate signal weakness resulting in a lower energy resolution of around 1.8 eV. A JEOL2100F (field emission gun) operating in STEM mode at 200 keV and fitted with a Gatan GIF quantum was used in this work for the high fluence rate experiments (standing probe of 1 nm nominal diameter corresponding to a fluence rate of around 25 000 A cm−2). HAP spectra were recorded with a spectrometer aperture of 2.5 mm, an energy dis-persion of 0.05 eV/ch and an energy resolution of around 0.9 eV (full width at half maximum [FWHM] of the zero-loss peak).
6 Results and discussion
A typical bright field TEM image of the HAP nanopar-ticles used in this work is shown in Figure 1. The initial stage of sample examination is always critical as a mini-mum amount of time is always required for selecting the sample zone itself and for performing the initial micro-scope adjustments. Even if the experimentalist tries to reduce this delay, the sample receives a minimum dose of electrons and the possibility of initial sample modification cannot be excluded.
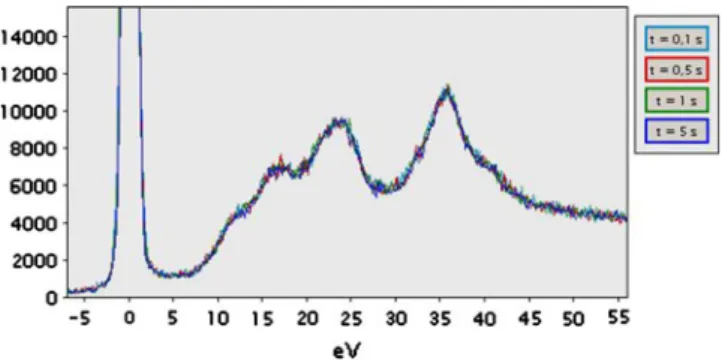
We have obtained contradictory information at the ini-tial irradiation stages. The examination of the low loss spectrum from 0.1 to 5 s indicates no modification of the signal stability, shape and intensity which indicates no initial modification of the HAP structure under the beam even at a fluence rate of 160 A cm−2 (spot size 4 nm). Figure 2 shows the evolution of the HA low loss signal as function of the total irradiation time. The para-meters of this figure are: STEM mode, probe size 4 nm, acquisition time for each spectrum 0.1 s and a dose rate
Fig. 1. STEM bright field image of the HAP nanoparticles.
Fig. 2. Evolution of the HA low loss signal as function of the total irradiation time. STEM mode, probe size 4 nm,
acquisition time for each spectrum 0.1 s, dose rate 160 A cm−2.
160 A cm−2. The analysis of the effect of two probe sizes (4 and 24 nm), with different dose rates (fluence rates; 70 and 160 A cm−2) over a range of doses (fluence: from 350 C cm−2 to 2400 C cm−2) on the possible mass loss of the different chemical elements (Ca, O and P) of the sample studied is described on Table1and Figure3. The presented spectra correspond to raw data in the case of phosphorus and to raw data after background subtraction in the case of calcium and oxygen.
Careful examination shows that the spectra obtained are well resolved from the very first observation and re-main resolved throughout the full irradiation times (from 5 to 15 s) regardless the chemical element and for both probe sizes and fluence rates values (probe size: 4 nm, dose rate: 160 A cm−2 and probe size: 24 nm, dose rate 70 A cm−2) (Fig.3).
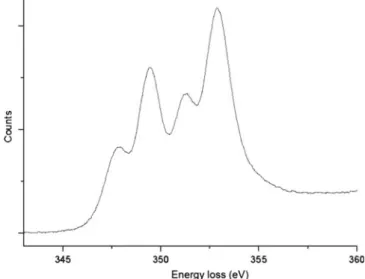
Moreover fine observation of the HAP oxygen K-edge signals (bottom line in Figure 3) reveals stable apatite characteristic peaks located at 536 eV and 539 eV when, for instance, there is just a shoulder at 536 eV in the case of β-tricalcium phosphate (β-TCP) oxygen K-edge signals (Fig.4) [22]. On the other hand a pre-peak located at 531 eV is present in the β-TCP signal and missing in the HAP signal. In Figure 4 this pre-peak appears to be sensitive during the irradiation of β-TCP [23] so that we cannot exclude its quick disappearance in the very early stages of irradiation of HAP.
Furthermore, no observable formation of CaO takes place during the irradiation, or at least not detected for the experimental device used in this work. CaO, calcium L2,3 edge signal presents a typical shape characterized by a splitting into two of the L2,3 lines [23]. Figure 5
presents the typical calcium L2,3 signal recorded in case of CaO formation. The splitting is not observed in our HAP spectra. The absence of effect of the dose (fluence) from 350 to 2400 C cm−2 on the spectra is in agreement with the results obtained by Eddisford et al. [20] who have shown no variation of the Ca/P ratio for fluence up to 16 000 C cm−2. With regards to the effect of the dose rates (fluence rates), Eddisford et al. [20] have found unchanged Ca/P stoichiometric values around 100 A cm−2. However, higher Ca/P ratios were obtained both below and above 100 A cm−2. This variation is more dramatic at high doses (fluences) up to 16 000 cm−2. It was also observed that the low values of both electron dose rates and doses (from 350 to 2400 C cm−2) avoid mass loss. Considering the results shown by Eddisford et al. [20], the absence of mass loss observed in this work can be explained by the low values of dose (fluence) used (up to 2400 C cm−2) which reduces the effect of the dose rate.
The difference of the probe sizes is difficult to evaluate independently of other parameters. In the present case, the slight noise increase observed on the spectra obtained with a 4 nm probe can be due to both the reduced num-ber of incident electrons (16 times less) and to the smaller number of OHAP unit cells probed (40 times less) com-pared to the 24 nm probe size.
At the higher dose rates obtained from a field emission gun (FEG) (dose rate = 26 000 A cm−2, probe size = 1 nm, spectral resolution ∼ 0.9 eV), the spectra show the
Table 1. Probe sizes, dose and dose rates.
Probe diameter Dose rate Dose Dose Dose
(A cm−2) (C cm−2) 5 s (C cm−2) 10 s (C cm−2) 15 s
1 nm FEG 25 000 125 000 250 000 375 000
4 nm LaB6 160 800 1600 2400
5 sec 10 sec 15 sec 5 sec 10 sec 15 sec 1 sec 0.5 sec 5 sec 15 sec 1 sec 0.5 sec 5 sec 15 sec 5 sec 10 sec 15 sec 3 sec 9 sec 15 sec 345 350 355 360
Energy loss (eV)
520 530 540 550 560
Energy loss (eV)
520 530 540 550 560
Energy loss (eV)
Counts
345 350 355 360
Energy loss (eV)
Counts
Counts
Counts
120 130 140 150 160
Energy loss (eV)
120 130 140 150 160
Energy loss (eV)
Counts
Counts
Ca O P
Fig. 3. Effect of the probe size (top line: probe size: 4 nm, dose rate 160 A cm−2, spectra acquisition time 5 s or 3 s; bottom
line: 24 nm, dose rate 70 A cm−2, spectra acquisition time 0.5 s or 5 s) on the evolutions during irradiation as a function of the
total irradiation time of the Ca, O and P signals in hydroxyapatite. The loss of resolution due to increased energy dispersion of the spectrometer prevents observing of the two HAP characteristic peaks in the oxygen K-edge signals corresponding to the 4 nm probe size.
Fig. 4. β-TCP Oxygen K-edge signal showing a pre-peak at 531 eV and a shoulder at 536 eV (probe size 24 nm, acquisition time 10 s).
following transformations at observed at prolonged irra-diation times:
– Low loss signal (Fig. 6): a change of shape hence a structural change is observed. This structural change is very quick as revealed by the differences between low loss signal at t = 0.1 s in Figure 6 and the low
Fig. 5. CaO calcium L2,3 edge signal (probe size 24 nm, dispersion 0.05 eV/ch).
loss signals in Figure 2 at lower dose rate. Moreover a continuous loss of mass is revealed by these spectra. However the rate of this mass loss seems to reduce with irradiation time;
– Phosphorus L2,3 edge signal (Fig. 7): a continuous
mass loss is observed, the phosphorus signal is faint at the highest irradiation times;
-5 0 5 10 15 20 25 30 35 40 45 50 55
Counts
Energy loss (eV)
t = 0,1 s t = 1 s t = 5 s t = 10 s
Fig. 6. Evolution of the HA low loss signal as a function of the total irradiation time. Probe size 1 nm; acquisition time
for each spectrum 0.1 s, dose rate 25 000 A cm−2.
120 130 140 150
Counts
Energy loss (eV)
t = 0,2 s t = 1 s t = 5 s t = 10 s
Fig. 7. Evolution of the HA phosphorus signal as a function of the total irradiation time. Probe size 1 nm; acquisition time
for each spectrum 0.2 s, dose rate 25 000 A cm−2. Phosphorus
L2,3 edge signals is not subtracted from the background.
– Calcium L2,3edge signal (Fig.8): the mass loss is small
between 5 s and 10 s. Beyond 5 s, a doubling of the peaks characteristic of the formation of CaO is ob-served. This is not as obvious as for the pure CaO sample (see Fig.5), it is likely that we have a mixture of phases. Furthermore, the signal is weak as it was obtained after an important mass loss;
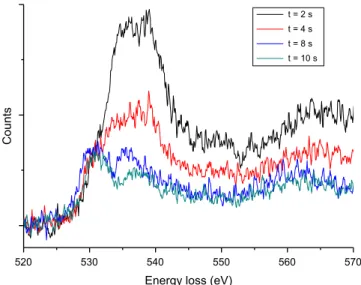
– Oxygen K-edge signal (Fig.9): an important variation of the edge shape and a strong variation of mass loss is observed up to 8 s of irradiation but the mass variation is small beyond 8 s of irradiation. This change of shape also indicates a quick structural change of the sample.
345 350 355 360
Counts
Energy loss (eV)
t = 0,5 s t = 1 s t = 5 s t = 10 s
Fig. 8. Evolution of the HA calcium signal as a function of the total irradiation time. Probe size 1 nm; acquisition time for
each spectrum 0.5 s, dose rate 25 000 A cm−2. Calcium L2,3
edge signal is subtracted from the background.
520 530 540 550 560 570
Counts
Energy loss (eV)
t = 2 s t = 4 s t = 8 s t = 10 s
Fig. 9. Evolution of the HA oxygen signal as a function of the total irradiation time. Probe size 1 nm; acquisition time for
each spectrum 2 s, dose rate 25 000 A cm−2. Oxygen K-edge
signal is subtracted from the background.
7 Conclusion
In this work, we have investigated the effect of electron irradiation on stoichiometric hydroxyapatite (Ca10(PO4)6
(OH2)) using STEM-EELS using a LaB6and a field emis-sion gun equipped microscopes. We have obtained con-tradictory information on the initial irradiation stages. No modification of the low loss EELS spectra was ob-served between 0.1 s and 5 s, but we cannot exclude that the absence – on the HA spectra, of the pre-peak ob-served onβ-TCP spectra is due to initial damage. We did not observe mass loss in the low-loss and in the different
elemental (Ca, P, O) spectra during irradiation (no change of spectra intensity) for the two different probe diame-ters: 4 nm (dose rate = 160 A cm−2) and 24 nm (dose rate = 70 A cm−2), although the corresponding dose rates are different. It is important to note that detailed spectra of all chemical elements inside the hydroxyapatite lattice (except for H) using a probe diameter as small as 4 nm can be obtained. No formation of CaO was observed in all the spectra.
Signal modifications are observed at the dose rate ob-tained with the FEG (∼25 000 A cm−2, probe diame-ter = 1 nm) for the low loss, Ca, O and P signals. This implies the necessity of using lower dose rates for the study of HA samples.
This result will be very useful for the examination of nanosized particles or for investigating fine structural vari-ations across single particles.
We acknowledge the technical support from the Reims ICT IBiSA Biological Imaging Centre. The authors with to thank Dr. Alexandre MUSSI (UMET, Lille, France) for help. JRG ac-knowledges the CONACYT (Ref. No. 203257) and the PASPA-DGAPA-UNAM program (Com. 053/2013) for the economical support for the sabbatical stay at the University of Lille 1, France.
References
1. H. Sicher, Orban’s Oral Histology and Embryology (Mosby, Saint Louis, 1962)
2. R. Lakes, Nature 361, 511 (1993)
3. C. Rey, C. Combes, C. Drouet, H. Sfihi, A. Barroug, Mater. Sci. Eng. C 27, 198 (2007)
4. M. Okazaki, Y. Yoshida, S. Yamaguchi, M. Kaneno, J.C. Elliott, Biomaterials 22, 2459 (2001)
5. D. Eichert, C. Drouet, H. Sfihia, C. Rey, C. Combes,
Nanocrystalline Apatite-Based Biomaterials (Nova,
Science Publishers, New York, 2011)
6. E.I. Suvorova, V.V. Klechkovskaya, V.F. Komarov, A.V. Severin, I.V. Melikhov, P.A. Buffat, Crystallogr. Rep. 51, 881 (2006)
7. R.M. Imanov, V.V. Klechkovskaya, E.I. Suvorova,
Crystallogr. Rep. 56, 650 (2011)
8. ´E.F. Br`es, D. Cherns, R. Vincent, J.-P. Morniroli, Acta
Crystallogr. B 49, 56 (1993)
9. T. Aoba, J. Takahashi, T. Yagi, M. Okazaki, Y. Moriwaki, J. Dent. Res. 57, 708 (1978)
10. R.F. Egerton, P. Li, M. Malac, Micron 35, 399 (2004)
11. I.-T. Bae, Y. Zhangn, W.J. Weber, M. Ishimaru,
Y. Hirotsu, M. Higuchi, Nucl. Instrum. Methods Phys. Res. B 266, 3037 (2008)
12. J. Reyes-Gasga, R. Garcia-Garcia, Radiat. Phys. Chem. 64, 359 (2002)
13. D.G.A. Nelson, J.D. McLean, J.V. Sanders, Radiation Effects Letters 68, 51 (1982)
14. J. Reyes-Gasga, R. Garcia-Garcia, E.F. Br`es, Physica B:
Condens. Matter 404, 1867 (2009)
15. Z.L. Dong, T.J. White, K. Sun, L.M. Wang, R.C. Ewing, J. Am. Ceram. Soc. 88, 184 (2005)
16. S. Nicolopoulos, J.M. Gonzalez-Calbet, M.P. Alonso, M.T. Gutierrez-Rios, M.I. de Frutos, M. Vallet-Regi, J. Solid State Chem. 116, 265 (1995)
17. B. Senger, E.F. Br`es, J.L. Hutchison, J.-C. Voegel, R.M.
Frank, Philos. Mag. A 65, 665 (1992)
18. ´E.F. Br`es, G. Moebus, H.J. Kleebe, G. Pourroy,
J. Werkmann, G. Ehret, J. Cryst. Growth 129, 149 (1993)
19. E.F. Br`es, J.L. Hutchison, B. Senger, J.-C. Voegel,
Ultramicros. 35, 305 (1991)
20. P. Eddisford, A. Brown, R. Brydson, J. Phys.: Conf. Ser. 126, 012008 (2008)
21. S.Ch. Liou, S.Y. Chen, H.Y. Lee, J.S. Bow, Biomaterials 25, 189 (2004)
22. G. Gregori, H.J. Kleebe, H. Mayra, G. Ziegler, J. Eur. Ceram. Soc. 26, 1473 (2006)
23. R. Drevet, H. Benhayoune, J. Michel, Journal of
Biomaterials and Tissue Engineering 1, 68 (2011) 24. R.B. Heimanna, R. Wirth, Biomaterials 27, 823 (2006) 25. ´E.F. Br`es, T. Duhoo, N. Leroy, J. Lemaitre, Zeitschrift f¨ur
Metallkunde 96, 503 (2005)
26. R.M. Flower, Earth Planet. Sci. Lett. 277, 148 (2009) 27. A. Meldrum, L.M. Wang, R.C. Ewing, Am. Mineral. 82,
858 (1997)
28. J. Reyes-Gasga, E.L. Martinez-Pi˜neiro, E.F.´ Br`es,
J. Microsc. 248, 102 (2012)
29. L. Reimer, Transmission Electron Microscopy, Springer Series in Optical Sciences (Springer, Berlin, 1984) 30. D.G.A. Nelson, J.D. McLean, Calcif. Tissue Int. 36, 219