1 1
Ohmic Drop in LiFePO4 Based Lithium Battery Cathodes Containing Agglomerates 2
R. Cornut,* D. Lepage,** and S. B. Schougaard*,z 3
Department of Chemistry, Université du Québec à Montréal, Montreal, Quebec H3C 3P8, Canada 4
*Electrochemical Society Active Member. 5
**Electrochemical Society Student Member. 6
7
Summary 8
In the present study, the importance of thorough active material and carbon mixing for the 9
performance of LiFePO4 based electrodes was investigated experimentally and theoretically. A 10
simple transformation of experimental data was introduced to identify the portion of the 11
discharge curves that corresponds to an ohmic response. This section of the experimental data 12
was subsequently modelled using a local Ohm’s law to describe the transport in different media, 13
including agglomerates. From the fitted data, it was shown that the mixing procedure has a 14
profound effect on agglomerate size and size polydispersity. Further, an analytical approximation 15
of the discharge curves integrating the agglomerates transport parameter and size distribution 16
broadness was proposed in order to facilitate future comparison between experiments and model. 17
Manuscript submitted November 1, 2011; revised manuscript received February 28, 2012. Published xx 18 xx, xxxx. 19 20 21 1. Introduction 22
2
Improvement of battery performance is an important academic and industrial research field, 1
which is essential for many new applications, such as electric and hybrid vehicles. In this field, 2
there are an increasing number of studies dealing with secondary lithium batteries, since these 3
offer numerous attractive features, including low cost and high energetic density. Over the past 4
30 years, the electrode structure of the lithium systems has been studied extensively, both 5
experimentally and computationally.1-7 Intrinsically, these electrodes have a complex structure, 6
as they are required to ensure, in addition to charge storage, the transport of electrons and ions. 7
Because of this complex role, they are inherently inhomogeneous aggregates of multiple 8
constituents: active materials, electrolyte, binder and other additives. As an illustration, 9
aggregation of material in the porous electrodes is regularly observed with electron 10
microscopy.8,9 More recently, broadband dielectric spectroscopy10 has been used to evaluate the 11
electronic transport properties occurring at the various scales inside porous cathodes. This latter 12
study suggests that aggregates are likely to have an impact on the overall electrochemical 13
behaviour of the system. 14
The complex structure of the materials, combined with the coupled nature of the subprocesses 15
that occur during the discharge, has motivated a large number of theoretical studies on the 16
subject (See 11 and references therein). In order to reproduce the experimental potential drop 17
corresponding to the discharge of a lithium battery, a common approach is to model the electrode 18
as the macro-homogeneous superposition of two media transporting the electronic and ionic 19
charges, in addition to the transport of ions inside the active material particles.12-15 Over the 20
years, this approach has been made more complex in order to improve the ability of the models 21
to reproduce experimental data,16 e.g. some studies discuss the role of materials with more than 22
one particle size.17,18 In such cases, the inter particle contacts are predicted to be of great 23
3
importance.19 For example, the hysteresis observed during galvanostatic charge-discharges has 1
been reproduced in numerical simulations by considering multiple particle sizes combined with 2
contact resistances.20 In addition to studies based on well-organized structures, some focus has 3
been given to systems having more random repartition of material size.3,21,22 Finally, other 4
studies have explicitly taken the presence of agglomerates into account.6,23 Among all the 5
theoretical studies, only a few have focused on the ohmic drop24,25 contributions. 6
In the present work, the role of large agglomerates arising from poor mixing of the electrode 7
constituents is investigated experimentally. We show that the aggolomerate size has a large and 8
ohmic impact on the electrochemical performances at low dept of discharge. The origin of this
9
resistance is then investigated from a theoretical perspective. The macrohomogeneous 10
superposition of transport media is used to model the ohmic loss occurring in electrodes made up 11
of agglomerated primary particles. Situations where the agglomerates have polydispersed sizes 12
distribution are considered. An analytical approximation that integrates the size distribution 13
parameter and the transport parameter is then proposed, which greatly simplifies further 14
interpretations of experimental data within the introduced model. The comparison to experiments 15
shows a good ability of the model to reproduce data obtained from electrode coatings with 16
different levels of mixing. 17
18
2. Experimental Procedure 19
The Electrochemical analysis is based on C-LiFePO4 from Phostech Lithium (P1 grade, Saint-20
Bruno de Montarville, Canada) mixed with 10 % of carbon (EBN1010). Two mixing methods 21
were used: 1) Poorly mixed hereafter, was obtained by manual mixing of C-LiFePO4 and carbon 22
4
using mortar and pestle. This mixture was added to the solution of PVDF (Kynar® KF Polymer 1
W#1100) in N-methylpyrrolidone (Aldrich) and a suspension was formed by agitation with a 2
magnetic stir bar. 2) Well mixed hereafter, was obtained using a mechanical mixing system. 3
Specifically, C-LifePO4, carbon and PDVF solution was blended in a jar mills with zirconia 4
grinding media (Paul N. Gardner Company) overnight. The suspensions were coated onto carbon 5
coated Al foil (Exopack #2651) to form the cathodes, followed by drying at 60°C for three hours 6
in ambient air and at 60°C under vacuum overnight. The resulting cathode coating, with a 7
thickness of ~40 µm and density of ~1.2g/ml, contained 6 wt-% PVDF, 84 wt-% active 8
materials, and 10 wt-% black carbon. 9
CR2032-type coin cells were assembled from the composite coated Al-foil (cathode) and 10
lithium foil (anode) separated by a by Celgard 2500 polymer film in an Argon atmosphere glove 11
box (H2O < 1 ppm, O2 < 1 ppm), using 1 M LiPF6 in a 1:1 ethylene carbonate and dimethyl 12
carbonate (Novolyte Technologies) as the electrolyte. Constant current cycling was performed 13
between 2.2 to 4.2 V using a Bio-Logic VMP®3 potentiostat and a charging rate of C/10. The 14
coin-cell battery was cycled five times at C/10 for stabilization, before data collection. 15
To measure the electronic conductivity, the cathode mixtures were coated onto glass sides, using 16
the same procedure as for the cathodes of the coin cells. The conductivity measurements were 17
performed by the Van der Pauw26 method using a home-build measuring station (Keithley 18
instruments inc.: 7001 switch system, 6220 precision current source and 2000 multimeter). 19
3. Experimental characterization of the ohmic drop contribution 20
5
3.1. Experimental investigation of the importance of mixing. 1
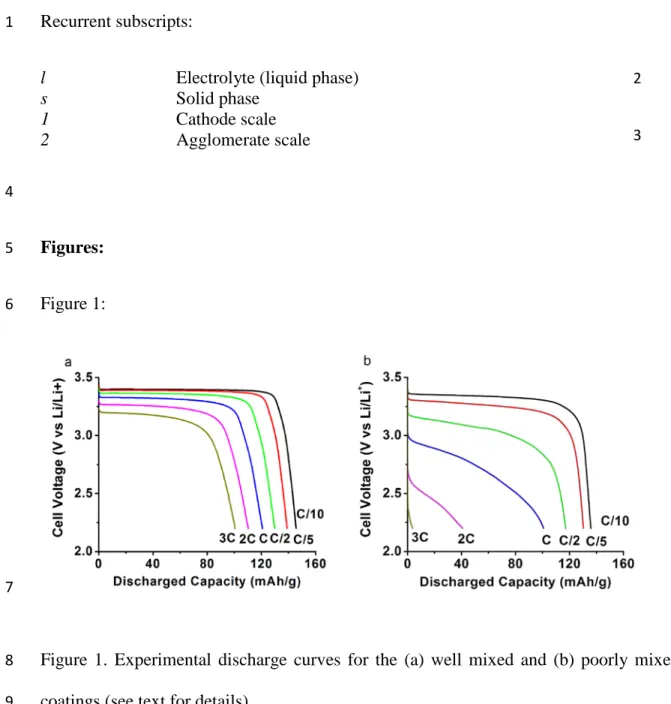
The experimental discharge curves, for the poorly and well mixed cathode coatings (Figure 1), 2
clearly show that mixing has a strong effect on performance, and that this effect is amplified as 3
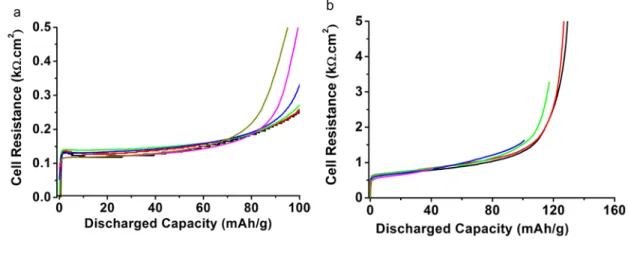
the discharge rate increases. These discharge curves are transformed in Figure 2 to examine the 4
validity of a model based on ohmic charge transport. Briefly, when the term (UI=0-Ucell)/I is 5
independent of the current and therefore the charge rate, the system behaves ohmically. It is 6
these situations, and only these, that are investigated in the following. Importantly, UI=0, i.e. the
7
insertion voltage extrapolated to zero current, here ~3.40 V vs. Li+/Li, should not be confused 8
with the thermodynamic potential (E0(Li1-xFePO4) ~3.43V), as the latter does not account for the 9
empirical polarization gap i.e. the minimum polarization required to observe non-zero current 10
flow.5 Further, due to the two phase nature of the Li1-xFePO4 system UI=0 and E0 are not
11
functions of depth of discharge (DoD). 12
Examining Figure 2, the ohmic approximation is valid up to DoD=50%, for C/10-3C rates for the 13
well mix sample and for C/10-C rates for the poorly mixed sample. Outside this range, at the end 14
of the discharge, the brutal increase of (UI=0-UI)/I, strongly dependent on the discharge current.
15
The origin of this brutal change of performance may be accumulation of inserted species inside 16
the active material particles, or electrolyte depletion. The present study does not deal with such 17
events, which have already been investigated extensively.12,13,15,20 Instead, we focus on the DoD 18
range where an ohmic response is obtained. 19
4. Theoretical investigation of the origin of the ohmic potential drop 20
4.1. Presentation of the models 21
6
4.1.2. Basic approach: presentation of the agglomerate framework
1
Focusing on the ohmic response, we consider the situations where the diffusion of inserted 2
species inside the particles and the ion diffusion in electrolyte are not influencing the 3
performances, as these are not compatible with an ohmic response of the electrode, vide supra. 4
This greatly simplifies the model. The general framework used for interpreting the origin of the 5
resistance is based on the idea that the complex electrochemical behaviour of a lithium battery 6
cathode, heterogeneous at the microscopic scale, can be modelled by Butler-Volmer charge 7
transfer kinetics combined with charge transport in different superposed continuum. Each media 8
is characterized by an effective transport parameters, derived using the averaged effect of the 9
microscopic tortuosity of the conduction path in the media. Usually, two scales are modelled12; 10
the transport of charges through the cathode (between the separator and the collector), and the 11
transport of inserted material in the active particles. In the study of Dargaville and Farrell23, 12
which serves as a basis for the present model, an additional scale is considered in-between i.e. 13
transport of charge inside the agglomerates. Considering this additional scale with distinct 14
transport properties is justified here by the importance of mixing, i.e the disintegration of 15
agglomerates. 16
An alternative to the model chosen here would be resistive reactant approach.16 It considers that 17
the decrease of the cathode potential during the discharge stems from the electrons being brought 18
non uniformly to the exterior of particles, so they travel an additional distance (for example 19
through the carbon surrounding the particles) before insertion. This additional distance increases 20
during the discharge, and is thus associated with an increasing potential drop. The principle of 21
the two approaches is similar, as they both consider the origin of discharge curve slope to be an 22
increase of transport distance. In one case, the transport media is the agglomerates, in the other; 23
7
it is the carbon coating surrounding the particles. There are however substantial practical 1
differences between the two approaches. The resistive reactant model as it is developed in the 2
literature16,20 only considers a finite number of transport lengths. In addition, the non uniformity 3
of the insertion rate at the exterior of the particles implies that the transport inside the particle is 4
non-spherical, which is difficult to model. We therefore employ the agglomerate model, which 5
has the added advantage that it can be rigorously implemented within the framework of 6
superposition of macrohomogeneous media. Further, the present study will show that a simple 7
analytical approximation can be found for the commonly encountered case of performance 8
limited exclusively by the transport inside the agglomerates. As such the model is very 9
accessible for interpretation of experimental data. 10
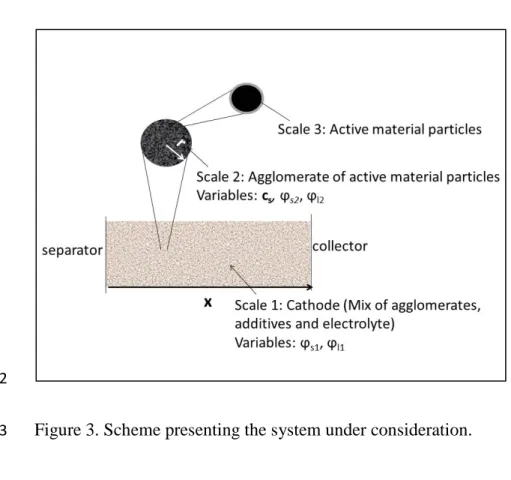
The model used in the present study operates with three length scales: Cathode, Agglomerate and 11
Particle, labelled 1,2,3 respectively (Figure 3). As explained previously, the study is focused on 12
the situations where the transport of inserted Li ions inside the active material is non-limiting. As 13
a consequence, the concentration cs of lithium ions, in a given active material particle is constant.
14
This is in keeping with the experimental finding that partly delithiated LiFePO4 consists of 15
particles that are almost fully lithiated or fully delithiated.7,27 However, cs is still a function of the
16
position of the active particle inside the agglomerate (r) and of the agglomerate position between 17
the collector and the separator (x). An analysis of the conservation of matter leads to 18 3 0 2 0 , 2 3 4 4 ) , ( ) , ( r r F x r i t x r cs loc π π − = ∂ ∂ [1] 19
where i2,loc is the local insertion rate inside agglomerates and r0 the radii of the active material
20
particles. A list of symbols is provided at the end of the paper for the readers convenience. i2,loc
8
depends on the potentials of the solid and liquid phases inside the agglomerates according to a 1
Buttler-Volmer kinetics law: 2
(
)
( )(
)
− = − − − − s − l − o o l s E RT F E RT F loc i e e i2, 0 α ϕ2 ϕ2 1α ϕ2 ϕ2 [2] 3where E0 refers to the local thermodynamic potential of the active material and the exchange 4
current density i0 has an expression that usually involves cs, the electrolyte concentration ce
5
(considered constant in the present study) and a kinetics constant k0:
6
( ) (
α)
α α s s s e c c c c k i0 = 0 max − [3] 7The insertion process consumes Li ions and electrons. It is therefore necessary to bring them to 8
the positions where the insertion reaction takes place. Before insertion, the transport successively 9
occurs in two different media: inside agglomerates and through the cathode, as shown in Figure 10
3. As such, a local ohm’s law equation system that describes both is derived (see supporting 11
information) 28. The associated transport parameters are: σs1 for the cathode scale electronic 12
conductivity, σs2 for the agglomerate scale electronic conductivity, κl1 for the cathode scale ionic 13
conductivity and κl2 for the agglomerate scale ionic conductivity. 14
4.1.2. The moving insertion front within agglomerates approximation.
15
The equation system described above can be greatly simplified through the introduction of a new 16
variable, Rtrans, accounting for the global state of discharge of an agglomerate. (see supporting
17
information section 1.2) 28. Briefly, at a given position between the collector and the separator, 18
the discharge occurs from the outside of the agglomerates towards the center. In a given 19
agglomerate there is therefore a transition from low to high lithium concentration. This transition 20
9
will be diffuse if the charge transport is fast compared to the charge transfer. Conversely, if 1
charge transport is slow compared to particle insertion kinetics, the transition will be sharp. In 2
the latter case it is possible to define two zones inside an agglomerate: one containing particles 3
with high concentration of inserted species (the shell), and one with particles of lower insertion 4
concentration (the core). Rtrans is here defined as the location of frontier between these two zones.
5
As such, it is a measure of the agglomerate state of discharge, which in turn is dependent on the 6
time t and on the position inside the cathode (x). 7
The principles of this approach have similarities with the moving front approach used to model 8
the charge transport trough the cathode,2,24,25 yet to the best of our knowledge, this approach has 9
never been used in an equation system considering agglomerates. Importantly, the present 10
approach differs from the conventional moving insertion front applied at the cathode scale, as 11
here, insertion occurs simultaneously at a range of positions inside the cathode. 12
The introduction of the moving insertion front allows for a large gain in computational time, and 13
in some limiting cases the problem may even be resolved analytically. This is for example the 14
case when the charge transport is exclusively limited by the transport inside the agglomerates. In 15
this case, the potential drop is given by: 16 − − + − = = 1 ) 1 ( 1 1 1 3 2 2 13 2 0 0 D o D AreaL R I U U s l s agglomerte cath I cell ε κ σ [4] 17
In this equation, R0 is the radius of an agglomerate, εagglomerates is the volume fraction of
18
agglomerate at the cathode scale, DoD is the degree of discharge of the battery. From Eq. 4 it is 19
clear that the ionic and electronic conductivities cannot be determined independently, thus in the 20
10
absence of reliable experimental conductivity data specific to the agglomerate, only the 1
combined agglomerate resistivity + = Ω 2 2 2 1 1 s l σ κ is considered. 2
4.1.3. Modeling of agglomerates with multiple sizes
3
This sections deals with the importance of modeling a distribution agglomerate sizes rather than 4
a single size. For this purpose, a new variable, y, is introduced, that accounts for the size of the 5
considered agglomerate. In the general situation, this leads to a concentration of inserted species 6
inside the agglomerates that is a function of x, R, T and y. In this context, the location of insertion 7
front, Rtrans, is now a function of x, T and y. The equation system is similar to the one considering
8
only a single agglomerate size, except that at a given position inside the cathode, the charge 9
injection current is the overall sum of the weighted contributions of each size (see supporting 10
information) 28. Importantly, this methodology is applicable regardless of size distribution type, 11
so in the following, the usual case of a Gaussian distribution is considered. This leads to the 12
introduction of a new parameter, i.e. the relative broadness of the distribution δRa (δRa = δR/Rc, 13
where δR is the distribution broadness and Rc is the radius of the agglomerate having the largest
14
volume fraction). The impact on the discharge curves of this parameter is discussed section 4.3.2. 15
4.2. Solution procedure 16
The partial differential equations system was solved numerically using the finite elements 17
method implemented in the commercially available software Comsol version 3.5a. The maximal 18
size of the mesh was set to 0.001 and 0.01 for 1D and 2D domains, respectively, and the relative 19
tolerance was fixed at 10-4. It was confirmed that the limiting behaviour, such as, the one 20
predicted by Eq.4 were obtained. For the validation of the numerical resolution in the case of 21
11
polydispersed agglomerates, it has been confirmed that for δRa=0, the same results as for the
1
monodispersed model were obtained. 2
Numerical resolutions lasted few seconds for 1D problems, and few hours for a multiple size 3
repartition, using Quad CPU 2.5 GHz Intel Processor with 8 GB of RAM. 4
5
4.3. Validation and exploitation of the models 6
4.3.1. Validity conditions of the insertion front approach
7
Introduction of a moving front for the insertion of Li ions into the agglomerates resulted in a 8
significant decrease of the problem complexity, the trade-off being a more limited validity range. 9
This is illustrated in this section by comparing the results from the insertion front approximation 10
to those obtained with the complete model. The validity of the insertion front approach mainly 11
depends on the parameters defined at the agglomerate scale, such as the electronic and ionic 12
conductivities, and the kinetics constant of the preexponential term in the Buttler-Volmer 13
equation (k0). To explore the situation where the transport inside the agglomerates (as opposed to
14
that through cathode) is the limiting factor, the fast cathode transport limit (σs1 >> σs2 and κl1>> 15
κl2) has been simulated. In this limit, the insertion reaction is constant throughout the cathode and
16
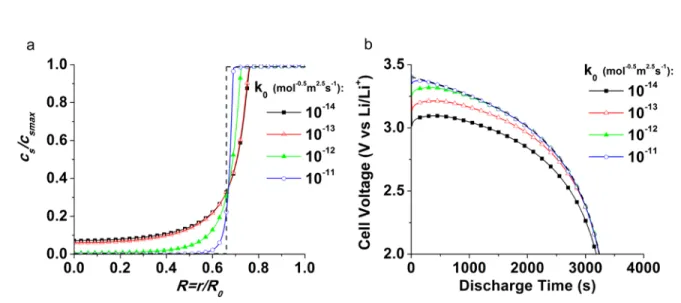
resolution of the problem at a single X position is sufficient. Figure 4a shows the concentration 17
profiles inside the agglomerates for different values of k0 according to the more general model at 18
a given time t=2500 s (DoD=0.7) for the same set of parameters (1C discharge, r0=10-7 m,
19
R0=10-6 m, c0=1 mol/L, csmax=22.6 mol/L, κl2=2 10-7 S/m, σs2=2 10-7 S/m, α=0.5, δRa=0, and
20
T=298 K). The chosen conductivity values are in accordance with the values found for “poor”
21
and “well” mixed cases, considering a realistic agglomerate density of 0.3 vide infra. As 22
12
expected for a cathodic discharge process, the concentration of inserted Li ions in the 1
agglomerates decreases from the outside (R=1) to the center (R=0), and the transition region 2
between the high (shell) and the low concentration zones narrows as k0 increases. For the chosen 3
parameter combination, and k0=1 10-11 mol/(m2s(mol/m3)1.5, more than 95 % of the transition is 4
restrained between R=0.6 and R=0.7. Using the same conditions, the insertion front model 5
predicts Rtransa≈0.65 at T=2500s (Figure 4a, dashed line). This validates our moving insertion
6
front model, as the large k0 limit of the general model. However, given that the concentration
7
profiles are not experimentally available, it is more appropriate to estimate the effect of the 8
moving front approximation by examining the evolution of the cell voltage as a function of time. 9
Figure 4b shows the discharge curves obtained under the same conditions as Figure 4a. The 10
discharge curve predicted by Eq. 4 (moving front model (dotted line)) and the basic model 11
(empty circles) overlap for the fastest kinetics tested, confirming the validity of the moving front 12
model at large k0. Moreover, the discharge curves differ only up to about 10% from the moving
13
front limit (Figure 4b) when considering the large range of k0 values found in the literature (10
-14
14-10-10 mol/(m2s(mol/m3)1.5).20,29 This represents an acceptable approximation, given the gain in 15
calculational simplicity derived from the insertion front model. Further, using this simplified 16
more robust model, avoids “over fitting”, i.e. the situation where numerous parameter 17
combinations are able to fit the experimental data. Moreover, the potential drop associated with 18
limited insertion kinetics are typically non ohmic, and therefore easily recognized as non 19
overlapping curves in the plot of (UI=0-UI)/I transformed galvanostatic data like Figure 2.
20 21
4.3.2. Impact of a distribution in the size of the agglomerates
13
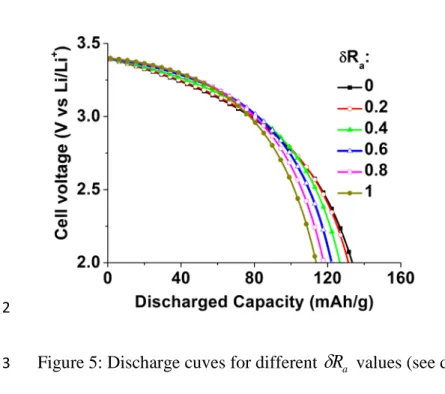
This section treats the situation corresponding to polydispersed agglomerates with a Gaussian 1
distribution characterized by a dimensionless broadness δRa≠0 (see supporting information) 28.
2
Using the fast cathode transport limit (σs1 >> σs2 and κl1>> κl2) again, Figure 5 shows the 3
discharge curves produced by the polydispersed model at different size distribution broadnesses 4
a
R
δ
for R0=10-6 m, I=1 mA, Ω2=7 106 Ωm, L
cath=40 µm, εagglomerates=0.3, Area=1.3 cm2 and a
5
maximal capacity of the battery equal to 155 mAh/g. From the data it is clear that as
δ
Ra 6increases, the potential loss during the beginning of the discharge tends to be smaller, while 7
during the end of the discharge, the potential loss tends to be larger, i.e. an increase in the size 8
distribution broadness increases the concavity of the discharge curves (and the convexity of the 9
cell resistance curves as they are presented Figure 2). We interpret this as follows: at a given 10
position inside the cathode, small agglomerates are fully inserted first, so that at longer discharge 11
times, only bigger agglomerates are involved in the insertion process. The associated increase of 12
transport path makes the potential loss more pronounced. In the limiting case of agglomerate 13
charge transport exclusively restricting performance an analytical approximation can now be 14 found: 15
(
)
− + + − Ω − = + = 1 5 . 0 1 53 . 0 1 1 1 3 13 75 . 4 96 . 1 5 . 0 1 35 . 1 2 2 0 0 DoD R DoD R AreaL R I U U a R a s agglomerte cath I cell a δ δ ε δ [5] 16Valid for δRa<2 and
(
)
1 0.5 5 . 0 1 53 . 0 1 1 1 3 1 75 . 4 96 . 1 5 . 0 1 35 . 1 < − + + − + DoD R DoD R a R a a δ δ δ. This limit corresponds in 17
practice to a DoD smaller than 0.7 for δRa =2 and smaller than 0.95 for δRa =0. Larger discharged
14
fractions lead to very large slopes of the potential drop, which are highly sensitive to the 1
experimental conditions. Eq. 5 greatly simplifies the use of the previously introduced model 2
during data analysis, as detailed in the next section. 3
4
4.3.3. Model fitting and experimental parameter determination
5
At first, the effect of the cathode scale electronic and ionic conductivities are estimated using 6
experimental values. As such, we found by van der Pauw electronic conductivity measurements 7
an electronic resistance of 2.7 10-5 kΩ.cm2 for the sample in Figure 1a. Similarly, the ionic 8
conductivity on the cathode scale was estimated to 1.3 10-3 kΩ.cm2 using tabulated density 9
values of the electrode constituents and the electrolyte conductivity (0.78 S/m) 30, combined with 10
the experimental electrode density and Bruggeman’s correction (κeff =ε1.5κo).15 11
The cathode scale conductivities are therefore only a minor perturbation (<2%) to the measured 12
resistivities (Figure 1), and the use of Eq. 4 and 5 is appropriate for the present data analysis. 13
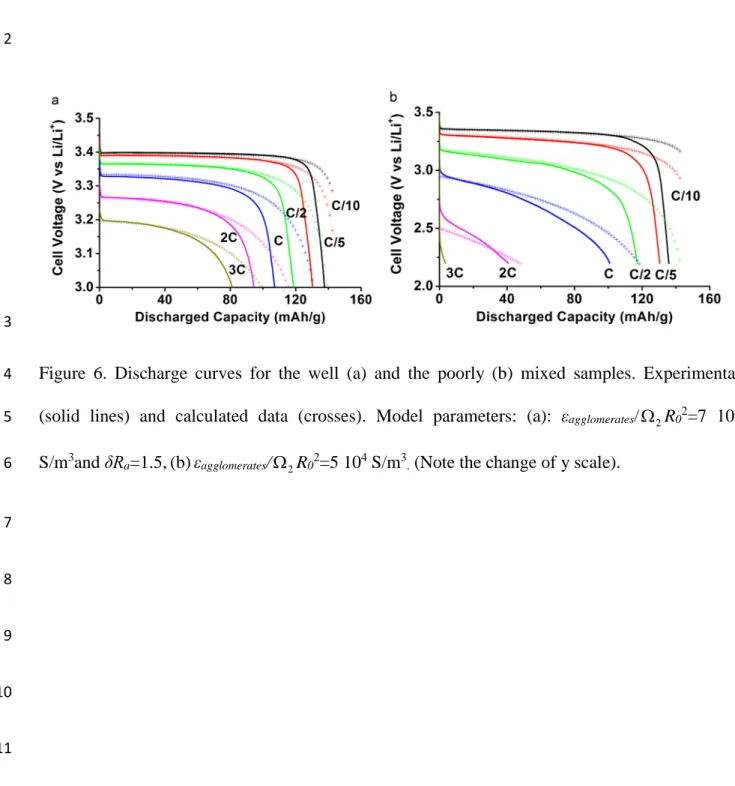
Figure 6a and 6b shows the comparison of the experiments with the agglomerates model. A 14
constant resistive term has been added in Eq. 4 and 5, to account for charge transfer resistance at 15
the lithium anode foil, contact resistances between the collector and the cathode etc. For both 16
sets of data, the first parts of the discharge curves identified as belonging to a ohmic response 17
situation (Figure 2), are well reproduced by the model, that contains a limited (typically 2) 18
number of adjustable parameter: Using Eq. 4, a good fit is obtained with εagglomerates/(Ω2R02) = 5 19
104 S/m3 for the “poorly mixed” data set (Figure 6b). For the “well mixed” data set (Figure 6a) a 20
good fit was only achieved after considering a non-zero agglomerate size distribution. This result 21
15
is in accord with the small but clear curvature of the curves in Figure 2a. In fact, the presented fit 1
(Figure 6a) is obtained for εagglomerates/(Ω2R02)=7 105 S/m3 and δRa=1.5. Assuming that
2
εagglomerates/Ω2 is unaffected by mixing, this means that the 24 hour jar mills blending, results in a
3
fourfold decrease of the agglomerate radii, and a significant increase in the width of the size 4
distribution. In fact, the size distribution δRa=1.5 indicates that agglomerates that are two times
5
larger than the most occurring agglomerate have a volume fraction of about 65%! This suggests 6
that the different agglomerates have not been broken up to the same degree. 7
In summary, mixing has a profound effect on the restive part of discharge curve, i.e. well before 8
concentration gradients impact the performance. Fundamentally, this is due to the large 9
difference in transport properties on the cathode and the agglomerate scale. 10
Conclusion 11
The present study provides a simple method to identify the ohmic response of LiFePO4 based 12
electrodes during constant current discharges. We used this method to show that the ohmic 13
contribution is more important for poorly mixed electrode, compared to well mixed ones. To 14
quantitatively examine this effect a modelling framework based on three scales, cathode, 15
agglomerate and particle, was defined using a local ohms law approach. Further, the possibility 16
for polydispersed agglomerates was included into the model. 17
This model was used to show that the roller milling employed to prepare the well mixed 18
electrode reduces the average agglomerate size by a factor of about 4, while the size distribution 19
broadens. The developed framework can be used in future work to determine the effect of 20
different agglomerate dispersion strategies. 21
16 Acknowledgements
1
The authors wish to acknowledge UQÀM for financial support. Jason Vachon and Vanessa 2
Labet are acknowledged for technical support and useful discussions during the preparation of 3 this manuscript. 4 List of Symbols 5 Symbol Name
x Distance from separator, m
r Distance from center of aggregates, m
t Time, s
κ Ionic conductivity, S/m
σ Electronic conductivity, S/m
i0 Exchange current density, A/m2
k0 Rate constant of the electrochemical reaction mol/(m2s(mol/m3)1.5)
i2,loc Local insertion rate (agglomerates scale), A/m2
ϕ Electric potential, V
α Transfert coefficient
E0 Thermodynamic standard potential, V
cs Local concentration of inserted Lithium, mol/L
cs,max Maximal concentration of inserted Lithium, mol/L
ce Electrolyte concentration, mol/L
F Faraday constant, C/mol
R Universal gaz constant, J/(molK)
T Temperature, K
Lcath Thickness of cathode, m
εagglomerates Volumic fraction of agglomerates at cathode scale
I Current, A
Area Electrode surface, m2
R0 Radius of an agglomerate, m
r0 Radius of active material particles, m
Rtrans Insertion front position (reference: center of the agglomerate), m 6
Multiple size model: 7
Rc Radius of the agglomerates having the largest volumic fraction, m
δR Radius repartition broadness, m
y Agglomerate radius difference from Rc, deivided by δR
δRa Dimensionless radius repartition broadness 8
17 Recurrent subscripts: 1 2 3 4 Figures: 5 Figure 1: 6 7
Figure 1. Experimental discharge curves for the (a) well mixed and (b) poorly mixed cathode 8
coatings (see text for details). 9
10
l Electrolyte (liquid phase)
s Solid phase
1 Cathode scale
18 Figure 2:
1
2
Figure 2. Experimental cell resistance ((UI=0-Ucell)/I*Area) calculated from the data in Figure 1.
3
19 Figure 3:
1
2
Figure 3. Scheme presenting the system under consideration. 3
20 Figure 4:
1
2
Figure 4. Concentration profiles at t=2500 s inside the agglomerates (a) and predicted theoretical 3
discharge curves (b), in the case of homogeneous insertion rate through cathode (see text for 4
details). The dashed lines present the results of the moving insertion front model. 5
6 7
21 Figure 5:
1
2
Figure 5: Discharge cuves for different
δ
Ra values (see details in text).3 4
22 Figure 6:
1 2
3
Figure 6. Discharge curves for the well (a) and the poorly (b) mixed samples. Experimental 4
(solid lines) and calculated data (crosses). Model parameters: (a): εagglomerates/Ω2R02=7 105
5
S/m3and δRa=1.5,(b)εagglomerates/Ω2R02=5 104 S/m3. (Note the change of y scale). 6 7 8 9 10 11
23 Bibliography
1
1. C. Delacourt, L. Laffont, R. Bouchet, C. Wurm, J. B. Leriche, M. Morcrette, J. M. Tarascon and C.
2
Masquelier, J. Electrochem. Soc., 152, A913 (2005).
3
2. P. A. Johns, M. R. Roberts, Y. Wakizaka, J. H. Sanders and J. R. Owen, Electrochem. Commun.,
4
11, 2089 (2009).
5
3. Y.-H. Chen, C.-W. Wang, G. Liu, X.-Y. Song, V. S. Battaglia and A. M. Sastry, J. Electrochem. Soc.,
6
154, A978 (2007).
7
4. M. Gaberscek, R. Dominko and J. Jamnik, Electrochem. Commun., 9, 2778 (2007).
8
5. M. Gaberscek, J. Power Sources, 189, 22 (2009).
9
6. K.-C. Tsaur and R. Pollard, J. Electrochem. Soc., 131, 975 (1984).
10
7. C. Delmas, M. Maccario, L. Croguennec, F. Le Cras and F. Weill, Nat. Mater., 7, 665 (2008).
11
8. Z. Chen and J. R. Dahn, J. Electrochem. Soc., 149, A1184 (2002).
12
9. A. A. Salah, A. Mauger, K. Zaghib, J. B. Goodenough, N. Ravet, M. Gauthier, F. Gendron and C.
13
M. Julien, J. Electrochem. Soc., 153, A1692 (2006).
14
10. J.-C. Badot, É. Ligneel, O. Dubrunfaut, D. Guyomard and B. Lestriez, Adv. Funct. Mater., 19,
15
2749 (2009).
16
11. M. Park, X. Zhang, M. Chung, G. B. Less and A. M. Sastry, J. Power Sources, 195, 7904 (2010).
17
12. M. Doyle, T. F. Fuller and J. Newman, J. Electrochem. Soc., 140, 1526 (1993).
18
13. T. F. Fuller, M. Doyle and J. Newman, J. Electrochem. Soc., 141, 1 (1994).
19
14. A. M. Colclasure and R. J. Kee, Electrochim. Acta, 55, 8960 (2010).
20
15. M. Doyle, J. Newman, A. S. Gozdz, C. N. Schmutz and J.-M. Tarascon, J. Electrochem. Soc., 143,
21
1890 (1996).
22
16. K. E. Thomas-Alyea, ECS Trans., 16, 155 (2008).
23
17. R. Darling and J. Newman, J. Electrochem. Soc., 144, 4201 (1997).
24
18. V. Srinivasan and J. Newman, J. Electrochem. Soc., 151, A1517 (2004).
25
19. D. E. Stephenson, E. M. Hartman, J. N. Harb and D. R. Wheeler, J. Electrochem. Soc., 154
26
(2007).
27
20. M. Safari and C. Delacourt, J. Electrochem. Soc., 158, A63 (2011).
28
21. C.-W. Wang and A. M. Sastry, J. Electrochem. Soc., 154, A1035 (2007).
29
22. Y. H. Chen, C. W. Wang, X. Zhang and A. M. Sastry, J. Power Sources, 195, 2851 (2010).
30
23. S. Dargaville and T. W. Farrell, J. Electrochem. Soc., 157, A830 (2010).
31
24. W. Tiedemann and J. Newman, J. Electrochem. Soc., 122, 1482 (1975).
32
25. J. Newman, J. Electrochem. Soc., 142, 97 (1995).
33
26. L. J. Van Der Pauw, Philips research reports, 13, 1 (1958).
34
27. G. Brunetti, D. Robert, P. Bayle-Guillemaud, J. L. Rouvière, E. F. Rauch, J. F. Martin, J. F. Colin,
35
F. Bertin and C. Cayron, Chem. Mater., 23, 4515 (2011).
36
28. See supplementary material at "doi number".
37
29. I. V. Thorat, T. Joshi, K. Zaghib, J. N. Harb and D. R. Wheeler, J. Electrochem. Soc., 158, A1185
38
(2011).
39
30. I. V. Thorat, D. E. Stephenson, N. A. Zacharias, K. Zaghib, J. N. Harb and D. R. Wheeler, J. Power
40
Sources, 188, 592 (2009).
41 42 43