HAL Id: hal-01873132
https://hal-mines-paristech.archives-ouvertes.fr/hal-01873132
Submitted on 13 Sep 2018
HAL is a multi-disciplinary open access
archive for the deposit and dissemination of
sci-entific research documents, whether they are
pub-lished or not. The documents may come from
teaching and research institutions in France or
abroad, or from public or private research centers.
L’archive ouverte pluridisciplinaire HAL, est
destinée au dépôt et à la diffusion de documents
scientifiques de niveau recherche, publiés ou non,
émanant des établissements d’enseignement et de
recherche français ou étrangers, des laboratoires
publics ou privés.
Extraction of bathymetric features using multiple SAR
images produced by Sentinel-1
Marc Cloarec, Volker Roeber, Thierry Ranchin, Jean Dubranna
To cite this version:
Marc Cloarec, Volker Roeber, Thierry Ranchin, Jean Dubranna. Extraction of bathymetric
fea-tures using multiple SAR images produced by Sentinel-1. Sixth International Conference on
Re-mote Sensing and Geoinformation of the Environment (RSCy2018), Mar 2018, Paphos, Cyprus.
�10.1117/12.2325096�. �hal-01873132�
See discussions, stats, and author profiles for this publication at: https://www.researchgate.net/publication/326855246
Extraction of bathymetric features using multiple SAR images produced by
Sentinel-1
Conference Paper · August 2018 DOI: 10.1117/12.2325096 CITATIONS 0 READS 37 4 authors:
Some of the authors of this publication are also working on these related projects:
Simulators of landscapes and satellite imagesView project
EnerGEOView project Volker Roeber
University of Hawaiʻi at Mānoa 36PUBLICATIONS 406CITATIONS
SEE PROFILE
Thierry Ranchin
MINES ParisTech, PSL Research University 167PUBLICATIONS 3,006CITATIONS SEE PROFILE Jean Dubranna MINES ParisTech 20PUBLICATIONS 96CITATIONS SEE PROFILE Marc Cloarec MINES ParisTech 2PUBLICATIONS 0CITATIONS SEE PROFILE
All content following this page was uploaded by Marc Cloarec on 29 August 2018.
Extraction of bathymetric features using multiple SAR images
produced by Sentinel-1
Marc Cloarec
a, Volker Roeber
b, Thierry Ranchin
a, Jean Dubranna
aa
MINES ParisTech, PSL Research University, O.I.E., 1 Rue Claude Daunesse, CS 10207, 06904
Sophia Antipolis, France;
bUniversity of Hawaii at Mānoa, Physical Oceanography, 2500 Campus
Rd, Honolulu, HI 96822, USA
ABSTRACT
Bathymetry, as a key parameter for evaluation of available resources of renewable marine energy, can be extracted from high resolution Synthetic Aperture Radar images acquired by Sentinel-1. In this paper, the high repetitiveness of these acquisitions is used to improve the accuracy of bathymetric maps extracted from SAR images. A method to extract wavelengths from the free surface elevations was developed, through experiments made using a phase-resolving wave propagation model (Boussinesq Ocean & Surf Zone model). It makes use of several different swell conditions propagating over the same bathymetry. The retrieved bathymetry is established by averaging the different bathymetric maps, obtained from different swell conditions. It allows obtaining a Root Mean Square Error of order 4.5 m for depths 10 m to 50 m.
Twenty SAR images on a particular region have been processed using this methodology. The extraction of wavelengths and peak periods on each image led to a first estimation of the bathymetric data of this specific region compared to an actual bathymetric map with a 20 m spatial resolution. All these maps have been averaged to create a final bathymetric map with a 50 m spatial resolution and a vertical accuracy given by the RMSE over the entire domain of study of about 2.6 m. These preliminary results are encouraging. Future tracks are proposed for improving these results.
Keywords: Remote Sensing, Bathymetry, SAR images, Swell waves
1. INTRODUCTION
The first SAR images acquired on the ocean from space where produced by Seasat in 1978. During the only two months this satellite worked, it produced several images over the ocean and particularly over coastal areas. Those images visually proved that interaction between strong currents and the sea floor induces a modification in the surface roughness1–4. This modification is clearly visible on SAR images and the possibility of bathymetric estimation from these images appeared. The technology of SAR was embedded on multiple satellites since then, and the resolution of images produced has improved considerably. In 2014, Sentinel-1A was launched followed by Sentinel-1B in 2017. Those two satellites operate with a 6 days repetition time. They produce SAR images freely available with a horizontal resolution up to 10 m. The idea of using the swell wave’s propagation to retrieve bathymetric information from the same type of images emerged in the early 20105–7. The linear dispersion relation is used in this methodology. Swell patterns have to respect conditions of small amplitude to respect this linear theory. Those patterns can be imaged by Sentinel-1 within certain conditions of observability. Hence these images can be used to implement this type of method. This relation enables to retrieve depth from two swell factors which are the peak period and the local wavelength of the swell. The aim of this article is to present a new approach based on data analysis of several SAR images to extract a bathymetric map. We will first discuss the condition of observability of swell waves on SAR images produced by Sentinel-1 and the conditions of applicability of the linear dispersion relation. Section 3 will present the approach which was set-up and experiment on free surfaces extracted from phase-resolving wave propagation model. The application on SAR images will then be presented. We will finally discuss the results on a particular case-study and conclude on future developments.
2. OBSERVABILITY BY SENTINEL-1
2.1 Backscattering of the ocean
Sentinel-1 is a C-band synthetic aperture radar functioning day and night over lands and oceans. This radar operates at a center frequency of 5.405 GHz at a height of 693 km. It operates with a repeat cycle of 6 days. 4 imaging modes are available. The Interferometric Wide (IW) swath mode is the main acquisition mode over land and coasts. It acquires data with a 250 km swath at 5 m by 20 m spatial resolution in single look. Typical incidence angles are between 29.1° and 46°. The Stripmap mode images land and sea with a better resolution (5 m x 5 m in single look) yet this acquisition mode is rarer. ESA offers a level-1 processing products named Ground Range Detected (GRD) with high resolution for those two latter imaging modes. GRD products consist of focused SAR data that has been detected, multi-looked and projected to ground range using an Earth ellipsoid model such as WGS84. The ellipsoid projection of the GRD products is corrected using the terrain height specified in the product general annotation.
Ground range coordinates are the slant range coordinates projected onto the ellipsoid of the Earth. Pixel values represent detected magnitude. The resulting product has approximately square resolution pixels and square pixel spacing with reduced speckle at a cost of reduced geometric resolution. The resolution for the IW mode is 20x22 m for range and azimuth in this order with 10x10 m pixel spacing and the SM mode resolution is 23x23 m for the same pixel spacing. The best resolution for a GRD product is a full resolution SM mode with a 4x4 m pixel spacing for a 9x9 m resolution. Winds over the water modify the surface roughness. Short surface waves interact with the radar waves due to their close length dimension. These capillary waves are called Bragg waves when they satisfy the Bragg condition:
( ) (1)
Where is the capillary wavelength and the radar wavelength that illuminates the scene with the incidence angle . These conditions are satisfied within the incidence angles 20° to 60° and the quasi-uniformity of the capillary waves’ distribution makes this condition often satisfied.
2.2 Conditions of observation of swell
The Bragg condition is essential to the backscattered signal. A total lack of wind on the surface leads to a complete reflection of the signal which generates no echo to the antenna in response. The imagery of ocean waves by a SAR cannot be described as linear in general. Three main mechanisms are responsible of the ocean waves’ backscattered signal: the hydrodynamic modulation, the tilt modulation and the velocity bunching. The first two mechanisms are responsible for the return signal of waves with a majority of its movement in the range direction. The hydrodynamic modulation is defined by the difference of the surface roughness on the mounting edge and the descending edge of a wave. The tilt modulation concerns the local incidence angle of the radar signal on the wave much more important when the wave’s front faces the platform than when it is opposed to it. In the azimuthal direction, the imagery mechanism is the velocity bunching which is based on the relative motion between the wave and the SAR signal.
Under specific conditions, SAR imagery mechanism could be considered as linear or quasi-linear over the ocean. Moderate wind speed and low surface currents are needed. Furthermore, swell wavelengths have to be far enough from the cut-off conditions which prevent from imaging waves under a specific dimension. These conditions assure that the swell pattern observed on the SAR image can be processed as the true swell pattern8. Concerning surface currents, there is no conclusion on a minimum velocity from which a current-swell interaction starts to modify the swell pattern9. The impact of the swell amplitude is important, the more it is considered “small amplitude” the less swell-current interaction is likely to appear. Regarding cut-off wavelength, in the range direction, the minimum discernable wavelength directly depends on the instrument range resolution. Azimuthal travelling waves have a cut-off wavelength depending on the slant range R, the platform velocity and the wave height . For a swell propagating with an angle θ between the propagation direction and the platform’s flight direction, the overall cut-off wavelength depends on both the previous discernable wavelength and this angle.
Once these conditions are satisfied, swell wave patterns are imaged and can be studied in order to retrieve bathymetric features.
3. SWELL WAVES
Swell is a movement of the ocean produced by long continuous winds far offshore to form several waves propagating over long distances. This physical phenomenon propagates from its origin region toward the coast until the waves eventually finally break. The propagation of the swell is unaltered at high depths. Presence of strong currents, islands or strong winds can interfere with its propagation. Once the swell reaches shallower waters it begins to “feel” the bottom. It modifies its physical proprieties and is called wave shoaling. Waves entering shallower waters will change in height caused by the wave’s group velocity which changes with water depth. Shoaling waves will also exhibit a reduction in wavelength while the peak period will remains constant. This very last phenomenon is of interest for bathymetry because there is a theoretical relation that links the wavelength of swell waves with peak period and depth at a given geographic area. There are several swell theories depending on the wave’s characteristics regarding a given depth. Studies have shown that swells of small amplitude are well described by the linear theory9. At a certain shallow depth, depending on swell parameters, the curve of the swell doesn’t relate to this theory and the wave will eventually break. These depths are a first limit to the applicability of the method using the dispersion relation. Another limit is the deep water where the bottom have no influence whatsoever with the swell propagation.
Theoretically, the small amplitude swell conditions imply:
{ (3)
where is the significant height, is the wavelength and the depth.
From its origin, the swell propagates unaltered until it reaches the depth . When propagating on high depths ( ), the wavelength is a constant related to the peak period. From the phase speed it is induced that wavelength in a region of high depths is:
(4)
The dispersion relation emerging from the initial conditions in shallow waters ( ) is:
( ) (5)
Where is the swell pulsation with , being swell’s peak period, and is the wavenumber . This linear dispersion relation induce that the knowledge of the peak period and the wavelength gives the depth:
( ) (6) Let us keep in mind that swell is a physical phenomenon which characteristic proprieties such as the peak period are statistically determined. Fourier decomposition consider swell as a sinusoidal superposition of waves which have each their own frequency, wavelength and propagation direction. The most common variables used when studying the swell are extracted from what is called the swell spectrum. Depending on the swell state different spectra are used (Pierson-Moskovitz, TMA, JONSWAP…). Buoys measurements during a certain amount of time are used to form these spectra. The sea state is a geographic representation of this spectrum. It could be infer that the principle of ergodicity can be used in swell studies. Hence, in high depths region, the value of the peak period could be retrieve using the wavelength.
4. METHODOLOGY
The common methods6,10 that have been used so far to extract wavelength from SAR images has improve since the first applications but is most-often based on a classical FFT extraction. Under the right conditions, a SAR image is a single realization of the free surface of ocean. To process this free surface, the Chirp Z-Transform (CZT) has been chosen. It
allows processing several 1D signals out of the 2D free surface in order to make a precise estimation of the wavelength. This can be managed by setting limits of the extracted wavelength in the physical limits of a sea state described theoretically. This method of data analysis expects a prior knowledge of the magnitude of the swell’s wavelength. So far, studies have concentrated their efforts on the application of wavelength retrieval solely on a single SAR image. As satellites such as Sentinel-1 have a high repetitiveness of their image production, the idea was to take advantage of this to improve the bathymetry mapping through the contribution of multiple images.
4.1 Application on a model
As the conditions of observability are fulfilled, the free surface represented in the image can be assimilated to a free surface without alteration in the imaging process. For that reason, the algorithm has been tested on free surfaces simulated by a phase resolving wave propagation model. (Boussinesq Ocean & Surf Zone model)11,12. For a first application of a new method, it is considerably simpler to analyze cases where all parameters can be mastered as those simulated free surfaces. The BOSZ model allows simulating a range of swell conditions on a particular bathymetry. It is possible to import a bathymetric file and then choose the period, the angle of propagation and the specific height of the swell wanted. Each simulation led to a free surface which represents a typical case of swell propagation with precise input condition of swell parameters and bathymetry.
First the wave has to be generated at a particular depth which correspond theoretically to . This depth corresponds to a depth that doesn’t interfere with the swell propagation. Since the wave generation region could be considered as “infinite depths”, averaging wavelength in this area should give a first theoretical estimation of the swell peak period (equation 4).
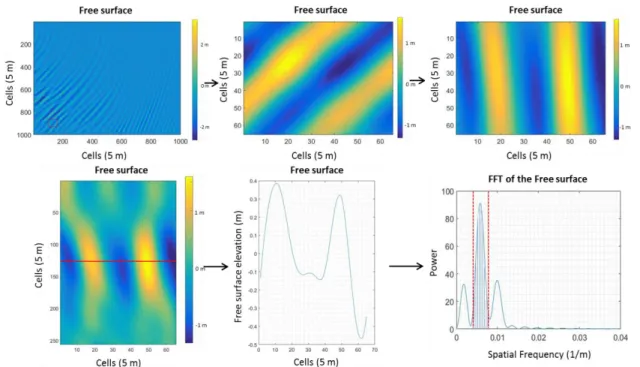
Figure 1. Methodology of the CZT on a free surface extracted from the BOSZ model, the color scale corresponds to the surface elevation.
On the free surface, a starting point is chosen regarding the size of the analysis window. At this starting point, a sub-window is created. The size of this sub-sub-window should be selected so at least more than one complete wavelength is captured. This first sub-window has been selected with a size of 64x64 pixels (dark rectangular on the back of top left images of Figure 1). A Fast Fourier Transform is applied to extract the main direction of the wave. Once this angle is known, the sub-window is rotated and stretched to apply a Chirp Z-Transform. A CZT is a generalization of Discrete Fourier Transform. This transform allows zooming in into the signal with frequency boundaries known. In a 2D signal, each line is processed, searching for the maximum frequency within the boundaries. From a 64x64 to a 128x64 window, it allows to capture a bigger signal. In fact 128 peak frequencies are extracted and then averaged which is how the
wavelength is extracted. Then 5 pixels separate this sub window from the next and the same extraction is applied on the entire domain. This separation allows calculating faster with a bigger diversity of the signal processed.
Once wavelengths are extracted on the entire domain, they are used cell after cell with a peak period value estimated in the “high depth” region. As the wavelength extraction can lead to unrealistic results, some cells will exhibit a low vertical accuracy. The equation used for depth extraction includes an inverse hyperbolic tangent. When reaching the end of its domain interval, this function starts to be unstable. This instability is avoided by limiting the value inside the hyperbolic function which leads to satisfying results. Finally, a bathymetric map is extracted, excepted regions where wavelengths make the result unstable. Each free surface has different region of bad extraction and averaging all these bathymetric maps creates the final product.
5. EXAMPLE OF APPLICATION 5.1 Bathymetry on the Pertuis Charentais
Sentinel-1 images from the Atlantic coast of France are available every 6 days. The Pertuis Charentais is a region of interest because images can capture the coast as well as deep waters where the bottom doesn’t influence the swell propagation. From this deep sea part of the image, it is possible to make an estimation of the value of the swell period from the wavelengths (equation 4). In the coastal area, which is also imaged, the water depth becomes shallower and it becomes possible to extract bathymetric features from the extraction of wavelengths and this previous value of . The average current velocities in this region are low enough to suppose they will not interfere with any small amplitude swell propagation. The French hydrographic service SHOM allows downloading a bathymetric map of this region of interest with a 20 m resolution13. This map will be our reference to estimate the vertical precision of depth extraction.
5.2 Images from Sentinel-1
The Copernicus Open Access Hub via CNES peps server14 provides images to download in a region of interest. It is not possible to have a first look at the sea state in these images so the user should first search those pieces of information in the hydrographic service15.
Images chosen on the Pertuis Charentais are IW products with a GRD level of processing. Each image is on the 103rd relative orbit of the satellite Sentinel-1. Twenty different SAR images were gathered to study this particular region. Swells’ peak periods range from 8 s to 16 s with different angles and propagate toward the Île d’Oléron. Bathymetric data on the Pertuis charentais is available on the SHOM with a 20 m spatial resolution.
On the left part of Figure 2, the GEBCO bathymetric map shows the end of the continental shelf. Far enough from the French coast, depths are down to 200 m which allow a first estimation of the peak period value on the image.
6. RESULTS
The first step of this methodology is the peak period estimation at what is considered infinite depths. The in situ peak periods has to be found at the time and date of each SAR image produced. MARC15 (Modélisation et Analyse pour la Recherché Côtière) uses HOMERE database which provides sea state parameters of the French coasts and give this period with the closest precision.
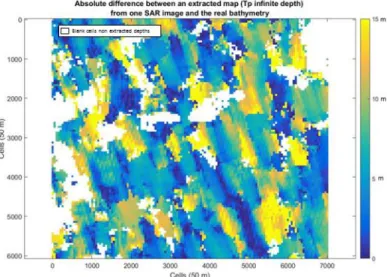
Figure 3. Absolute difference (m) between an extracted bathymetric map with the period estimation at “infinite depth” from only one SAR image and the bathymetric map extracted from the SHOM database.
On each SAR image, an area has been selected that correspond to “high depth”. In this area, the utilization of the CZT allows to extract as many wavelengths as necessary to extract a value of the peak period using (equation 4). It is possible to compare the period values extracted from our analysis and the periods given by a buoy. First studies exhibit good results regarding this estimation. The mean deviation is 1.5 s on the 20 different dates of period extraction. Using those two sets of peak period, a bathymetric map is extracted from each SAR image. From a single image, the vertical resolution given by the RMSE depends on the image and does not exhibit a good accuracy. Each image is processed and gives a bathymetric map. Those maps are finally averaged to give the final product.
The inverse hyperbolic tangent is a function unstable when reaching its boundaries. For this reason the value retrieved inside this function has been limited at 0.85. Whenever the association of and brings this function outside of this imposed boundary, the cell is tagged and not extracted (Examples can be seen in blank cells in Figure 3). This allows reaching a good accuracy of the depth estimation when each extracted bathymetry is averaged. As it can be seen in Figure 3, when applying this methodology on a single image, a lot of regions are not extracted because the values exceed the boundaries in the hyperbolic tangent function. When there is a very few valuable information in an image, it contributes nevertheless to the final map.
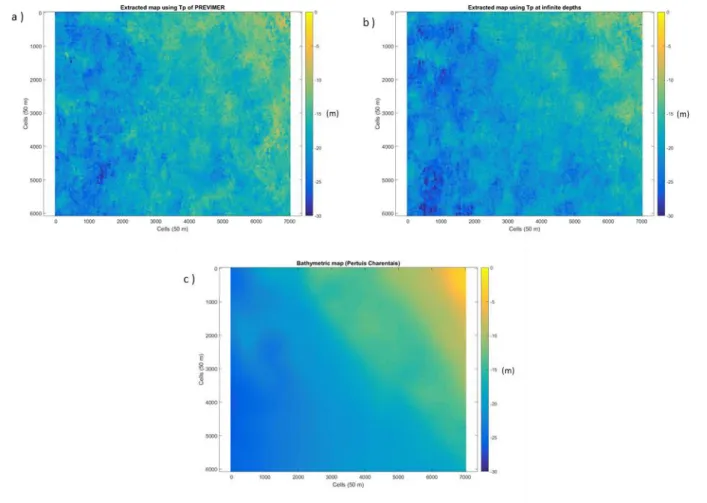
Figure 4. a ) Averaged bathymetric map extracted from 20 maps using the peak period of a buoy located offshore in the Pertuis Charentais. b ) Averaged bathymetric map extracted from 20 maps using the peak period at “infinite depths” c ) Bathymetric map of the Pertuis Charentais
Figure 5. a ) Scatter plot depth map from 20 averaged maps (Tp PREVIMER) b ) Scatter plot depth map from 20 averaged maps (Tp “infinite depth”)
Bathymetric maps extracted from 20 different SAR images are averaged and the final product is presented in Figure 4. Similarly to the application of this method on the BOSZ model, it appears that depths extracted correspond to the
bathymetric map with certain dispersion. On this particular region of study, depths range between 5 m and 25 m. The RMSE of the extracted depths is 2.51 m with values of the peak period extracted each time from a buoy. The estimation of this peak period at “infinite depth” show a mean deviation of 1.51 s on the 20 images studied. The final result of the bathymetric map extracted shows a RMSE of 2.65 m.
This study proves that this method of extraction of a bathymetric map is less dependent of a precise estimation of the peak period value than the same extraction on a single SAR image. The obtained final product has a 50 m spatial resolution for a vertical accuracy given by the RMSE on the entire domain of about 2.6 m. The scatter plot shows that it is unnecessary to use this methodology to close to the coast because depths are over evaluated due to wave shoaling effect. This particular result confirms that the use of the linear dispersion relation theory in shallow waters is not applicable. Nevertheless, a synergy with optical measurements has been studied to cover this coastal area16.
6.1 Limitations of this methodology
Limitations of this methodology of bathymetric extraction come from two distinct sources and affect the spatial and vertical resolution.
On the one hand it uses the linear dispersion relation of the swell which is a theoretical relation. Then, it has to be reminded that swell is a physical process but characteristics used in the method are statistically obtained. The method uses one and only value of the peak period through all the region of study because it is supposed to be unaltered during wave shoaling. The free surface is a superposition of multiple sinusoidal waves going in different directions with their own frequency. This sea state is governed a maximum frequency and direction that imposes the main swell parameters. Therefore, the state of the ocean truly exhibits these main parameters, nevertheless there are regions where the signals create interferences which are destructives and annihilate the possibility of finding any information. Undeniably, the estimation of the bathymetry in those regions will be wrong. As stated, the period of the swell in itself is a statistical parameter. This means that the use of one and only value of this parameter is statistically accurate but not applicable to every geographical sea state at a given time as it could be found in an image. Wavelength throughout the entire domain cannot be determined with an absolute precision due to the chaotic state of the sea. Hence, using the same period for all wavelengths extracted leads to vertical inaccuracies in depth extraction. The linear dispersion relation is bound to inaccuracies in the vertical resolution.
On the other hand, this methodology is developed to be applied on SAR images. The spatial resolution of these images is in itself a limit on the resolution of extracted bathymetric map. In ideal cases like free surfaces from simulations, the error in the wavelength estimation is closely related to the cell size of the mesh. On the contrary, SAR images contain a noise inherent to the imagery process. For instance, swell waves propagating with a wind velocity too high lead to a “white capping”. This phenomenon is responsible for a more important noise in the backscattered signal. Those non-ideal conditions of swell imagery lead to much more inaccuracies in the wavelength estimation. Results are less precise than expected even though swell is visible on the image. In this particular case, a wavelength is extracted on SAR images with a 10 m spatial resolution every 5 pixels. Hence the final product has a maximum spatial resolution of 50 m.
7. CONCLUSION
The application of a new method of extraction of wavelength in order to extract bathymetric feature exhibits promising results. First, the estimation of the peak period value is done in the deep sea region where wavelength is unaltered by the sea bottom and relates to the peak period. When applying this algorithm onto free surfaces extracted from the BOSZ model, results are very promising. It is possible to extract wavelengths in the region of “infinite depths” in order to retrieve the peak period. The difference between the extracted period and the original one does not affect the results significantly. These theoretical results are encouraging, and the application on SAR images doesn’t show a gap between period expected and those extracted. The application of this method then uses an estimation of the peak period value extracted from buoys. Even if this parameter comes with a certain inaccuracy, the use of the model showed that this uncertainty do not affect the final result as all bathymetric map extracted are finally averaged to give a final product. The image processing proposed by this method give a depth estimation every 5 pixel. The final bathymetric map has a spatial resolution of 50 m. The vertical accuracy is given by the RMSE over the entire domain. This method uses several high resolution SAR images in order to extract on bathymetric map with a certain resolution; vertical as well as spatial. It has been seen that the accuracy we can expect from a single IW image with a GRD level of processing is quite low. The contribution of multiple SAR images brings very promising results. The SAR images from Sentinel-1 are not the highest resolution images. Using better resolution images from Sentinel-1 or from another satellite (TerraSAR-X for example)
could lead to results far more interesting by using this method. The perspectives given by this study relies on the extraction of the optimal bathymetric map from multiple SAR images. Given the biased estimations of the wavelengths on those images, it can be thought that the number of SAR images can be chosen to extract an optimal product. Future studies should look into the error of estimations of the wavelength and the peak period throughout the methodology and quantify a sufficient number of SAR images in order to obtain a bathymetric map closest to the original one.
REFERENCES
[1] Alpers, W. and Hennings, I., “A theory of the imaging mechanism of underwater bottom topography by real and synthetic aperture radar,” J. Geophys. Res. Oceans 89(C6), 10529–10546 (1984).
[2] Alpers, W., “Monte Carlo Simulations for Studying the Relationship Between Ocean Wave and Synthetic Aperture Radar Image Spectra,” J. Geophys. Res. Oceans 88(C3), 1745–1759 (1983).
[3] Garello, R., Le Caillec, J.-M., Dupuis, H., Marieu, V., Durand, N., Dreuillet, P. and Titin-Schnaider, C., “Current maps and bathymetry from P-band SAR images: preliminary results,” Geosci. Remote Sens. Symp. 2003 IGARSS 03 Proc. 2003 IEEE Int. 2, 960–962 vol.2 (2003).
[4] Inglada, J. and Garello, R., “On rewriting the imaging mechanism of underwater bottom topography by synthetic aperture radar as a Volterra series expansion,” IEEE J. Ocean. Eng. 27(3), 665–674 (2002).
[5] Lehner, S., Pleskachevsky, A. and Bruck, M., “High-resolution satellite measurements of coastal wind field and sea state,” Int. J. Remote Sens. 33(23), 7337–7360 (2012).
[6] Boccia, V., Renga, A., Moccia, A. and Zoffoli, S., “Tracking of Coastal Swell Fields in SAR Images for Sea Depth Retrieval: Application to ALOS L-Band Data,” IEEE J. Sel. Top. Appl. Earth Obs. Remote Sens. 8(7), 3532–3540 (2015).
[7] Monteiro, F. M., “Advanced Bathymetry Retrieval from Swell Patterns in High-Resolution SAR Images” (2013). [8] Alpers, W. and Bruening, C., “On the relative importance of motion-related contributions to the sar imaging
mechanism of ocean surface waves” (1986).
[9] Brusch, S., Held, P., Lehner, S., Rosenthal, W. and Pleskachevsky, A., “Underwater bottom topography in coastal areas from TerraSAR-X data,” Int. J. Remote Sens. 32(16), 4527–4543 (2011).
[10] Pleskachevsky, A. and Lehner, S., “Estimation of Underwater Topography using Satellite High Resolution Synthetic Aperture Radar Data.,” 4 TerraSAR-X Sci. Team Meet. (2011).
[11] Roeber, V., Cheung, K. F. and Kobayashi, M. H., “Shock-capturing Boussinesq-type model for nearshore wave processes,” Coast. Eng. 57(4), 407–423 (2010).
[12] Roeber, V. and Cheung, K. F., “Boussinesq-type model for energetic breaking waves in fringing reef environments,” Coast. Eng. 70, 1–20 (2012).
[13] “DATA.SHOM.FR.”, <http://data.shom.fr/donnees/catalogue#001=eyJjIjpbLTE4NTk2MS43ODUwNzM3MTA1LDU3ODk1OTMuOTI zMTM0ODM1XSwieiI6MTAsInIiOjAsImwiOlt7InR5cGUiOiJJTlRFUk5BTF9MQVlFUiIsImlkZW50aWZpZXIi OiJNTlRfQ09USUVSX1BFUlRVSVNfSE9NT05JTV8yMG1fUEJNQV8zODU3X1dNVFMiLCJvcGFjaXR5Ijox LCJ2aXNpYmlsaXR5Ijp0cnVlfSx7InR5cGUiOiJJTlRFUk5BTF9MQVlFUiIsImlkZW50aWZpZXIiOiJGRENfR0 VCQ09fUFlSLVBOR18zODU3X1dNVFMiLCJvcGFjaXR5IjoxLCJ2aXNpYmlsaXR5Ijp0cnVlfV19> (15 March 2018 ).
[14] “PEPS - Plateforme d’exploitation des produits Sentinel (CNES).”, <https://peps.cnes.fr/rocket/#/home> (16 March 2018 ).
[15] “MARC - Modélisation et Analyse pour la Recherche Cotière.”, <http://marc.ifremer.fr/> (8 March 2018 ). [16] Pleskachevsky, A., Lehner, S., Heege, T. and Mott, C., “Synergy and fusion of optical and synthetic aperture radar
satellite data for underwater topography estimation in coastal areas,” Ocean Dyn. 61(12), 2099–2120 (2011).
View publication stats View publication stats