Science Arts & Métiers (SAM)
is an open access repository that collects the work of Arts et Métiers Institute of
Technology researchers and makes it freely available over the web where possible.
This is an author-deposited version published in: https://sam.ensam.eu Handle ID: .http://hdl.handle.net/10985/10300
To cite this version :
Sid-Ali AMAMRA, Frédéric COLAS, Xavier GUILLAUD, Samuel NGUEFEU - Laboratory-based test bed of a three terminals DC networks using power hardware in the loop - In: Power
Electronics and Applications (EPE), 2013 15th European Conference on, France, 201309 -Power Electronics and Applications (EPE) - 2013
Any correspondence concerning this service should be sent to the repository Administrator : [email protected]
Special session Real –Time simulation for industrial application
Laboratory-based test bed of a three terminals DC networks
using Power Hardware In the Loop
Topic: 8c Software for measurements and virtual instruments
Abstract – In this paper a three stations MTDC grid is presented, providing a specific application of our work. The experimental platform is intended to combine electrical power components and communication/control equipment with real-time simulation tools. In this way the platform can test grid elements and evaluate different operation scenarios under various conditions.
Index terms –Real-Time simulation, Power Hardware in the Loop, MTDC, VSC, Master-Slave control.
I. INTRODUCTION
As offshore wind farms become more prevalent, more flexible transmission systems will be needed to be developed to ensure an efficient energy transmission. Due to the large capacitive currents associated with long distance ac power transmission, the use of HVDC transmission for integrating offshore wind farms to inland grid system would be more advantageous with respect to other alternative solutions [1][3]. The use of Multi-Terminal HVDC (MTDC) is a potential solution for the integration of the wind-farms and oil/gas platforms into the onshore grid system. An interconnection between the offshore wind-farms and onshore grid can result in reduced operational costs, increased reliability and reduced CO2 emissions. An MTDC network will be then the core of such interconnection. MTDC can also open new power market opportunities and result in better utilization of transmission lines [3][4].
This paper proposes a test bed design of a three stations MTDC grid based on VSC converters. A slave-master control configuration is used to control all VSC converters: a slave-master-terminal dedicated for the dc bus voltage regulation and others are set for constant power control mode. A physical three-node MTDC grid has been realized with two VSCs converter connected to an AC power amplifier for two nodes, and the other node is connected to DC power amplifier controlled by a real time simulator. This MTDC experimental platform allows the modeling of three DC network terminals specifically to address the control, operational issues and faults detection in offshore grid.
Although the real-time simulation of MTDC networks provides useful information, experimental results generated by the hardware platform appear more valuable to the future planning and operation of offshore networks.
II. LABORATORY MTDC STRUCTURE
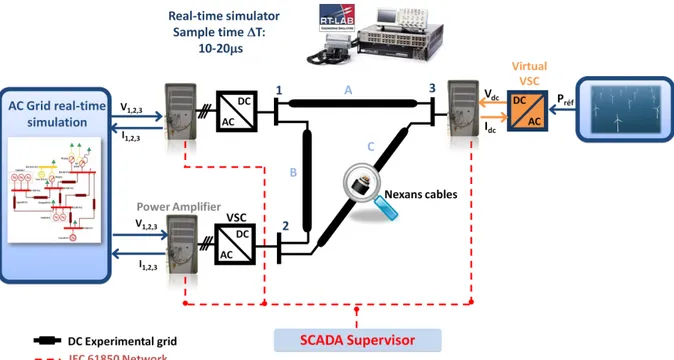
The multi-terminal VSC-HVDC (MTDC) prototype is proposed below; it consists of three VSCs terminals with master-slave control objective. The onshore grid is interconnected to the offshore generation technologies- wind energy. The schematic diagram of the proposed MTDC is shown in fig.1.
Fig. 1 Synoptic Schema of the proposed MTDC Grid
The MTDC grid is a real hardware model based on two VSCs converters connected to the first and second nodes which are linked to two AC power amplifiers. The third node is used to mimic the behavior of an offshore wind farm using a DC power amplifier. All three amplifiers are controlled by a real time simulator which simulates in real-time the wind farm and the AC onshore power system. All system is supervised through a SCADA supervisor. Fig.2 shows a typical topology of the voltage source converter, with the most significant components.
The LCL-AC filter is used in VSC in order to reduce harmonics in the converter, to avoid material damages, DC voltage stresses and harmonics affecting the power amplifier. It is also responsible for the flow of reactive and active power. The DC phase inductor within the converter utilized as a smooth inductor to attenuate considerably current ripple. The main components of these valves units are the switching devices (IGBT) that are required to control the converter. The wind farm is represented as a controllable power amplifier source that injects power into the DC grid depending on the wind, and the AC grid is too represented as a controllable power amplifier source controlled through Real-Time simulator. The table 1 shows the three lines parameters.
Power
Amplifier
LCL Filter
DC
Capacitor
DC Inductor
Converter
Valves
DC
Node
15 20 25 30 35 -5 0 5 Time (s) Cu rr e n t (A) Master AC Current Master AC Current 29 29.1 29.2 29.3 29.4 29.5 29.6 -2 0 2 Time (s) Cu rr e n t (A)
Master AC Current (Zoom)
Master AC Current 15 20 25 30 35 -3 -2 -1 0 1 2 3 Time (s) DC Cu rr e n t (A) DC Lines Currents Master WindFarm Slave 20 25 30 35 242 244 246 248 250 252 Time (s) DC V o lt a g e ( V )
Master-Slave DC Voltage (Zoom)
Master DC Voltage Slave DC Voltage 15 20 25 30 35 -600 -400 0 400 600 800 Time (s) Po w e r (W ) Stations Power Master Power Slave Power WindFarm Power 15 20 25 30 35 200 220 240 260 Time (s) DC V o lt a g e ( V ) Master-Slave DC Voltage Master DC Voltage Slave DC Voltage
Ref Length [km] Linear
Resistor Linear Inductance Linear Capacitance A 0.454 0,68 Ω/km 3,65mH/km 0,24µF/km B 1.135 0,68 Ω/km 3,65mH/km 0,24µF/km C 1.816 0,68 Ω/km 3,65mH/km 0,24µF/km
Table 1 : MTDC lines parameters
The control algorithm of the grid connected converter mainly includes two cascaded loops. The inner loop established in stationary reference frame performs the current control and power quality while the outer loop regulates the DC voltage, active power and reactive power imposed by the operator.
III. REAL-TIME SIMULATION RESULTS
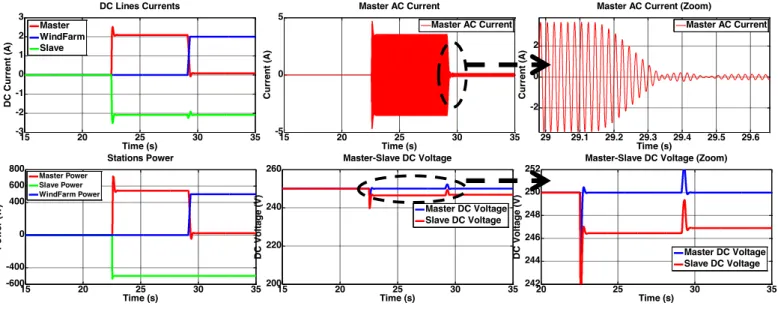
The real-time simulation is a powerful technique for creating large and complex real-time integration labs. An Opal RT-Lab simulator based multi-core processor was used. The ARTEMIS solver from Opal-RT Technologies was utilized in order to optimize SPS power systems’ simulation in discrete mode. It is a fundamental constraint of real-time simulation that the model must use fixed-step integration solvers. ARTEMIS introduces fixed-step solvers improving the performances of simpowers systems and enables real-time simulation of complex power systems. In this test, Each converter can be controlled to operate either on the inland or wind farm side. The operation of the MTDC transmission with control system is tested through Opal RT-Lab simulator; real time simulators are designed to run on a special purpose processor or with parallel computing technology [2][6]. The base DC voltage used is 250v (±125) and the system base power 2.5 KW. Figure-3 shows a simulation result of the grid. Three scenarios was presented in this case, after PLL validation, the DC bus is set to 250v through master station, then active power transfer P is set to 500 w through the slave station and then we inject 500 w through the third station.
0 10 20 30 40 50 200 210 220 230 240 250 260 Time (s) DC V o lt a g e ( V ) Master-Slave DC Voltage Slave DC Voltage Master DC Voltage 15 20 25 30 35 40 45 50 242 244 246 248 250 252 Time (s) DC V o lt a g e ( V )
Master-Slave DC Voltage (Zoom)
Slave DC Voltage Master DC Voltage 0 10 20 30 40 50 -3 -2 -1 0 1 2 3 Time (s) DC Cu rr e n t (A) DC Lines Currents Master WindFarm Slave 0 10 20 30 40 50 -5 2.5 0 2.5 5 Time (s) Cu rr e n t (A) Master AC Current Master AC Current 36.1 36.2 36.3 36.4 36.5 36.6 36.7 36.8 2.5 0 2.5 Time (s) Cu rr e n t (A)
Master AC Current (Zoom)
Master AC Current 0 10 20 30 40 50 -600 -400 -200 0 200 400 600 Time (s) Po w e r (W ) Stations Power Slave Power
Wind Farm Power Master Power
Fig. 3 sketches DC line currents, AC current, active powers and DC voltages of the three-terminals; the real-time simulation is performed by starting on the master-terminal to set the grid DC voltage at 250 V. At t=22.5 s the slave-terminal starts to inject active power of 500 W from the DC grid to AC grid. This power is obviously delivered from master-terminal. At 29 s the wind farm injects active power of 500 W to DC grid. Hence, the master stops providing this required power. The voltage drop due to line effect is observed in slave-station. It is of 2% of the rated DC voltage.
IV. EXPERIMENTAL RESULTS
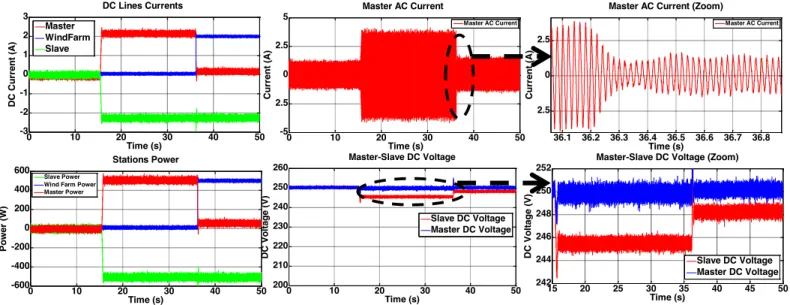
For the validation of the real-time simulated model of the three nodes MTDC grid, a complete platform MTDC grid is built. It contains three stations whose two are connected to two VSCs based on ARCEL-IGBT and DSP TMS320F28335 cards [7]. AC outputs of these VSCs are connected to two AC powers amplifiers. The third station is directly connected to a DC power amplifier and emulates a wind farm network. All the power amplifiers are managed by a RT-Lab simulator, the totality of the platform is supervised with PC-VUE SCADA environment. Both AC onshore power system and offshore wind farm run in real-time simulation to communicate with power amplifiers. The advantage of using a real-time simulator in this scenario lies in the fact that it becomes possible to exchange signals with external devices, such as the powers amplifiers, and use them in real-time, making this a valuable setup for PHIL (power-hardware-in-the-loop) testing [5].
The same scenarios as real-time simulation are used in the test of the experimental platform. Fig. 4 shows the experimental results. The real-time simulation and experimental results show good agreement.
V. CONCLUSION
The test bed described in this paper provides researchers data to facilitate multiple types of power system research. The test bed is described in this paper in detail followed by a description of power system equipment including descriptions of VSC, LCL filter, power amplifier and power lines. The ability of real-time simulator is explored to generate useful research data is discussed and difficulties in power hardware in the loop simulation to coordinate different devices are resolved. In future work the test bed will be extended to five terminals MTDC grid, generation and study the different fault.
VI. ACKNOWLEDGEMENTS
This work was supported financially by the European Twenties Project. www.twenties-project.eu.
REFERENCES
[1]. J. Liang, O. Gomis-Bellmunt, J. Ekanayake, and N. Jenkins. “Control of multi-terminal VSC-HVDC
transmission for offshore wind power”. In Proc. of the 13th European Conf. Power Electronics and
Applications (EPE ’09), pages 1–10, 2009.
[2]. Saran, A.; Palla, S.K.; Srivastava, A.K.; Schulz, N.N.; , "Real time power system simulation using
RTDS and NI PXI" Power Symposium, 2008. NAPS '08. 40th North American, pp.1-6, 28-30 Sept.
2008.
[3]. Zadkhast, S., Fotuhi-Firuzabad, M., Aminifar, F., Billinton, R., Faried, S.O. & Edris, A.-. 2010, "Reliability evaluation of an HVDC transmission system tapped by a VSC station", IEEE Transactions on Power Delivery, vol. 25, no. 3, pp. 1962-1970.
[4]. Liang, J., Jing, T., Gomis-Bellmunt, O., Ekanayake, J. & Jenkins, N. 2011, "Operation and control of
multiterminal HVDC transmission for offshore wind farms", IEEE Transactions on Power Delivery, vol.
26, no. 4, pp. 2596-2604.
[5]. Chenfeng Zhang, Vamsi K Vijapurapu, Anurag K Srivastava, Noel N. Schulz, Jimena Bastos “Hardware-in-the-Loop Simulation of Distance Relay Using RTDS”.
[6]. Opal environnement, www.opal-rt.com. [7]. DSP TMS320f28335 card environnement,
www.ti.com/lit/ds/symlink/tms320f28335.pdf