HAL Id: tel-01145363
https://pastel.archives-ouvertes.fr/tel-01145363
Submitted on 24 Apr 2015
HAL is a multi-disciplinary open access archive for the deposit and dissemination of sci-entific research documents, whether they are pub-lished or not. The documents may come from teaching and research institutions in France or abroad, or from public or private research centers.
L’archive ouverte pluridisciplinaire HAL, est destinée au dépôt et à la diffusion de documents scientifiques de niveau recherche, publiés ou non, émanant des établissements d’enseignement et de recherche français ou étrangers, des laboratoires publics ou privés.
traffic simulation
Mohamed Haitam Laarabi
To cite this version:
Mohamed Haitam Laarabi. Multi-criteria route optimization for dangerous goods transport using fuzzy risk assessment and agent-based traffic simulation. Business administration. Ecole Nationale Supérieure des Mines de Paris, 2014. English. �NNT : 2014ENMP0074�. �tel-01145363�
MINES ParisTech
CRC - Centre de recherche sur les Risques et les Crises Rue Claude Daunesse, BP 207, 06904 Sophia Antipolis, France
École doctorale n° 356 : SMI-Science des Métiers de l’Ingénieur
T
H
È
S
E
Doctorat ParisTech
T H È S E
pour obtenir le grade de docteur préparée dans le cadre d’une cotutelle entre
l’École nationale supérieure des mines de Paris
et L’Université de Gênes
Spécialité “ Science et Génie des Activités à Risques ”
présentée et soutenue publiquement par
Mohamed Haitam LAARABI
15 Décembre 2014
Optimisation multicritère des itinéraires pour transport des
marchandises dangereuses en employant une évaluation en logique
floue du risque et la simulation du trafic à base d’agents.
Directeur de thèse : Emmanuel GARBOLINO Co-directeur de la thèse : Roberto SACILE
Jury
M. Riccardo MINCIARDI, Professeur, DIBRIS, École Polytechnique de l’Université de Gênes Président
M. Jean Marie FLAUS, Professeur, G-SCOP, Institut Polytechnique de Grenoble Rapporteur
Mme Angela DI FEBBRARO, Professeur, DIME, École Polytechnique de l’Université de Gênes Rapporteur
M. Mohamed SALLAK, Professeur Assistant, HEUDIASYC, Université de Technologie de Compiègne Examinateur
M. Massimo PAOLUCCI, Professeur, DIBRIS, École Polytechnique de l’Université de Gênes Examinateur
M. Emmanuel GARBOLINO, Professeur Assistant, CRC, MINES ParisTech Examinateur
M. Roberto SACILE, Professeur Assistant, DIBRIS, École Polytechnique de l’Université de Gênes Examinateur
The transportation of dangerous goods is considered as the most critical and complex activity in the transport industry. Yet, it is one of the most relevant factor in the economy of every country.
Everyday thousands of trucks transporting hundreds of thousands of tons of dangerous goods through specific infrastructures both within and across nations. The infrastructures depend on various mode of transport namely, road, railway, sea, inland waterway, air and pipeline. The shares of these modalities is linked to the economic strategy of each country. However, the term “dangerous” indicates an intrinsic adversity that characterize these products, which can manifest in an accident leading to release of a hazardous substance. In this situation, the consequences can be lethal to human beings and damage the environment and public/private properties. These dangerous goods include materials that are radioactive, flammable, explosive, corrosive, oxidizing, asphyxiating, bio-hazardous, toxic, pathogenic, or allergenic.
The importance of dangerous goods boils down to the significant economic benefits that generates. In fact, one cannot deny the contribution of the transport of all fossil fuel derived product, which represents more than 60% of dangerous goods transported in Europe. Eni, the Italian leading petrochemical company, every day operates a fleet of about 1,500 trucks, which performs numerous trips from loading terminals to filling stations. Distribution of petroleum products is a risky activity, and an accident during the transportation may lead to serious consequences.
Aware of what is at stake, the division Eni R&M historically active in Genoa headquarters is collaborating since 2002 with the Department of Computer Science, Biomedical Engineering, Robotics and Systems Engineering (DIBRIS) at University of Genoa, with the purpose of studying possible improvements regarding safety in transport of dangerous goods, particularly petroleum products. Over years, this collaboration, which has been enriched by the contribution of the Crisis and Risk research Centre (CRC) at Mines ParisTech, has led to the development of different technologies and mainly to an information and decision support system. The major component of this
Platform. These vehicles are equipped with a device capable of transmitting data stream in real-time using a GPRS modem. The data transmitted can be of different nature and contain information about the state of the vehicle and occurred events during the trip. These data are intended to be received by centralized servers then get processed and stored, in order to support various applications within the Transport Integrated Platform.
With this in mind, the studies undertook throughout the thesis are directed towards the development of a proposal to further minimize the risks. In other words, a trade-off based model for route selection taking into consideration economic and safety factors. The goal is prompted by the need to support existing regulations and safety standards, which does not assure a full warranty against accidents involving dangerous goods.
The goal is carried out by considering the existing system as basis for developing an Intelligent Transportation System aggregating multiple software platforms. These platforms should allow planners and decision makers to monitor in real-time their fleet, to assess risk and evaluate all possible routes, to simulate and create different scenarios, and to assist at finding solutions to particular problems.
Throughout this dissertation, I highlight the motivation for such research work, the related problem statements, and the challenges in dangerous goods transport. I introduce the Transport Integrated Platform as the core for the proposed Intelligent Transportation System architecture. For simulation purposes, virtual vehicles are injected into the system. The management of the data collection is improved for more reliability, efficiency and scalability in real-time monitoring of dangerous goods shipment. Finally, I present a systematic explanation of the methodologies for route optimization considering both economic and risk criterions. The risk is assessed based on various factors mainly the frequency of accident leading to hazardous substance release and its consequences. Uncertainty quantification in risk assessment is modelled using fuzzy sets theory.
One of the joys of thesis completion is to look over the journey past and remember all the friends and family who have helped and supported me along this long but fulfilling road.
Foremost, I would like to express my heartfelt respect and gratitude to my thesis supervisors Pr. Roberto Sacile and Dr. Emmanuel Garbolino. Their patient, continual support and constructive criticism in numerous research work have always inspired me in my research skills and personal development. They are not only mentors but also dear friends, who offered their help and assistance during my stay in Italy and France. A special thanks to Pr. Valerie Godfrin for assistance and administration.
I would like to express my deepest regards to Pr. Azedine Boulmakoul, who has been a role model since my engineering studies. I thank him for being inspirational, available, and sharing his valuable experience, and providing help, ideas, and guidance during the three years.
Furthermore, I would like to extend my most sincere thanks to Pr. Massimo Paolucci, Dr. Mohamed Sallak, Pr. Angela Di Febbraro, and Pr. Jean Marie Flaus, for been kindly agreeing to be inspectors and referees for this thesis.
My personal sincere thank goes to Rafiullah, Waqar and Nicola together with all my colleagues and friends of the doctoral schools, both at the University of Genoa and Mines ParisTech. I am also fortunate by being part of the DELAB, for the pleasing work environment which I really enjoyed. My thanks goes as well to my swimming coach of Piscine di Albaro.
I would not have contemplated this road if not for my mother, Horria, who instilled within me a love of creative pursuits of knowledge and science, all of which finds a place in this thesis. I am, as ever, especially indebted to her for the love, prays and ubiquitous support throughout my studies. To my parents, grandmother, siblings and nephews, thank you for your continual support.
Preface ... 3
Acknowledgements ... 5
Table of Contents ... 6
List of Figures ... 9
List of Acronyms ... 12
Chapter 1. Introduction ... 14
I. Research motivation ... 14I.1. Overview on Dangerous Goods Transport (DGT) ...14
I.2. Who are the potential DGT stakeholders? ...16
II. Problem statements ... 17
II.1. Need for ubiquitous real-time monitoring system ...18
II.2. Need for a powerful data collection system ...19
II.3. Need for a route optimization algorithm ...20
II.4. Need for defining factors of each criterion ...21
II.5. Need for traffic simulation system ...23
II.6. Need for Intelligent Transportation System ...24
III. Thesis context ... 24
III.1. Previous works: the existing system ...25
III.2. Thesis objectives ...27
IV. Thesis outline ... 28
Chapter 2. Dangerous Goods Transport ... 31
I. Chapter introduction ... 31
II. Road transport of dangerous goods ... 35
II.1. Dangerous Goods (DG), what are they? ...35
II.2. DG in transport ...35
II.3. DG transportation shares...38
II.4. DG transportation and road traffic accidents ...39
II.5. DG transportation and safety ...41
III. Risk management in DGT ... 42
III.1. DGT management ...42
III.2. What is risk? ...43
III.3. What is Risk Management? ...44
III.4. Risk Assessment ...46
III.5. Uncertainties in risk assessment ...52
IV. Chapter summary ... 58
Chapter 3. An Intelligent Transportation System ... 60
I. Chapter introduction ... 60
I.1. Overview: ITS ...60
I.2. Overview: Existing system ...61
II.3. Driving Simulation ...69
III. Agent-based traffic simulation ... 73
III.1. Multi-Agent Systems (MAS) ...73
III.2. Traffic Simulation ...78
III.3. DGT modelling with MATSim ...81
IV. Chapter summary ... 87
Chapter 4. Data Collection Middleware ... 89
I. Chapter introduction ... 89
II. Transmission system of the TIP ... 90
II.1. The on-board unit ...90
II.2. The transmission database server (T-DB) ...90
II.3. The GIS application ...91
II.4. Data collection using a web service ...91
III. Data collection middleware architecture ... 96
III.1. TCP Socket-based architecture ...98
III.2. Buffering strategy ... 100
III.3. Database storage strategy ... 103
IV. Test and results analysis ... 104
V. Chapter summary ... 107
Chapter 5. Fuzzy Risk Assessment & Fuzzy Ranking ... 110
I. Chapter introduction ... 110
II. Risk Assessment ... 111
II.1. Risk definition ... 111
II.2. Risk factors ... 114
II.3. Risk formulation ... 117
III. Fuzzy theory for the management of uncertainty ... 120
III.1. Fuzzy modelling ... 120
III.2. Fuzzification ... 122
IV. Ranking of fuzzy quantities ... 128
IV.1. Methodology ... 130
IV.2. The proposed approach for TFN ranking ... 133
IV.3. Analysis and properties of the proposed ranking ... 135
IV.4. Properties of the TFN ranking operators ... 139
V. Chapter summary ... 143
Chapter 6. Multicriteria Route Optimization ... 145
I. Chapter introduction ... 145
II. Fuzzy time-dependent travel time ... 147
II.1. Time-dependent network ... 147
III. Multicriteria optimization ... 159
III.1. Vector weight ... 159
III.2. Multiobjective A-star algorithm ... 160
IV. Implementation with Boost Graph Library ... 162
IV.1. The adjacency list ... 163
IV.2. The multilevel graph (Network of Networks)... 163
IV.3. The vector weighted graph... 164
V. Chapter summary ... 164
Fig. 1-1 Evolution of EU-27 transport of dangerous goods (based on tkm,
2004=100) _______________________________________________________ 15 Fig. 1-2 Weighted High-Impact Causalities by Transportation Mode as Percent of Total, 2005-2009. PHMSA’s Hazmat Intelligence Portal (HIP) in Sept 2010 with modifications in Feb 2011. ___________________________________________ 16 Fig. 1-3 GPS fleet tracking system _____________________________________ 19 Fig. 1-4 Vulgarization of conflict between economic and safety factors while
selecting a route from a loading terminal to the various distribution points. _____ 20 Fig. 1-5 The institution contributing in the PhD Thesis along with the respective tutors ___________________________________________________________ 25 Fig. 1-6 The graphical user interface of the Tranport Integrated Platform: the dashboard on the left, web mapping on the rigth showing a monitored truck over italian territories. __________________________________________________ 26 Fig. 1-7 an overview of an Intelligent Transportation System for Real-time
monitoring, simulation, route optimization taking into consideration travel time, population, transported HazMat _______________________________________ 28 Fig. 2-1 Quantity (in Billion tkm) of internal freight traffic in 2009 by mode of transport, in the world, Eurostat, ITF ___________________________________ 31 Fig. 2-2. Modal split of the internal freight traffic throughout the world, Eurostat, ITF _____________________________________________________________ 32 Fig. 2-3. Modal split in foreign trade expressed in terms of value and weight, in EU27, Eurostat ____________________________________________________ 33 Fig. 2-4. Modal split of Domestic and international freight traffic in Western Europe, Eurostat 2012 _____________________________________________________ 34 Fig. 2-5. Evolution of the modal split of freight traffic along 1995-2010 in UE27, Eurostat 2012 _____________________________________________________ 35 Fig. 2-6 Evolution of the total traffic of goods and dangerous goods (Billion tkm) in Italy 1990-2010 ___________________________________________________ 39 Fig. 2-7 Deaths and injuries in accidents in Italy, Trend 2001-2011, ISTAT-ACI _ 40 Fig. 2-8 the DGT management classification by time horizon and level of details _ 43 Fig. 2-9 risk management plan for emergency response to disasters (Bernardinis, 2007) ___________________________________________________________ 44 Fig. 2-10 process of the DGT accident risk management (Tomasoni, 2010) _____ 45 Fig. 2-11 (Chevallier and Caron, 2002) approach that uses GIS to fill the gap between science and regulations ______________________________________ 46 Fig. 2-12 Likelihood-Consequence risk matrix (Muhlbauer, 1996) _____________ 48 Fig. 2-13 A Typology of Risk Assessment (Fairman and Mead, 1996) __________ 49 Fig. 2-14 Individual risk contours ______________________________________ 51 Fig. 2-15 factors in risk assessment for route optimization by (Ernesto, 2004) __ 53 Fig. 2-16 Classification of Verity or total uncertainty (Arunraj et al., 2013). _____ 56 Fig. 3-1 the designed Intelligent Transportation System where all main component are drawn ________________________________________________________ 61 Fig. 3-2 The On-board Unit installed in heavy goods vehicles (trucks), for
telemetry/events data collection ______________________________________ 64 Fig. 3-3. Synoptic panel, a replica of the on-board unit installed in the trucks ___ 66 Fig. 3-4. Architecture component of the Transport Integrated Platform (TIP) ____ 67 Fig. 3-5. The architecture of a driving simulator environment for full driving
actions __________________________________________________________ 74 Fig. 3-8. Layers in an agent's message in communication protocols (Chopra, 2009) ________________________________________________________________ 76 Fig. 3-9. Multi-Agent System Commitment-Based Architecture (Chopra, 2009) __ 77 Fig. 3-10. Procedural Reasoning System “PRS” (Georgeff, 1986) _____________ 78 Fig. 3-11 the three levels of traffic simulation approaches __________________ 79 Fig. 3-12. A vehicle/driver agent architecture ____________________________ 81 Fig. 3-13 Interface of simulation of MATSim by Senozon ____________________ 82 Fig. 3-14 the two dimensions of simulation in MATSim _____________________ 83 Fig. 3-15 the event driven simulation in MATSim __________________________ 83 Fig. 3-16 Agent & Plan definition in MATSim _____________________________ 84 Fig. 3-17 The DGT Agent modelling based on MATSim person agent where (Person) Agent is mapped with (Driver, Truck, HazMat) agent ______________________ 84 Fig. 3-18 A typical plan files as used in MATSim. First file is an original MATSim plan file, however the second one is a new structure designed for interfacing with
MATSim. _________________________________________________________ 85 Fig. 3-19 the modular architecture of the system, which highlights the main
components and their interaction ______________________________________ 86 Fig. 4-1 (left) the graphical interface of the GIS application (one of TIP component) displaying information about a monitored Eni truck in real-time, (right) the
evaluation of dangerous goods flow in Northwest Italy on the TIP. ____________ 91 Fig. 4-2 A Web Service Interface operating between the centralized servers cluster for receiving and processing the data, and the on-board units that transmit ____ 92 Fig. 4-3 The workflow of the TIP data collection process for real-time monitoring of the fleet, where data are received, dispatched, processed, then checked and finally stored. __________________________________________________________ 95 Fig. 4-4 An Overview on the Monitoring System Architecture that highlights the critical role of the Data Collection System in the heart of the monitoring _______ 97 Fig. 4-5 The UML Sequence diagram summarizing the whole process of the real-time data collection activity. __________________________________________ 98 Fig. 4-6 TCP-Socket based data transmission operating between the server and the on-board units, using BOOST for data processing and storage. _______________ 99 Fig. 4-7 The UML Class diagram detailing the architecture of the TCP-Socket based data collection. ___________________________________________________ 100 Fig. 4-8 Multithread/ task list. _______________________________________ 101 Fig. 4-9 Multithread/ Multi task list. ___________________________________ 101 Fig. 4-10 Multi buffering. ___________________________________________ 102 Fig. 4-11 Extensible buffering. _______________________________________ 103 Fig. 4-12 Web service and database performance tests. ___________________ 105 Fig. 4-13 Process and memory status by windows performance monitor. ______ 106 Fig. 4-14 Scalability test. ___________________________________________ 107 Fig. 4-15 Performance test with GPRS connection. _______________________ 107 Fig. 5-1 Area targeted and its distance with HazMat carrier position __________ 117 Fig. 5-2 (Tomasoni, 2010)’s summary diagram of the definition of risk in the
transport of dangerous goods. _______________________________________ 119 Fig. 5-3 Mathematical formulation of the risk assessment __________________ 120 Fig. 5-4 Layout of the fuzzy risk analysis process ________________________ 121 Fig. 5-5 Overview of the summary diagram of the proposed fuzzy risk computation _______________________________________________________________ 121
Fig. 5-9 Fuzzy values of the correlated factor of the road curve _____________ 125 Fig. 5-10 Fuzzy correlated factor of the road slope _______________________ 125 Fig. 5-11 Fuzzy correlated factor of the traffic condition ___________________ 126 Fig. 5-12 Fuzzy correlated factor of the weather condition _________________ 126 Fig. 5-13 Fuzzy correlated factor of the truck configuration ________________ 127 Fig. 5-14 Fuzzification of the estimated population (EP) ___________________ 128 Fig. 5-15 Fuzzification of the estimated impact radius 𝜆 ___________________ 128 Fig. 5-16. All possible topological situations for two TFNs __________________ 135 Fig. 5-17. Topological Representation of the Situation 1 & 2: Disjoint & Weak cases _______________________________________________________________ 136 Fig. 5-18. Topological Representation of the Situation 3: overlapping cases ____ 137 Fig. 5-19. Topological Representation of the Situation 4: inclusion cases ______ 138 Fig. 5-20. The degree of inclusion in 𝑴𝑰𝑵(𝑨, 𝑩) __________________________ 139 Fig. 5-21. 4 controversial examples: (a) shows 3 positives TFNs; (b) shows 3 negatives TFNs; (d) shows same symmetrical spread TFNs; (d) shows same
support TFNs ____________________________________________________ 142 Fig. 6-1. Road segment weight as a function of the departure time at the starting vertex A to destination B ___________________________________________ 148 Fig. 6-2 an (𝒔, 𝒅) − 𝒑𝒂𝒕𝒉 from source 𝒔 to destination 𝒅 ____________________ 149 Fig. 6-3 Graph subdivision by Network Voronoi using Fuzzy Dijkstra algorithm _ 153 Fig. 6-4. The node-to-border, border-to-border, and border-to-node lower bound travel time labels from source node 𝒔 to destination node 𝒅 ________________ 154 Fig. 6-5 Illustration of the two cost functions of the A-star algorithm: 𝒈(𝒗) and 𝒉(𝒗) _______________________________________________________________ 157 Fig. 6-6. Bidirectional Time-Dependent Fastest Path problem (BTFP) _________ 157 Fig. 6-7. Illustration of the algorithm of Bidirectional and Multi-Objective route search __________________________________________________________ 162 Fig. 6-8 A graph can be modelled with an adjacency list structure ___________ 163 Fig. 6-9 A multilevel graph using sub_graph structure in BGL _______________ 163 Fig. 6-10 A weighted multi graph using an adjacency list structure with multicriteria weight __________________________________________________________ 164
ADR: European Agreement concerning the International Carriage of Dangerous
Goods by Road _______________________________________________ 15, 36
CPU: Central Processing Unit __________________________________ 15, 99, 134 DG: Dangerous Goods ________ 15, 16, 18, 19, 21, 22, 23, 24, 26, 35, 56, 57, 85 DGT: Dangerous Goods Transportation __ 15, 16, 19, 21, 22, 27, 57, 62, 64, 84, 90 DLL: Dynamic-Link Library _______________________________________ 15, 97 DSS: Decision Support Systems ______________________________________ 15 GIS: Geographic Information System _________________________15, 19, 26, 91 GPRS: General Packet Radio Service __ 15, 26, 60, 84, 85, 86, 88, 90, 92, 100, 133 GPS: Global Positioning System ________________ 15, 19, 26, 60, 84, 85, 90, 100 HTTP: HyperText Transfer Protocol ______________________________ 15, 87, 90 IIS: Internet Information Services _________________________________ 15, 86 ITS: Intelligent Transportation System ______________________________ 15, 24 LNA: Local or National Authority ___________________________________ 15, 18 LPG: Liquefied Petroleum Gas _____________________________________ 15, 16 M-DB: Main Database Server __________________________________ 15, 85, 91 OTL: Oracle Template Library _____________________________________ 15, 97 RPC: Remote Procedure Call ___________________________________ 15, 87, 97 SOAP: Simple Object Access Protocol _____________________ 15, 87, 88, 90, 91 SQL: Structured Query Language ________________________ 15, 94, 96, 97, 98 TCP: Transmission Control Protocol ___________________ 15, 91, 92, 98, 99, 100 T-DB: Transmission Database Server _________________________15, 85, 89, 91 UDP: User Datagram Protocol ____________________________________ 15, 100 UML: Unified Modeling Language ___________________________________ 15, 91
I have no special talent. I
am only passionately
Chapter 1. Introduction
This chapter starts by giving the motivation for undertaking research on this critical industrial activity that is the transport of dangerous goods. Then highlights the most important problem statements judged worth to discuss and of interest to any stakeholders. The chapter also addresses the thesis context and objectives to be achieved. Finally, the structure of the dissertation is introduced.
I. Research motivation
I.1. Overview on Dangerous Goods Transport (DGT)
Nowadays, dangerous goods are used in a wide range of industrial and economic activities. Products such as the Liquefied Petroleum Gas (LPG) for example, are used wherever power, heat or light are required by end-users and society. As all products derived from fossil fuel sources, it generates important economic benefits at all levels: energy, transportation, heating and refrigeration. However, the term “dangerous” goods is a label indicating the intrinsic adverse characteristics of these products, which can manifest in certain conditions such accident events. If this happens, the consequences can be lethal to human beings and damage the environment. In this dissertation, dangerous goods are a pack of hazardous materials considered as goods within a supply chain. These materials includes radioactive, flammable, explosive, corrosive, oxidizing, asphyxiating, bio-hazardous, toxic, pathogenic, or allergenic materials (Tomasoni, 2010). All liquids, gasses and solids goods that might harm humans, other living organisms, environment and public/private properties.
From this point onwards, I use the common acronyms “DG” for Dangerous Goods and “HazMat” for Hazardous Materials. “DGT” is also a common term referring to Dangerous Goods Transport. “Catastrophic accident” is a term that implies every accident involving HazMat or leading to HazMat release.
15
Regarding the commercial road traffic of DGT, increasingly over years, continues to rise throughout the world whatsoever at national or international level particularly in Europe. Despite the decline along 2008 and 2009 attributed to the financial crisis, in which DGT experienced a regression of 4% in total, where flammable liquids dropped by 12%. Then, as portrayed on the Fig. 1-1, a significant regrowth affected goods shipment and DGT by 2010. In addition, the dangerous nature, the implemented security measures and confidentiality regarding DGs management, make DGT one of the most complex and sensitive activity that requires special attention from stakeholders, decision makers and researchers within governmental and non-governmental safety organization. This activity may have catastrophic consequences when certain events take place in specific conditions, such explosions in a high populated area or toxic chemicals release into groundwater, leading to casualties directly or indirectly through environmental degradation.
Fig. 1-1 Evolution of EU-27 transport of dangerous goods (based on tkm, 2004=100) In this work, we will focus mainly on transport of DG by road. Since it seems to be the major source of catastrophic accidents among all transportation mode, as shown on Fig. 1-2. Indeed, 64.9% of catastrophic accidents are caused by road traffic, whereas railway traffic represents only
16
26.8%, according to the U.S. Department of Transportation Pipeline and Hazardous Materials Safety Administration. However, the work can be easily extended to other modalities.
When a catastrophic accident involving dangerous goods, the consequences cannot be often contained and lowered (Tomasoni, 2010). For this reason, stakeholders have no choice but to seek risk management strategies for DGT as preventive measures to mitigate either the probability of occurrence or magnitude of the consequences, while minimizing the costs.
I.2. Who are the potential DGT stakeholders?
The DGT stakeholders are the individuals or groups that are likely to affect or be affected by the transport of dangerous goods. The question then arises as to who are the potential stakeholders in DGT. In literature, works such (Glickman, 1992) confirm that some of the stakeholders are more interested by the economic factors; whilst others are more concerned by safety and well-being of the population and environment. Among all the possible stakeholders, four potential stakeholders can be identified: the transport companies, the industrial companies, the national/local authorities, and non-profit organization acting on behalf of the population.
Fig. 1-2 Weighted High-Impact Causalities by Transportation Mode as Percent of Total, 2005-2009. PHMSA’s Hazmat Intelligence Portal (HIP) in Sept 2010 with modifications in Feb 2011.
The transport companies (private or public) in charge of DGT are mostly interested in maximizing their profits. One of the steps that help achieve this
17
objective is mitigating operational costs. Each unit of length travelled by a vehicles is estimated by a cost, price, fuel consumption or rather travel time. For instance, if the travel time can be minimized then, consequently, the operational cost can be minimized, therefore maximizing profit.
The industrial companies (private or public) that have HazMat production plants, HazMat storage facilities, manage distribution or use these hazardous materials. In other words, every company whose activity requires HazMat. These companies influence the whole DG supply chain, and mainly the transport companies who are concerned by the transport process.
Depending on the case study area, the term Local or National Authority (LNA) refers to either local or central government. Two main issues dealt with by the LNA. First, the proper functioning of the transport network at all time. Second, maintaining a safe urban/rural environment. In case of an accident occurs involving DG, the transport network system can be significantly disrupted and the surrounding environment can suffer from heavy damages. The negative effects on the environment in case a catastrophic event extend to transport network itself, buildings, hospitals, parks, schools, etc. The damage cost can be expressed in economic terms, as well as in human lives. Non-profit organization concerned by population in general and especially the ones living in or nearby the area where the DG are being transported. This becomes even more relevant when the transport of DG takes place in urban areas where there is high population density. People are always interested in their safety, and will not agree about being exposed to a hazard in their work place or residential area. In risk management, the population is the main element at risk to be considered, and often risk is expressed in term of human lives. Non-profit organization are also concerned by the impact of DGT on the environment.
II. Problem statements
In DGT, dangerous goods have to be transported from an origin to one or more destinations. Generally, the origin are facilities producing, storing, or distributing DG. After production, goods are transported to other facilities
18
where they are required. Due to the dangerous nature of these goods, safety measures have to be considered along the entire supply chains, from production to distribution. Therefore, regulations and safety standards are implemented to mitigate risk of any incident related to DG, and to ensure the smooth running of all operations. The main goals of these standards is to minimize the risk of managing dangerous goods. However, the implementation of such regulations does not assure a full warranty against accidents involving DG, since these regulations cannot take into consideration all possible scenarios and every environments. A time-dependent management is then required to improve the desired safety measures along the DG supply chains. What I mean by time-dependent management, is the continuous monitoring where decisions are taken locally within a time horizon of few seconds, minutes or hours. This means, a decision maker needs to be aware of the state of the dangerous goods at all times and in all places where are located. They also need to be assisted at making decision, and in addition, test solution and models of problem they encounter in the management of DGT.
I highlight hereinafter the most important needs I judged worth to discuss and of interest to any stakeholder or decision-maker.
II.1. Need for ubiquitous real-time monitoring system
Only two decades ago, it was not possible to have such ubiquitous technologies, since the GPS1 was not fully operational until 1995. Today, GPS
network has around 30 active satellites and used for multiple GIS2
applications, such route navigation systems as the global leader product
TomTom. Yet for mapping, the study of earthquakes, floods, climate,
population behaviour during catastrophic accidents, epidemics or disease outbreaks. There are even GPS-based games, such Geocaching, an outdoor game for treasure hunting.
1 Global Positioning System (GPS) is a network of satellite navigation system that
provides in any condition the time and location
2Geographical Information System (GIS) is a software for capturing, storing,
19
Having said that, the emerging information and communication technologies including the GPS and computer network, allowed researchers and engineer to design and develop ubiquitous systems offering a platform for real-time monitoring. It is a software and hardware challenges that is easier to take up than to achieve it. That will not stop the urge of stakeholders to be aware of the whereabouts and status of the vehicles. Many sophisticated devices can be used such speed and engine activity sensors, besides to the GPS modem. Thus stakeholders can control in real-time their interests, which is, in our context, the smooth flow of the DG supply chain.
Fig. 1-3 GPS fleet tracking system
II.2. Need for a powerful data collection system
One of the challenges in real-time monitoring is the system in charge of data transmission, reception, processing and storage called the data collection system. It is a highly technical issue where the objective is to design a system capable of managing a large amount of data transmitted simultaneously and continuously. In other words, the system should be: Reliable: Ability to ensure transmission and reception of uncorrupted
data, with error checking and acknowledgement system. Very low probability of corrupted data;
Efficient: Ability to handle fast enough the received data. Very low probability of lost/late data;
Scalable: Ability to handle a growing amount of data received. Very low probability of system crash when overloaded.
20
II.3. Need for a route optimization algorithm
II.3.1. Multicriteria optimization
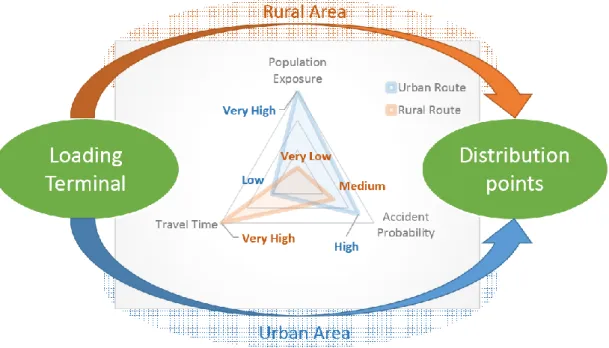
Over time, real-time monitoring produces a tremendous quantity of valuable data that can be analysed and studied to understand specific phenomenon or scenarios. It can be also used for planning and scheduling of fleet of vehicles that are supposed to deliver goods from a source “loading terminal” to one or multiple destinations “distribution points”. Decision makers can then figure out the best path for routing the vehicles carrying DG. The commonly used model is one that is concerned by saving millions of gallons of fuel each year, where routing is based on the economic factors. However, it is not enough when dealing with dangerous goods. Better path selection models will be those where safety factors are considered as well. That is to say, what factors matters in Decision Support Systems, depends on the stakeholders interests involved in the DGT.
Fig. 1-4 Vulgarization of conflict between economic and safety factors while selecting a route from a loading terminal to the various distribution points.
Generally, safety interests oppose the economic ones, which complicate the decision-making process, as well portrayed by Fig. 1-4. Consider for instance the differences in risk perception and economic interest that may
21
exist in different countries. There will be a greater awareness of the dangers of DG in some countries as compared to others. This is reflected on, for instance, who is concerned by natural disasters and DGT management. Countries lacking of interest and awareness, will consider natural disaster affect more the private and public sector organization than those dealing with dangerous goods (Glickman, 1992). DGT management are usually left for stakeholders involved directly in the dangerous goods management. Consequently, the same stakeholders will often select the routes based only on economic factors, which is saving fuel and logistics. The challenge is to design an optimization model that come out with solutions, which consider safety factors, while keeping their attractiveness from economic point of view.
II.3.2. Time-dependent optimization
Usually, in route planning only static information are taken into consideration, such historical data on population density, road infrastructure. Though a factor such the “travel time” of a road segment depends on the time instant at which the vehicle enter the road segment. This is obviously due to the dynamic nature of the road network environment, which is impacted by e.g. the traffic density or weather condition. Similarly, most risk factors depends on the time and the lieu. This dependence requires a full knowledge on real-time traffic density, population density, nearby HazMat, transported HazMat, weather condition (Tomasoni et al., 2010). The algorithm for path selection has to be applied on a time-dependent network, where each road segment is linked with a time-dependent cost and risk functions.
II.4. Need for defining factors of each criterion
II.4.1. The economic criterion
The problem that arises when transporting DG is how to select a route where economic and risk issues are considered. On one hand, the DGT has to be economically feasible for the stakeholders directly involved in this activity. On the other hand, the DGT must pursue the safe transport by minimizing the risk throughout the whole transportation process. Defining the
22
economical factor is a straightforward task. However, defining what determines risk is a far more complex reality. The economic feasibility of a transport activity can be seen in terms of the operational costs. The more the operational costs involved in the transport process are kept under ascertain threshold, the more economically feasible the process will be. For simplicity reasons, the operational costs of DG shipment are usually considered to be proportional to transport duration, which results at focusing only on being fast at delivering goods. In other words, the economic factors is usually simplified to be equivalent to travel time. For decision makers, the logic is simple, by reducing the travel duration costs will inevitably be reduced.
II.4.2. The risk criterion
Regarding risk factors, the term “risk” is often defined as the probability of a damaging event to occur multiplied by its consequences (Fabiano, 2005). Risk is the interaction of hazards and vulnerability factors of one or more elements at risk. The interaction of these factors can be determined and/or influenced by other external factors e.g. environment, society, politics, etc. There is a considerable amount of research on route modelling for the transport of DG where factors such as accident probability, explosion probability, and population vulnerability are considered when it comes to risk assessment. Some of these research studies are the ones carried by (Karkazis and Boffey, 1995), (Bonvicini et al., 1998), (Frank et al., 2000), (Leonelli et al., 2000), and (Zografos and Androutsopoulos, 2004) just to name a few (a discussion related to this references is presented in the chapter 2). However, the influence of other natural or socio-natural hazards, affecting elements at risk other than population, has not been considered, or at least I have not come across research studies which have considered these issues.
II.4.3. Uncertainty quantification of risk factors
Another issue concerns risk analysis that is the methodology for uncertainty quantification. It is generally acknowledged that there are substantial uncertainties present in any analysis of risk. Many techniques used for uncertainty analyses exist, but most of them are inappropriate for
23
practical use in the complete risk assessment process. Such the traditional probabilistic approach using a Monte Carlo simulation due to its non-statistical nature (Quelch and Cameron, 1994). The concept of fuzzy sets as a means for quantifying uncertainty is introduced in this dissertation. In fact, Quelch proves that the amount of computation required by the latter is substantially reduced compared to the traditional probabilistic approach.
Using fuzzy set theories for uncertainty quantification of risk related to DGT represents an important and original scientific contribution. Risk factors should be defined then undertake a Fuzzification methodology to capture the best quantification possible of the uncertainty surrounding each factors. This is usual done by considering experts’ opinion or statistical/historical data.
II.5. Need for traffic simulation system
Models and algorithms for scheduling, route optimization and supply chain management cannot be proven to be reliable and efficient till they are tested in different case scenarios. Often it is hard to test them in real world due to the complexity, costs, confidentiality, dangerous nature of the transported products, and sometimes the unavailability of the data regarding specific scenarios in spite of the data collected from the real-time monitoring system. That is why visual traffic simulation is needed to mimic the real world with a full power of customization. Applications on serious games, financial market, and engineering are evidence of success of the visual simulation system.
The challenge consists on how to design a system that represents real-world traffic systems with an appropriate degree of complexity and dynamics. Several researchers have already suggested solutions since the 50s. These solutions have been classified in three levels: microscopic, mesoscopic and macroscopic simulation. The microscopic approach using an agent-based model is the most appropriate to simulate individual vehicles and by the way mimic the real ones. Agents are autonomous, goal-driven and interacting entities. By injecting those agents into the real-time monitoring system, we will have a larger group of vehicles behaving identically, yet some of them are virtual and fully customizable.
24
II.6. Need for Intelligent Transportation System
To be able to select economic and safe routes for the transport of DG it is necessary to use software platforms that allow planners and decision maker: to monitor in real-time their fleet, to assess risk and evaluate all possible routes, to simulate and create different scenarios, and to assist in finding a solution to a particular problem. The aggregation of these software platforms make up what is called by the Intelligent Transportation System (ITS3).
Stakeholders and decision-makers are, no doubt, very interested by having at hand a platform aggregating all information and tools for decision support. The ITS was initially motivated in US by the increasing interest on homeland security for roadways monitoring. In highly populated cities with complex transport network, ITS was an excellent solution for managing multimodal systems from walking to private and public transport. The ITS also helps countries and cities experiencing a fast growing urbanisation to manage congestion and improve the traffic network. An ITS application for transport of dangerous goods is then became substantial and necessary.
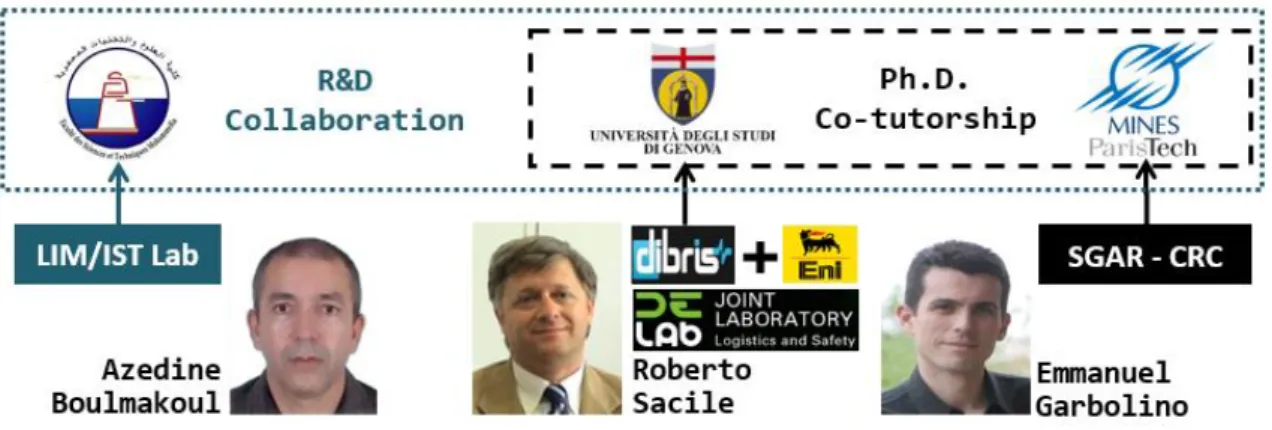
III. Thesis context
The thesis falls under Ph.D. co-tutorship between University of Genoa, Italy, and Mines ParisTech, France, as shown on Fig. 1-5. Enrolled respectively into the course of monitoring of systems and environmental risks
management, and the course of sciences and engineering of hazardous activities. From both courses, one can easily notice three keywords:
Monitoring, Risk, Hazard. Besides, an R&D collaboration is undertook with the Faculty of Science and Technology of Mohammedia.
In this section, I describe the context from which it emerges this thesis research. Since works have been done, others are ongoing, and an operational system exist. Then I define the objectives to meet, for my mission
3 The Intelligent Transportation System (ITS) is a recent concept emerged with
latest technological development as it is thoroughly discussed in (Hernndez et al., 2002; Crainicet al., 2009; Taniguchi and Shimamoto, 2004).
25
as a Ph.D. candidate, by projecting them on the motivations, context and the problem statements.
Fig. 1-5 The institution contributing in the PhD Thesis along with the respective tutors
III.1. Previous works: the existing system
This thesis is part of series of works that started some years ago and continues to evolve with the emergence of new advanced technologies. Since 2001, the Italian leading petrochemical company Eni4 R&M - Logistics Secondary division, collaborates with the DIBRIS5 department of University
of Genoa in Italy, under the name of DELAB - DIBRIS & Eni Joint Laboratory (see Fig. 1-5). The objective is to study possible improvements regarding transport safety of DG, petroleum products in particular. This collaboration has exploited various technologies and architectures of decision-making and information. The basis of this information system is the Transport Integrated
Platform (TIP), a basic ITS application on road transportation of DG (Benza
et al., 2012). This application has as main purpose the monitoring the fleet of vehicles that distribute petroleum products in Europe. Such vehicles are equipped with a GPRS device allowing the transmission of real-time data stream. The data are formatted following an internal syntax convention, and it describes the truck's state, GPS coordinates, and special/critical events. Then data are conveyed to a centralized server to provide support for the
4 Eni S.p.A. (http://www.eni.com/) is an Italian multinational oil and gas company
based in Rome. It operates in 79 countries, and represents Italy's largest industrial company.
5 Department of Computer science, Bioengineering, Robotics and Systems
26
various other logistical tools; such fleet management and scheduling, data mining, customer orders management, drivers training program, truck technical management and more (Benza et al., 2012). All these tools are available through a dashboard the one shown on Fig. 1-6.
Eni fleet consists (in the time of thesis writing) of more than 4600 vehicles, 1600 of them are dedicated to petrol product supplying through service stations for the automotive market. Currently more than 600 vehicles are monitored and transmit data regularly. These vehicles make two or three trips with an average distance of 170 km for each trip. The TIP platform for real-time monitoring consists of four main components: the On-board Unit, Transmission System (or Data Collector), Transmission Database Server and the GIS web application. The On-board unit is a sets of software and hardware devices installed in the vehicle. It collects events and telemetry data such
temperature, speed, geographical coordinates, and GPRS
transmitter/receiver for transmission over IP network. Whereas the GIS web application is a visual human-machine interface that translates the collected data to visual information easier to understand and analyse by the decision-maker, as depicted by Fig. 1-6.
Fig. 1-6 The graphical user interface of the Tranport Integrated Platform: the dashboard on the left, web mapping on the rigth showing a monitored truck over italian territories.
The TIP, addresses mostly the needs stated along the section. However, it still has to be enhanced to keep track of the growing number of monitored vehicles. Since, in the short terms, it will cover a larger number of vehicles and countries. In fact, the actual data collection system is costly in terms of
27
GPRS connection transmission and, consequently, convey data at a frequency of 5 minutes. That is why we need a better ubiquitous real-time monitoring system with a frequency of transmission of few seconds, and scalable, which is dealing with larger number of transmitted data. These issues will be thoroughly discussed in the Chapter 4.
III.2. Thesis objectives
The objectives I had to carry out during my Ph.D. emanate from the need to addresses all problems highlighted so far, from the need of improvement of the existing system, and from the state of art and works carried out by my tutors. The whole is to be seen in the context of the development of an Intelligent Transportation System as pictured by Fig. 1-7, where we can see the real-time monitoring, the data collection system, real and virtual vehicles, and route optimization algorithm. This research aims at contributing to the ITS platform that can be used in the planning and management of DGT. However, the research problem is much more oriented towards the development of a route optimization model considering economic and safety factors of DGT. By doing so, we are contributing to the management of the DGT system. Here below the four objectives of my thesis.
First, the development of a reliable and scalable data collection middleware, which represents an important component of the real-time monitoring system for data transmission, processing and storage. This represents a very important technical improvement for the TIP and a significant scientific contribution in data management. Secondly, the design of an architecture allowing the integration of agent-based traffic simulation in the real-time monitoring system of the TIP. The reason for traffic simulation stems from the need of a broader freedom and customization, scenarios creation and refinement of tests, models and instruments whose reliability are yet to be determined. This does not challenge the field-testing, which it is supposed to be executed at later stages. Thirdly, the conception and development of an algorithm for time-dependent route optimization. The algorithm should select the best path for shipment of a vehicle carrying dangerous goods from the loading terminal
28
(such production site) to the distribution point. In this work, the best path means the fastest and safest one, where economic (time) and risk factors are taking into consideration for decision support. These factors are time-dependent; they continuously evolve and change since a dynamic environment affects them. Finally, the fuzzy risk modelling as uncertainty representation approach. Since risk is a fuzzy notion, and can be neither exactly determined nor being null. The perception of hazard and risk is hard to quantify, and can be better-expressed using fuzzy logic. Initially, the various risk factors that can influence somehow the DGT should be defined.
Fig. 1-7 an overview of an Intelligent Transportation System for Real-time monitoring, simulation, route optimization taking into consideration travel time, population, transported
HazMat
IV. Thesis outline
Up to now, I have introduced facts proving the importance of dangerous goods, and the growing quantity shipped over the last decade. I also highlighted the hazard of transporting DG and its serious impact on population and environment if any catastrophic accident occurs, which are mostly caused by DGT road traffic. To understand the challenges of DGT, I identified the potential DGT stakeholders and their roles. Then, I listed the
29
reasons for undertaken a research on optimizing the road transport system of DG. The second section concerned the main problem statements encountering DGT. Finally, I detailed the thesis context and the objectives I should achieve as a Ph.D. candidate. Let me introduce the outline of this thesis dissertation. It is divided into six chapters:
Chapter 2. Dangerous Goods Transport. It comes after the current one. This chapter is a literature review of the risk management in Dangerous Goods Transport. First, it starts by highlighting facts about the important of DGT and the modality of transportation. Then focus on the road traffic accident and its impact on DGT. Finally, risk management strategies in DGT are discussed.
Chapter 3. An Intelligent Transportation System. This chapter details the general goal of the thesis. First, it starts by detailing the existing system that is the Transport Integrated platform. Then, it addresses the agent-based traffic simulation for injection of virtual vehicles in the TIP.
Chapter 4. Data Collection Middleware. I dedicate this chapter to problem of achieving a reliable, efficient and scalable data collection system. As mentioned before, this technical and scientific contribution addresses the most important component of the real-time monitoring system.
Chapter 5. Fuzzy Risk & Fuzzy Ranking. The methodology for risk uncertainty quantification using fuzzy sets theories is the theme of this chapter. In addition, I also address the ranking problem within fuzzy sets, thus an original approach is introduced for this matter.
Chapter 6. Multicriteria Route Optimization. In this chapter, I tackle step by step the methodology for optimizing route selection. The algorithm is based on A-star bidirectional search using Voronoi diagrams for graph subdivision. The algorithm is extended to manage the trade-off between the economic and safety criteria, respectively travel time and risk by using a multi-objective function. An example portraying the algorithm steps is presented toward the end of the chapter.
Chapter 2. Dangerous Goods Transport
The purpose of this chapter is to provide facts that support the goal of this research work. First, by underlining the criticality of road transport of dangerous goods. Then, by discussing risk assessment in DGT. Finally, by considering the uncertainty factors and their representation using fuzzy set theory.
I. Chapter introduction
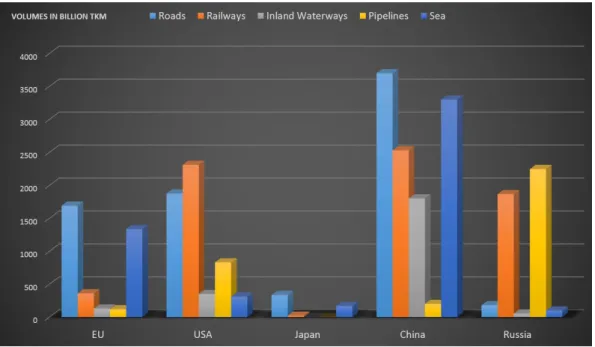
In Europe and all over the world, goods are transported by various modalities: air, sea, inland waterways, roads, railways, and pipelines. The economic and geo strategies, besides to the infrastructure, resources and transportation cost of each country, influence greatly the modal split of goods transport. Yet, the road has the most important modal shares. In certain region, sea transport exceed significantly road transport for international freight traffic. In the following, I will discuss in detail the modal split to understand better the importance of road traffic in Europe and especially in Italy and France. Thus, it seemed appropriate, as well as interesting, to start by describing the statistical data regarding the volume of freight traffic.
Fig. 2-1 Quantity (in Billion tkm) of internal freight traffic in 2009 by mode of transport, in the world, Eurostat, ITF
The Fig. 2-1 compares the annual quantity of internal freight traffic (in
billion tkm
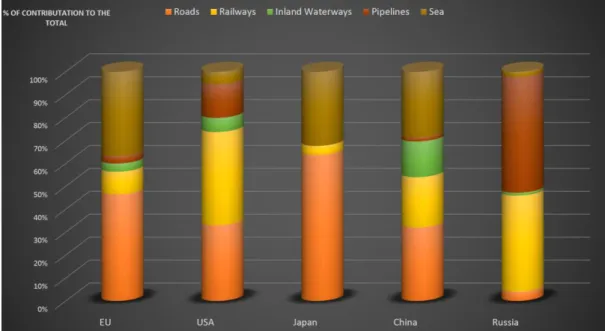
) between UE, USA, Japan, China and Russia and for each modes of transport: Roads, Railways, Inland waterways, Pipelines. From these data it is clear that, in addition to the geographic and economic factors, in all the areas considered (except for Russia) the quantities of goods transported by road is particularly high. Whereas the railways modality is extensively used in countries with a large surface area such the United States, China and Russia. Inland waterways (by river or lake) have less importance except for China. Pipelines play a fundamental role in Russia, given its great asset of oil and natural gas. These data affects, obviously, the development of road infrastructure and the motorways, under which it is expected to boost the road freight traffic in developing countries, as well as, in developed ones.The observations on Fig. 2-1 become more apparent when we compare rather the modal shares of the internal freight traffic as shown on Fig. 2-2. This figure highlights the contribution of each modality in the total of internal freight traffic. We also observe the importance of sea traffic in freight transportation.
Fig. 2-2. Modal split of the internal freight traffic throughout the world, Eurostat, ITF
Up to now, we have analysed the extent and the relative importance of the major mode of transport for the internal freight traffic. It is also interesting to analyse what are the common modalities used in foreign trade. The only
statistics available are those related to the European Union and provided by Eurostat. One of the interesting points that emerge when analysing foreign trade is, what are the most used transport modalities in import-export?
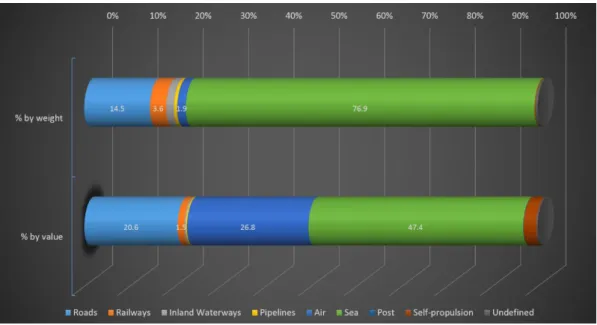
The following chart in Fig. 2-3 (measured in terms of value and weight of the goods transported by different modes) shows the role of maritime transport. This mode is used for transporting roughly 76.9% of quantity of goods over which it has almost no competition. Consequently, maritime transport manages 47.4% of the worth of total goods transported, in which the aviation is the biggest competitor by 26.8%. Although the road is less used in foreign trade, it still has a significant portion in the transport of goods with high value by 20.6%, and leaves an important part to railways for transportation of heavy goods.
Fig. 2-3. Modal split in foreign trade expressed in terms of value and weight, in EU27, Eurostat
Let us now compare the modal shares of roads, railways, inland waterways, and pipelines in freight traffic among the Western European countries (Fig. 2-4). Roads modality is predominant in Italy, France, Spain and UK, whereas less predominant in Germany to the benefit of railways. Germany also maintains high shares of inland navigation, practically absent in most of the countries of the EU. Germany represents the first EU country with the higher volume of goods transported by road (
313.1 billion tkm
), followed by Polandand Spain (over
210 billion tkm
). Poland is the country that has experienced the greatest growth, by almost 40%, in the period 2007-2010, contributing along with Bulgaria, Slovenia and the Czech Republic to shifting eastward the centroid of the European freight traffic. An important exception is Romania, which in the same period, has seen a reduction in freight traffic by more than 55%. In major European countries, the transport of goods by road is mostly national and generally represents at least 70% of total freight traffic.Fig. 2-4. Modal split of Domestic and international freight traffic in Western Europe, Eurostat 2012
As regards to the ratio of population to the volume of freight traffic, is more consistent in Luxembourg (
171.5 million tkm
per ten thousand inhabitants), as well as in Slovenia, Lithuania, Poland, Finland and Slovakia, all with values greater than50 million tkm
per ten thousand inhabitants. In Italy, by 2010 the ratio of population to the volume of traffic of goods by road is amounted to29 million tkm
per ten thousand inhabitants, slightly higher to what was recorded in same year in France (28.1 million tkm
per ten thousand inhabitants). Much lower than ratio of Spain (45.6
) and Germany (38.3
), and higher than in United Kingdom (22.6
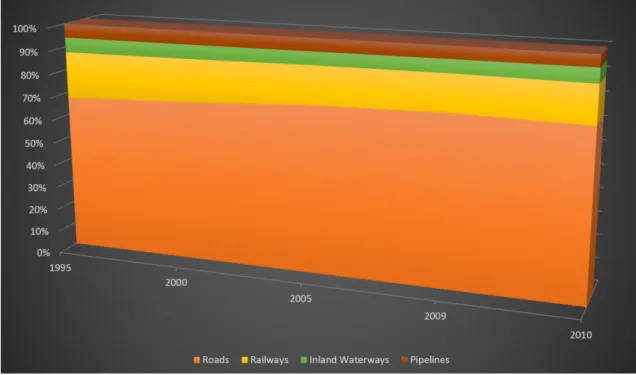
). The greatest increases of the ratio in the period 2007-2010, are found amongst same countries with the greatest growth of freight traffic (Poland, Bulgaria, Slovenia and the Czech Republic).Finally, the Fig. 2-5 summarizes the last 20 years evolution of the modal split of freight traffic in the European Union. It is clear that roads were and still predominant mode of transportation, and continue to gain in traffic share. Despite the European desire to give more importance to railways traffic.
Fig. 2-5. Evolution of the modal split of freight traffic along 1995-2010 in UE27, Eurostat 2012
II. Road transport of dangerous goods
II.1. Dangerous Goods (DG), what are they?
Dangerous goods, DG, (or hazardous materials, HazMat, as often called in USA), may be mixtures of substances, pure chemicals, articles or manufactured products that can threaten safety of people, any living organisms, the environment or surrounding properties if handled awkwardly while in manufacturing, storage, transport or usage.
II.2. DG in transport
In transport, dangerous goods are materials and substances that present apparent risks during the transportation, as risk of explosion or toxic chemicals release into groundwater.
The DGT is regulated to prevent as possible catastrophic accidents involving human, damage the environment, the vehicle of transport, goods transported, property. Each transport modality (road, railway, sea, air, inland waterway, and pipeline) has its own regulations. The UN regulations for the DGT, published for the first time in 1957 and periodically updated, are the point of reference for all the laws specific to the different modes of transport at international, local and national level. For each modality a set of international regulations are in place, as the following:
ADR: the transport of dangerous goods by road;
RID: the international transport of dangerous goods by railway;
AND: the international transport of dangerous goods on internal rivers/canals;
ICAO and IATA: transport by aeroplane; IMDG Code: maritime transport.
The European Agreement concerning the International Carriage of Dangerous Goods by Road (ADR) is the main regulation on DG transport on road. ADR has been written at Geneva on 30 September 1957 under the auspices of the United Nations Economic Commission for Europe, and it came into force on 29 January 1968. The Agreement itself was modified by the Protocol amending article 14 approved at New York on 21 August 1975, which entered into force on 19 April 1985 (ADR, 2013). The ADR was approved by law in Italy on 12th August 1962 n. 1839, in France with act n. 60 – 794 on 22nd June 1960, and approved by the Moroccan parliament then came into effect in June 2003.
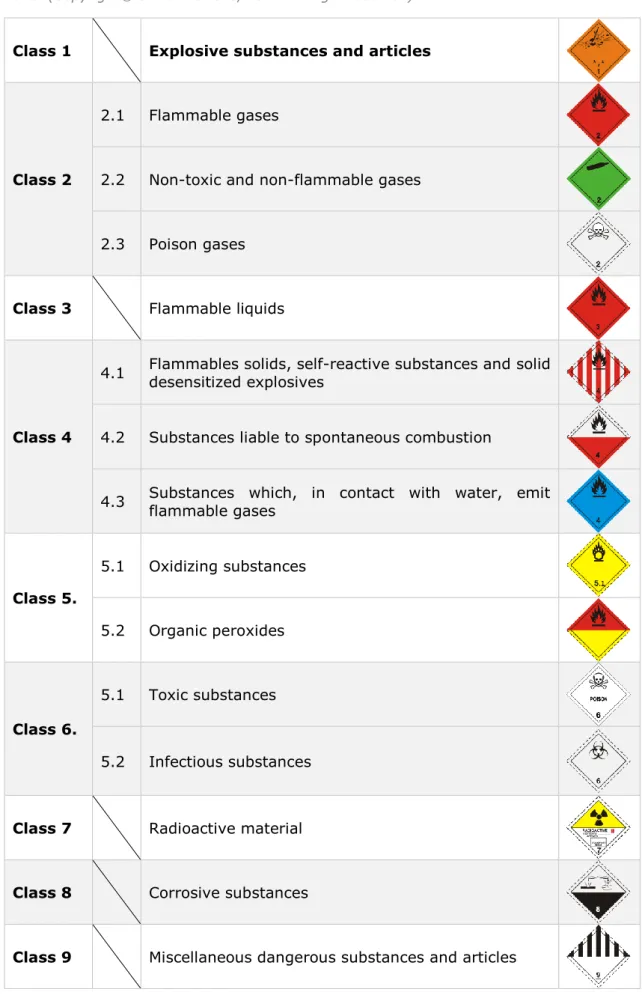
The ADR regulations use a classification system in which each dangerous substance or article is assigned to a “Class”, depending on the nature of the danger it presents. There are nine Classes, some of which are sub-divided, as shown on Table 2-1. These hazardous materials can be radioactive, flammable, explosive, corrosive, oxidizing, asphyxiating, bio-hazardous, toxic, pathogenic, or allergenic materials (Berman et al., 2007), and in any state, liquid, solid or gas.
Table 2-1 the classes of dangerous goods according to ADR applicable as from 1 January 2013. (Copyright© United Nations, 2012. All right reserved)
Class 1 Explosive substances and articles
Class 2
2.1 Flammable gases
2.2 Non-toxic and non-flammable gases
2.3 Poison gases
Class 3 Flammable liquids
Class 4
4.1 Flammables solids, self-reactive substances and solid desensitized explosives
4.2 Substances liable to spontaneous combustion
4.3 Substances which, in contact with water, emit flammable gases
Class 5. 5.1 Oxidizing substances 5.2 Organic peroxides Class 6. 5.1 Toxic substances 5.2 Infectious substances
Class 7 Radioactive material
Class 8 Corrosive substances
The ADR regulations topic goes from method of identification of dangerous goods, passing by the technical suitability checking of the vehicles, to the training of the vehicle drivers. In addition to monitoring of the vehicles that must be equipped with devices transmitting data such geographical position coordinates.
II.3. DG transportation shares
To determine the percentage of the contribution of DGT in the total freight traffic in Italy, I rely on the data collected by the National Institute for Statistics ISTAT6, as reported on Fig. 2-6. Statistics show that in the last
twenty years, the DGT shares has been oscillating around
10%
with peaks reached in the early 90s of the last century both in terms of tons and tkm.More detailed analyses show that, overall, in Italy the majority (
~ 80%
) of dangerous goods transported by roads are petroleum products. Regarding the ADR classification, in terms of tonnes: 77.7% are flammable liquids (class 3, includes Gasoline, Methanol, Fuel, Crude oil, Mineral oil);
12.6% are compressed gas, liquefied or dissolved under pressure (mainly Propane and Ammonia);
7.0% consisting of corrosive (class 8, includes acids and other corrosive substances such as Oleum, Sulphuric Acid, Nitric acid and Hydrochloric acid, Sodium and Potassium Hydroxide, and Hypochlorite solutions);
These three categories accounted for 97.3% of the quantity of dangerous goods transported by road in Italy.
6The National Institute for Statistics (ISTAT) is the main supplier of official statistical information in
Fig. 2-6 Evolution of the total traffic of goods and dangerous goods (Billion tkm) in Italy 1990-2010
As regards the transport of radioactive material (Class 7), in Italy it is very rare (due to the elimination, not yet completed, of old waste). In other European countries, where there are fully operational nuclear power plants, the transportation of these HazMat products is closely monitored and much of their weight account for the protective packaging weight. Regarding other radioactive materials used for medical purposes are transported by air.
II.4. DG transportation and road traffic accidents
One cannot predict easily the occurrence of road accidents due to the great many degrees of freedom. Since the main variables (day, time, location, traffic intensity, type of vehicle) does not always appear to be determinately connected. What cause directly an accident is much more likely to be the psychophysical state of the driver, whom level of concentration affect inversely the level of unpredictability.
In the last few years, accident statistics follow a fluctuating trend with a recent slight decline. A first view of the ISTAT data indicates the overall trend in the number of accidents on Italian roads, and highlights a sharp decline in the mortality rate (Fig. 2-7). By considering the type of road, in 2010 most accidents occurred on urban roads (75.7%), which caused 72.1% of total