A
c
c
e
p
te
d
Preprint
This article is protected by copyright. All rights reserved Critical Review
Screening-level risk assessment of methylmercury for non-anadromous Arctic
char (Salvelinus alpinus)
Benjamin D. Barst, Paul E. Drevnick, Derek C.G. Muir, Nikolaus Gantner, Michael Power,
Günter Köck, Nathalie Chéhab, Heidi Swanson, Frank Rigéti, Niladri Basu
Environ Toxicol Chem., Accepted Article • DOI: 10.1002/etc.4341
Accepted Article
"Accepted Articles" are peer-reviewed, accepted manuscripts that have not been edited, formatted, or in any way altered by the authors since acceptance. They are citable by the Digital Object Identifier (DOI). After the manuscript is edited and formatted, it will be removed from the “Accepted Articles” Web site and published as an Early View article. Note that editing may introduce changes to the manuscript text and/or graphics which could affect content, and all legal disclaimers and ethical guidelines that apply to the journal pertain. SETAC cannot be held responsible for errors or consequences arising from the use of information contained in these manuscripts.
A
c
c
e
p
te
d
Preprint
This article is protected by copyright. All rights reserved
Critical Review Environmental Toxicology and Chemistry
DOI 10.1002/etc.4341
Screening-level risk assessment of methylmercury for non-anadromous Arctic
char (Salvelinus alpinus)
Running Head: Risk of methylmercury for non-anadromous Arctic char
Benjamin D. Barsta,b,*, Paul E. Drevnickc,d, Derek C.G. Muire, Nikolaus Gantnerf, Michael Powerg, Günter Köckh, Nathalie Chéhaba, Heidi Swansong, Frank Rigéti, Niladri Basua
aFaculty of Agricultural and Environmental Sciences, McGill University, Montréal, QC, Canada,
H9X 3V9
bWater and Environmental Research Center, Alaska Stable Isotope Facility, University of Alaska Fairbanks, Fairbanks, AK 99775, USA
cInstitut national de la recherche scientifique, Centre Eau Terre et Environnement (INRS-ETE), Québec, QC, Canada G1K 9A9
dEnvironmental Monitoring and Science Division, Alberta Environment and Parks, Calgary, AB
Canada, T2E 7L7
eAquatic Contaminants Research Division, Environment Canada, Burlington, ON, L7S 1A1,
Canada
fEnvironmental Science Program, University of Northern British Columbia, Prince George, BC,
V2N 4Z9, Canada
gDepartment of Biology, University of Waterloo, Waterloo, ON 5 N2L 3G1, Canada
hInstitute for Interdisciplinary Mountain Research (ÖAW-IGF), 6020 Innsbruck, Austria
iAarhus University, Faculty of Science and Technology, Department of Bioscience, Arctic
Research Centre (ARC), DK-4000 Roskilde, Denmark
*Corresponding author: bdbarst@alaska.edu
This article contains online-only Supplemental Data
This article is protected by copyright. All rights reserved
Submitted 16 October 2018; Returned for Revisions 12 December 2018; Accepted 14 December 2018
A
c
c
e
p
te
d
Preprint
This article is protected by copyright. All rights reserved
Abstract: Non-anadromous forms of Arctic char (Salvelinus alpinus), those that are restricted to
lakes and rivers, typically have higher mercury concentrations than anadromous forms that
migrate to and from the sea. Using tissue burden data from the literature and our own analyses,
we performed a screening-level risk assessment of methylmercury for non-anadromous Arctic
char. Our assessment included 1569 fish distributed across 83 sites. Site-specific mean total
mercury concentrations in non-anadromous Arctic char muscle varied considerably from 0.01 to 1.13 μg/g wet weight (ww), with 21% (17 of 83 sites) meeting or exceeding a threshold-effect
level in fish of 0.33 μg/g ww, and 13% (11 of 83 sites) meeting or exceeding a threshold-effect
level in fish of 0.5 μg/g ww. Of the sites in exceedance of the 0.33 μg/g threshold, seven were
located in Greenland and ten in Canada (Labrador, Nunavut, Yukon). All but one of these sites
were located in interfrost or permafrost biomes. Maximum total mercury concentrations exceeded 0.33 μg/g ww at 53% of sites (40 of the 75 sites with available maximum mercury
values), and exceeded 0.5 μg/g ww at 27% (20 of 75 sites). Collectively, these results indicate
that certain populations of non-anadromous Arctic char located mainly in interfrost and
permafrost regions may be at risk for methylmercury toxicity. This approach provides a simple
statistical assessment of methylmercury risk to non-anadromous Arctic char, and does not
indicate actual effects. We highlight the need for studies that evaluate the potential toxic effects
of methylmercury in non-anadromous Arctic char, as well as those that aid in the development of
a methylmercury toxic-effect threshold specific to this species of fish. This article is protected by
copyright. All rights reserved
Keywords: methylmercury; Arctic char; Salvelinus alpinus; non-anadromous; risk assessment; lakes; threshold-effect level
A
c
c
e
p
te
d
Preprint
This article is protected by copyright. All rights reserved
INTRODUCTION
Human activities, including mining and fossil-fuel combustion, release and transport mercury
(Hg) in the environment (UNEP 2013). Gaseous elemental mercury (Hg0) emitted from these
sources has a long atmospheric residence time (up to 1 year) allowing it to be distributed
globally, and thus even unpopulated regions are subject to Hg contamination (Driscoll et al.
2013). Methylmercury (MeHg), produced by microbes, bioaccumulates and biomagnifies in
aquatic food webs (Driscoll et al. 2013). As a result, fish worldwide are contaminated with Hg,
and MeHg comprises the majority of the total Hg (THg) present in fish (Bloom 1992; Grieb et al.
1990).
A growing body of evidence indicates that MeHg concentrations regularly found in fish
may negatively impact their health. Methylmercury causes oxidative stress, and results in altered
gene expression, biochemistry, and histology in wild fish as well as fish exposed in the
laboratory (Sandheinrich and Wiener 2011). Laboratory exposures have demonstrated that
environmentally relevant concentrations of dietary MeHg negatively impact reproduction. For
example, in fathead minnows (Pimephales promelas) exposed to dietary MeHg at
environmentally relevant concentrations, circulating sex hormones were suppressed in both sexes
leading to decreased fecundity in females and altered reproductive behavior in males (Drevnick
and Sandheinrich 2003; Drevnick et al. 2006; Sandheinrich and Miller 2006). The combined
effects of these laboratory exposures on females and males resulted in reproductive failure
(Hammerschmidt et al. 2002). Field studies have also reported altered hormone levels in fish
with elevated Hg concentrations, albeit in environments grossly polluted with other contaminants
A
c
c
e
p
te
d
Preprint
This article is protected by copyright. All rights reserved
Analyses of the available data for MeHg toxicity in fish indicate that effects are likely to
occur at concentrations in edible muscle equal to or above 0.33 and 0.5 µg/gwet weight (ww)
(equivalent whole-body concentrations are 0.2 µg/g ww (Beckvar et al. 2005), or 0.3 µg/g ww
(Dillon et al. 2010; Sandheinrich and Wiener 2011), respectively). Comparing muscle THg
concentrations found in wild fish to a threshold-effect level (TEL) is a simple statistical approach
for assessing the potential for toxic effects. Sandheinrich et al. (2011) used this approach to
estimate that 43% of sexually mature female walleye (Sander vitreus) populations in the Great
Lakes region of North America are at risk of MeHg toxicity. A similar analysis for yellow perch
(Perca flavescens) demonstrated that 6.5% of the 691 populations sampled exceeded the Hg TEL
of 0.2 µg/g ww (whole-body) in the Great Lakes region (Wiener et al. 2012).
Arctic char (Salvelinus alpinus, Linnaeus, 1758) is a species of fish in the family
Salmonidae that is found within water bodies of Arctic, subarctic, boreal, and temperate climate
regions. The species’ preference for cold water is consistent with a distribution across the
northern regions of Canada, Greenland, Europe, and Asia between approximately 42°N to 83°N
latitude (Klemetsen et al. 2003). Within alpine lakes and freshwaters north of ~75° N Arctic char
is often the only species of fish present, and the species is both ecologically and culturally
important. Though all Arctic char use freshwater habitats for reproduction and as nurseries for
their young, anadromous forms make annual migrations to the sea after spending several years in
freshwater. There are also landlocked (those lacking access to the sea) and resident populations
that comprise non-anadromous forms (Power et al. 2008).
Anadromous Arctic char have relatively low THg concentrations in muscle tissue; an
analysis by Evans et al. (2015) reported that across Canada the mean THg concentration in
A
c
c
e
p
te
d
Preprint
This article is protected by copyright. All rights reserved
Arctic char have been promoted as a nutritious food source by public health authorities. In
contrast, Hg concentrations are higher in non-anadromous (landlocked and resident) Arctic char
(Gantner et al. 2010; Lockhart et al. 2005; Swanson et al. 2011a; van der Velden et al. 2015; van
der Velden et al. 2013b). These observed differences are likely a result of higher THg and MeHg
levels at the base of lacustrine relative to marine food webs (van der Velden et al. 2013a).
Regardless of life-history type, Hg contamination of Arctic char is of concern from a human
health perspective given that many Indigenous communities rely on Arctic char as a part of their
traditional diets and typically augment stores in late winter from lake-based fisheries (Boivin and
Power 1990). Additionally, the potential deleterious effects of Hg to Arctic char are not well
characterized.
Given the ecological and cultural importance of Arctic char, we performed a
screening-level risk assessment of MeHg for non-anadromous Arctic char (NAAC), similar to efforts to
assess the risk of MeHg for Great Lakes fish (Sandheinrich et al. 2011). Our assessment was
carried out by comparing published MeHg toxicity thresholds and the available Hg data for
populations of NAAC. Here, we focus on NAAC given the assumption that their generally
higher Hg concentrations put them at greater risk for toxic effects than anadromous conspecifics.
METHODS Literature review
We performed a state-of-the-art review (Grant and Booth 2009) to better understand levels of Hg
contamination in wild NAAC. A literature search was performed with Web of Science,
SCOPUS, and ProQuest Agricultural & Environmental Science Database. The first and last
searches were performed on November 1st, 2017 and December 17th, 2017 respectively. The
A
c
c
e
p
te
d
Preprint
This article is protected by copyright. All rights reserved
Salvelinus alpinus OR Arctic char OR Arctic charr AND Mercury OR methylmercury OR Hg
OR CH3Hg OR MeHg
The following inclusion criteria were selected prior to performing the literature search.
1. Study discusses NAAC, and differentiates between anadromous and non-anadromous
forms.
2. Study presents mean or geometric mean THg or MeHg concentrations in fish muscle.
3. Study presents data for a minimum of three fish.
4. Study provides geographic location of the samples.
The Web of Science search generated 68 results, while the SCOPUS and ProQuest searches
generated 219 and 832 results respectively. In total, 21 studies were included from this search as
they met the inclusion criteria. All of the studies reported THg in NAAC muscle, and only one
study (Lescord et al. 2015) reported muscle THg and the percentage of MeHg in a subset of
NAAC. From the selected studies, we gathered THg data (minima, maxima, arithmetic means,
geometric means, and medians) for NAAC muscle, as well as arithmetic mean lengths, weights,
and ages of the fish, when available. To standardize lengths, we calculated total lengths from
fork lengths by multiplying fork lengths by 1.05 (Tallman et al. 2013). If the same site was
sampled for multiple years we collected data for the most recent sampling period. We also
documented the terrestrial biomes surrounding the water bodies from which NAAC were
collected to better understand the populations that have been sampled for Hg. Terrestrial biomes
were initially assigned by visual comparison of sampling locations with the Major Biomes map
produced by the United States Department of Agriculture (USDA-NRCS 1999). Subsequently, a
A
c
c
e
p
te
d
Preprint
This article is protected by copyright. All rights reserved
locations of the various NAAC populations was generated using ArcGIS 10.4 and several
shapefiles (Brown et al. 2017; Olson et al. 2001; Pecher et al. 2011). Note that we classified
lakes as alpine if their elevations were above 1500 m.
Sampling and analysis of Arctic char muscle
In addition to information obtained from the literature, we also present our original data for
NAAC sampled from eight lakes. Four of these lakes, Boomerang (73.94°N, -92.89°W),
Aqiatusuk (74.70°N, 94.23°W), Lake 10 (68.14°N, 106.40°W), and Lake 32 (68.15°N,
-106.52°W) are located in Nunavut, Canada. Arctic char from Boomerang and Aqiatusuk have
been sampled for THg as previously described in Muir et al. (2010) and (2005a). The remaining
four lakes, Fragasso (47.37°N, -71.31°W), Pemmican (47.64 °N, -70.77°W), Arthabaska (47.66
°N, -70.78°W), and des Îles (47.65 °N, -70.78°W) are located in Québec, Canada. Arctic char
from each of these sites were collected with gillnets. Fish were sacrificed, before lengths and
weights were recorded. Axial muscle was collected and frozen at -20 °C until analyzed for THg.
Otoliths of Arctic char from the eight lakes were collected to estimate age using either a
thin-section or break-burn method (Swanson et al. 2010). Ages for Arctic char collected from the
Quebec lakes were estimated by Mark Gautreau (Canadian Rivers Institute, University of New
Brunswick). Age estimates of Arctic char from Nunavut lakes were provided by John Babaluk
(Fisheries and Oceans Canada).
Muscle tissue samples were analyzed for THg by direct mercury analyzers (DMA-80,
Milestone Inc., Monroe, CT) according to USEPA method 7473 (EPA 2007) at Burlington’s
National Laboratory for Environmental Testing (NLET; Boomerang and Aqiatusuk), INRS-ETE
A
c
c
e
p
te
d
Preprint
This article is protected by copyright. All rights reserved
(UNB) Canadian Rivers Institute (Lakes 10 and Lake 32). Quality control data associated with
original THg data are presented in Supporting Information.
Risk of methylmercury exposure for non-anadromous Arctic char
To assess the potential for toxic effects of MeHg exposure, we compared THg concentrations in
NAAC muscle to the TELs developed by Beckvar et al. (2005), Dillon et al. (2010), and
Sandheinrich and Wiener (2011). Note that the majority of the THg in muscle of large Arctic
char (fork length > 180 mm) is present as MeHg (Lescord et al. 2015), which is similar to other
upper trophic level fish (Bloom 1992). Therefore, THg is an acceptable proxy for MeHg for the
purposes of risk assessment. Specifically, we compared means, maxima, and medians to the
TELs and noted whether they met or exceeded these values. Mean THg concentrations in muscle
were available for all of the populations included in the present study except for the sample of
Arctic char collected from Lake Tjulträsk, Sweden. For this sample, only a geometric mean THg
concentration was reported and, therefore for this sample only we compared the geometric mean
THg concentration to the TELs. For 61 of the 83 populations included in the present study, we
obtained data for each of the individuals in the populations allowing us to report medians and
maxima. In addition to the maximum THg concentrations obtained from the raw data, maximum
THg concentrations were published for 14 other Arctic char samples giving us a total of 75
maximum concentrations that could be compared to the TELs.
The TEL developed by Beckvar et al. (2005) (0.33 μg/g ww ) is based on laboratory
studies that assessed sublethal endpoints including growth, reproduction, development, and
behavior. The TEL developed by Dillon et al. (2010) (0.5 μg/g ww ) is based on laboratory
studies with endpoints most relevant to ecological risk assessment i.e., mortality, survival,
A
c
c
e
p
te
d
Preprint
This article is protected by copyright. All rights reserved
TELs developed by Beckvar et al. (2005) and Dillon et al. (2010) is that the former included
growth and behavior in their model. Sandheinrich and Wiener (2011) reported a TEL equivalent
to that of Dillon et al. (2010), however both laboratory and field studies were included in their
assessment and the authors indicated that toxic effects at or above the TEL would include
biochemical changes, cell and tissue damage, and reduced reproduction.
Statistical analyses
Data were tested for normality using Shapiro-Wilks tests and tested for outliers using Grubb’s
tests. If not normal, data were log10 transformed. Relationships among variables were first
examined in bivariate scatterplots and tested by simple correlation (Pearson r). Simple regression
models were only tested using the ordinary least-squares equation if the bivariate scatterplots
indicated a possible relationship. If data remained non-normal, a non-parametric correlation was
reported (Spearman r). For all statistical tests α= 0.05 was used. All statistical analyses were
performed with JMP Pro 13 Statistical Analysis Software (SAS Institute, Cary, NC, USA).
RESULTS
In the present study, we included data for NAAC from 83 sites comprising a total of 1569
individual fish. Of these 83 datasets, eight are original to the present study. Information about
sampling sites, Arctic char biological data (mean lengths (mm), weights (g), ages (yr)), and THg
(μg/g ww) descriptive statistics (minima, maxima, means, medians) are presented in Table 1. A
map presenting locations and mean muscle THg concentrations of NAAC is provided in Figure
1. The sites ranged in latitude from ~42°N (French Alps) to 82°N (northern Ellesmere Island).
Most of the sites were located in Canada (59 sites) followed by Greenland (10 sites), France (5
sites), Norway (3 sites), Austria (2 sites), Italy (2 sites), with one site in each of the Faroe
A
c
c
e
p
te
d
Preprint
This article is protected by copyright. All rights reserved
permafrost and interfrost biomes (n=65 combined), whereas fewer sites were located in alpine,
boreal or temperate biomes (n=18 combined).
Site-specific mean THg concentrations in NAAC muscle varied considerably from 0.01
to 1.13 μg/g ww. The lowest mean THg concentration was reported for a sample of resident
Arctic char from Roberts Lake, Nunavut (Swanson and Kidd 2010), and the highest mean THg
concentration was reported for a sample of landlocked Arctic char collected from an unnamed
lake in southwest Greenland (Rigét et al. 2010). Mean THg concentrations were equal to or
above the TEL of 0.33 μg/g ww at 21% of the sites, whereas Arctic char from only 13% were
equal to or above the TEL of 0.5 μg/g ww. Of the 83 Arctic char datasets included in this
analysis, we obtained maximum THg concentrations for 75 of the datasets. Of these 75 maxima,
53% were equal to or above 0.33 μg/g ww and 27% were equal to or above 0.5 μg/g ww.
Mean THg concentrations in Arctic char from seven of the sites in Greenland and ten in
Canada (Labrador, Nunavut, Yukon) exceeded the TEL of 0.33 μg/g ww. Mean THg
concentrations in Arctic char from six of the sites in Greenland also met or exceeded the TEL of 0.5 μg/g ww, as did mean THg concentrations in Arctic char collected from five sites in Canada
(Labrador, Nunavut, Yukon) (Barst et al. 2016; Bruce et al. 1979b; CACAR 2012; Gantner et al.
2010; Muir et al. 2005a; Rigét et al. 2000; Rigét et al. 2010). All of the Arctic char samples with
mean THg concentrations exceeding at least one of the TELs (n=17) were located between
~54°N and 75°N, and most (n=16) were in regions of tundra interfrost and permafrost.
Though median THg concentrations were available for a smaller number of datasets
(n=61) than mean concentrations, the percentages of sites exceeding the TELs were similar when
A
c
c
e
p
te
d
Preprint
This article is protected by copyright. All rights reserved
Arctic char muscle exceeded 0.33 μg/g ww, and 9 out of 61 (15%) median THg concentrations
exceeded 0.5 μg/g ww (Table 1 and Figure 2).
Across sites, THg concentrations in NAAC muscle were positively correlated with total
lengths (r=0.53, p<0.0001; n=59 datasets) and ages (r=0.47, p<0.0001; n=44 datasets) (Figure 3).
Mean total lengths (r=0.36, p=0.0008; 82 datasets) and mean ages (r=0.60, p<0.0001; 69
datasets) of NAAC increased significantly with latitude (Figure 4), however mean THg did not
vary significantly with latitude (r=0.11, p=0.32; n=83 datasets).
DISCUSSION
In the present study, we compared mean (n=83 datasets), median (n=75 datasets), and maximum
(n=61 datasets) THg concentrations in muscle of NAAC to available toxicity thresholds for
MeHg. The screening-level approach we employed is a simple method to assess risk of MeHg
for NAAC. Our study is unique in that we applied this type of screening-level assessment to
NAAC, whereas in the past these types of assessments have been carried out for species
distributed at lower latitudes (Sandheinrich et al. 2011; Wiener et al. 2012). Though
screening-level assessments are relatively simple to conduct, there are limitations which should be noted.
For example, while our assessment may suggest risk, it does not indicate actual effects and
therefore it should be validated with laboratory and field studies with Arctic char. The major
uncertainties associated with the use of TELs have been summarized by Dillon et al. (2010).
Here we briefly discuss uncertainties in the context of NAAC.
Importantly, none of the laboratory exposure studies that serve as the basis for the TELs
generated by Beckvar et al. (2005) and Dillon et al. (2010) used Arctic char as a study species.
Similarly, no studies with Arctic char were incorporated into the estimate of Sandheinrich and
A
c
c
e
p
te
d
Preprint
This article is protected by copyright. All rights reserved
plausible given that differences have been documented for species of birds (median lethal concentrations for MeHg dosed embryos ranged from 0.12 to 2.42 μg/g ww) (Heinz et al. 2009).
Fathead minnow were the predominate species of fish used in the laboratory studies serving as
the basis for the various TELs, and this species is known to be less sensitive to chemicals than
rainbow trout (Oncorhynchus mykiss) (Dillon et al. 2010; Teather and Parrott 2006), a species in
the same family as Arctic char. If this holds true for MeHg, the TELs may underestimate the
toxicity of MeHg to Arctic char, and by extension more NAAC populations may be at risk than
indicated by our assessment.
Data demonstrating the effects of MeHg to Arctic char are lacking. A study by de
Oliveira Ribeiro et al. (2002) demonstrated that a single dietary dose of MeHg (0.26 ± 0.5 μg/g
body weight) results in histological changes in Arctic char liver including necrosis and
alterations to cytoplasmic organization, though it is unclear what the muscle THg (or MeHg)
concentrations were in these fish (de Oliveira Ribeiro et al. 2002). Our previous work with wild
NAAC collected from lakes spanning a Hg contamination gradient in Nunavut, Canada indicate
that MeHg is not effectively detoxified in livers, which could explain tissue damage in the form
of hepatic fibrosis in Arctic char with elevated MeHg concentrations (Barst et al. 2016). Hepatic
fibrosis was more prevalent in Arctic char collected from Amituk Lake, where 73% of the Arctic char exceeded both the 0.3 and 0.5 μg/g ww TELs. Despite the elevated levels of Hg in Amituk
Arctic char, it is difficult to attribute the observed hepatic tissue damage to MeHg exposure
given the existence of confounding variables (for example other contaminants and parasites)
(Barst et al. 2016). Neither of these studies included endpoints that relate to the TELs. We
therefore highlight the need for future laboratory and field studies that continue to address the
A
c
c
e
p
te
d
Preprint
This article is protected by copyright. All rights reserved
axial muscle or whole-body THg concentrations to allow comparisons to be made to TELs.
Furthermore, a laboratory-based dosing study with Arctic char is necessary to develop a
species-specific TEL. Future studies should also aim to understand how contaminant mixtures affect wild
Arctic char, given that previous research has reported varying levels of polychlorinated
biphenyls (Cabrerizo et al. 2018; Dietz et al. 2018), organochlorine pesticides (Cabrerizo et al.
2018; Cleemann et al. 2000), and non-essential elements (Muir et al. 2005a) in the tissues of
NAAC.
A limitation of the present study is the low sample sizes of Arctic char from certain sites.
If we assume that the samples included in the present study are representative of their respective
populations then our analysis suggests that 21% of the NAAC populations included in the
present study are at risk for the toxic effects of MeHg. Additionally, 53% of the most
contaminated individuals in their respective populations are also at risk. These potential effects
include changes in growth, reproduction, development, and behavior, which are the sublethal
endpoints included in the 0.33 μg/g ww TEL estimated by Beckvar et al. (2005).
There are also uncertainties associated with the extrapolation from laboratory to wild fish
(Dillon et al. 2010). During laboratory exposures confounding variables are purposely limited in
order to isolate contaminant effects, whereas in wild systems fish are exposed simultaneously to
a myriad of other stressors (other contaminants, parasites, predation, temperature changes, etc.)
that may act in a synergistic fashion with MeHg to cause deleterious effects. Thus, it is difficult to gauge how well the 0.3 and 0.5 μg/g ww TELs apply to wild NAAC.
Total lengths and ages were strong predictors of muscle THg across sites, indicating that
the largest and oldest individuals have the highest THg concentrations. The positive relationships
A
c
c
e
p
te
d
Preprint
This article is protected by copyright. All rights reserved
NAAC being found in tundra regions. Our study was biased towards Arctic char datasets
representing tundra interfrost and permafrost regions, with about 78% of the NAAC included in
the study being located in these regions. The bias in the dataset included a much greater range in
Arctic char total lengths and ages for these regions. For Arctic char collected from Heintzelman
Lake, van der Velden et al. (2012) reported that fish age best explained differences in THg
among individuals. The authors also suggested that both changes in life history and diet shifts
altered THg levels of Arctic char, but size or length-at-age had little influence (van der Velden et
al. 2012).
Other factors also affect THg concentrations in fish, however, including rates of
atmospheric deposition and the ability of receiving landscapes and waterbodies to methylate
deposited Hg (Munthe et al. 2007). Atmospheric deposition of Hg decreases with increasing
latitude (Muir et al. 2009), which could explain relatively high THg concentrations for small,
NAAC from the boreal zone, where deposition rates are elevated and wetlands are prominent
features of the landscape. In the Canadian High Arctic, Gantner et al. (2010) explored how
trophic position, food web length, and abiotic factors influenced THg concentrations in 24
populations of landlocked Arctic char. Size, δ15N (trophic position), and age were good
predictors of THg concentrations in landlocked Arctic char populations. Additionally, Gantner et
al. (2010) reported that the catchment-to-lake area ratio was positively correlated with THg
concentrations of landlocked Arctic char, indicating that both biotic and abiotic factors influence
Arctic char Hg levels.
Considerable efforts have been made to understand the temporal trends of THg in Arctic
populations of NAAC. Though results demonstrate no change in THg concentrations over time
A
c
c
e
p
te
d
Preprint
This article is protected by copyright. All rights reserved
others (AMAP 2011; Muir 2017; van der Velden et al. 2015). For several landlocked Arctic char
populations on Cornwallis Island THg concentrations have declined slowly since 2005 in five of
six lakes for which long-term trends are available (Muir 2017). These decreases are in step with
decreasing atmospheric Hg concentrations, but could also be related to increased
photodegradation of MeHg as a result of decreased ice cover, which has been demonstrated for
Arctic marine ecosystems (Point et al. 2011). However, THg concentrations in landlocked
Arctic char from a sixth lake on Cornwallis Island (Small Lake) have been increasing since 2008.
Notably, MeHg in water and dissolved organic carbon were elevated in Small Lake relative to
the other five lakes on Cornwallis Island (Muir 2017). In contrast, no significant trend was
reported for Arctic char collected from Lake Abiskojaure, Sweden over a 25 year period (AMAP
2011). The 83 datasets included in our analysis represent NAAC sampled from a wide range of
years (1977 – 2015). Given the discrepancy in temporal trends of THg in populations of NAAC
it is possible that the THg concentrations included in our analysis are either representative,
below, or above current THg levels depending on the population.
IMPLICATIONS
Permafrost soils store approximately double the amount of Hg than all other soils, the
atmosphere, and oceans combined (Schuster et al. 2018). Permafrost is thawing as a result of
climate change (Hinzman et al. 2005), which in turn can release Hg and organic matter to the
environment (Creed et al. 2018). Dissolved organic matter (DOM) influences the fate of Hg in
aquatic environments in a variety of ways including influencing inorganic Hg and MeHg
transport in catchments (Ravichandran 2004), the methylation of inorganic Hg by bacteria
(Graham et al. 2013), the incorporation of MeHg at the base of food webs (Tsui and Finlay
A
c
c
e
p
te
d
Preprint
This article is protected by copyright. All rights reserved
Ravichandran 2004). The impacts of Hg and DOM release from permafrost stores are not well
understood, but could involve greater production of MeHg in adjacent water bodies and greater
contamination of food webs. An even greater proportion of NAAC populations from tundra
permafrost regions may be at risk for MeHg toxicity if Hg released from permafrost soils is
methylated and incorporated into the food webs supporting these fish.
Arctic char play an essential role in subsistence, economic, and socio-cultural aspects of
northern communities (Roux et al. 2011). In general, anadromous Arctic char are more
frequently consumed than NAAC by Inuit (Lemire et al. 2015; Roux et al. 2011). A recent food
recall survey reported that anadromous Arctic char was the second most consumed country food
by Nunavik Inuit communities, and landlocked Arctic char was consumed at a much lower
frequency (less than 1 to 2 %) (Lemire et al. 2015). While current exploitation of lacustrine
Arctic char may be relatively low, future reliance on these populations may increase with
potential decreases in anadromy as a result of climate change (Finstad and Hein 2012). We
therefore, reinforce the need for continued monitoring of trends in Hg concentrations of Arctic
char.
Acknowledgement - Funding for this project was provided by a Northern Contaminants Program
(NCP) grant (Barst and Basu), by the NCP core monitoring project (Muir), and by the Austrian
Academy of Sciences (Köck). The authors thank D. Iqaluk for her help with Arctic char
collections and Indigenous knowledge on landlocked Arctic char. The Polar Continental Shelf
Project provided invaluable logistical support for collections in the Canadian High Arctic. We
thank G. Lescord and K. Hudelson for Arctic char collections. We thank J. Funck for creating the
A
c
c
e
p
te
d
Preprint
This article is protected by copyright. All rights reserved
Data Availability – Please contact the corresponding author (bdbarst@alaska.edu) for any
requests for access to data.
A
c
c
e
p
te
d
Preprint
This article is protected by copyright. All rights reserved
REFERENCES
Adams SM, Bevelhimer MS, Greeley Jr MS, Levine DA, Teh SJ. 1999. Ecological risk
assessment in a large river-reservoir: 6. Bioindicators of fish population health. Environ Toxicol
Chem. 18(4):628-640.
AMAP. 2005. Amap assessment 2002: Heavy metals in the arctic.
AMAP. 2011. Mercury in the arctic.
Barst BD, Rosabal M, Campbell PG, Muir DG, Wang X, Köck G, Drevnick PE. 2016.
Subcellular distribution of trace elements and liver histology of landlocked arctic char (salvelinus
alpinus) sampled along a mercury contamination gradient. Environ Pollut. 212:574-583.
Beckvar N, Dillon TM, Read LB. 2005. Approaches for linking whole‐ body fish tissue residues of mercury or ddt to biological effects thresholds. Environ Toxicol Chem. 24(8):2094-2105.
Bloom N. 1992. On the chemical form of mercury in edible fish and marine invertebrate tissue.
Can J Fish Aquat Sci. 49(5):1010-1017.
Boivin TG, Power G. 1990. Winter condition and proximate composition of anadromous arctic
charr (salvelinus alpinus) in eastern ungava bay, quebec. Canadian Journal of Zoology.
68(11):2284-2289.
Brown J, Ferrians O, Heginbottom J, Melnikov E. 2017. Circum-arctic map of permafrost and
ground-ice conditions, version 2, [permaice]. NSIDC: National Snow and Ice Data Center Date
Accessed. Boulder, Colorado USA.
Bruce WJ, Spencer K, Arsenault E. 1979a. Mercury content data for labrador fishes, 1977-78.
Research and Resource Services Directorate, Canada Department of Fisheries and the
A
c
c
e
p
te
d
Preprint
This article is protected by copyright. All rights reserved
Bruce WJ, Spencer KD, Arsenault E. 1979b. Mercury content data for labrador fishes,
1977-1978. In: Environment DoFat, editor. Saint John's Newfoundland.
Cabrerizo A, Muir DC, Köck Gn, Iqaluk D, Wang X. 2018. Climatic influence on temporal
trends of polychlorinated biphenyls and organochlorine pesticides in landlocked char from lakes
in the canadian high arctic. Environ Sci Technol. 52(18):10380-10390.
CACAR. 2012. Canadian arctic contaminants assessment report iii.
Cleemann M, Riget F, Paulsen G, de Boer J, Klungsøyr J, Aastrup P. 2000. Organochlorines in
greenland lake sediments and landlocked arctic char (salvelinus alpinus). Sci Total Environ.
245(1-3):173-185.
Creed IF, Bergström AK, Trick CG, Grimm NB, Hessen DO, Karlsson J, Kidd KA, Kritzberg E, McKnight DM, Freeman EC. 2018. Global change‐ driven effects on dissolved organic matter composition: Implications for food webs of northern lakes. Global Change Biol.
de Oliveira Ribeiro C, Belger L, Pelletier E, Rouleau C. 2002. Histopathological evidence of
inorganic mercury and methyl mercury toxicity in the arctic charr (salvelinus alpinus). Environ
Res. 90(3):217-225.
Dietz R, Letcher RJ, Sonne-Hansen C, Eulaers I, Desforges J-P, Jenssen BM, McKinney MA,
Basu N, Wilson S, Behe C. 2018. Amap assessment 2018: Biological effects of contaminants on
arctic wildlife and fish: Arctic monitoring and assessment programme (amap).
Dillon T, Beckvar N, Kern J. 2010. Residue‐ based mercury dose–response in fish: An analysis using lethality‐ equivalent test endpoints. Environ Toxicol Chem. 29(11):2559-2565.
Drevnick P, Sandheinrich M. 2003. Effects of dietary methylmercury on reproductive
A
c
c
e
p
te
d
Preprint
This article is protected by copyright. All rights reserved
Drevnick P, Sandheinrich M, Oris J. 2006. Increased ovarian follicular apoptosis in fathead
minnows (pimephales promelas) exposed to dietary methylmercury. Aquat Toxicol. 79(1):49-54.
Driscoll CT, Mason RP, Chan HM, Jacob DJ, Pirrone N. 2013. Mercury as a global pollutant:
Sources, pathways, and effects. Environ Sci Technol. 47(10):4967-4983.
EPA U. 2007. Method 7473: Mercury in solids and solutions by thermal decomposition,
amalgamation, and atomic absorption spectrophotometry. Washington, D.C.
Evans MS, Muir DC, Keating J, Wang X. 2015. Anadromous char as an alternate food choice to
marine animals: A synthesis of hg concentrations, population features and other influencing
factors. Sci Total Environ. 509:175-194.
Finstad AG, Hein CL. 2012. Migrate or stay: Terrestrial primary productivity and climate drive
anadromy in arctic char. Global Change Biol. 18(8):2487-2497.
Friedmann AS, Costain EK, MacLatchy DL, Stansley W, Washuta EJ. 2002. Effect of mercury
on general and reproductive health of largemouth bass (micropterus salmoides) from three lakes
in new jersey. Ecotoxicol Environ Saf. 52(2):117-122.
Gantner N, Muir DC, Power M, Iqaluk D, Reist JD, Babaluk JA, Meili M, Borg H, Hammar J,
Michaud W. 2010. Mercury concentrations in landlocked arctic char (salvelinus alpinus) from
the canadian arctic. Part ii: Influence of lake biotic and abiotic characteristics on geographic
trends in 27 populations. Environ Toxicol Chem. 29(3):633-643.
Graham AM, Aiken GR, Gilmour CC. 2013. Effect of dissolved organic matter source and
character on microbial hg methylation in hg–s–dom solutions. Environ Sci Technol.
47(11):5746-5754.
Grant MJ, Booth A. 2009. A typology of reviews: An analysis of 14 review types and associated
A
c
c
e
p
te
d
Preprint
This article is protected by copyright. All rights reserved
Grieb TM, Bowie GL, Driscoll CT, Gloss SP, Schofield CL, Porcella DB. 1990. Factors
affecting mercury accumulation in fish in the upper michigan peninsula. Environ Toxicol Chem.
9(7):919-930.
Hammerschmidt C, Sandheinrich M, Wiener J, Rada R. 2002. Effects of dietary methylmercury
on reproduction of fathead minnows. Environ Sci Technol. 36(5):877-883.
Heinz GH, Hoffman DJ, Klimstra JD, Stebbins KR, Kondrad SL, Erwin CA. 2009. Species
differences in the sensitivity of avian embryos to methylmercury. Arch Environ Contam Toxicol.
56(1):129-138.
Hinzman LD, Bettez ND, Bolton WR, Chapin FS, Dyurgerov MB, Fastie CL, Griffith B,
Hollister RD, Hope A, Huntington HP. 2005. Evidence and implications of recent climate
change in northern alaska and other arctic regions. Clim Change. 72(3):251-298.
Hontela A, Dumont P, Duclos D, Fortin R. 1995. Endocrine and metabolic dysfunction in yellow
perch, perca flavescens, exposed to organic contaminants and heavy metals in the st. Lawrence
river. Environ Toxicol Chem. 14(4):725-731.
Kahilainen K, Thomas S, Keva O, Hayden B, Knudsen R, Eloranta A, Tuohiluoto K, Amundsen
P-A, Malinen T, Järvinen A. 2016. Seasonal dietary shift to zooplankton influences stable
isotope ratios and total mercury concentrations in arctic charr (salvelinus alpinus (l.)).
Hydrobiologia. 783(1):47-63.
Klemetsen A, Amundsen PA, Dempson J, Jonsson B, Jonsson N, O'connell M, Mortensen E.
2003. Atlantic salmon salmo salar l., brown trout salmo trutta l. And arctic charr salvelinus
A
c
c
e
p
te
d
Preprint
This article is protected by copyright. All rights reserved
Koinig K, Köck G, Pla S, Ilyashuk E, Ilyashuk B, Lackner R, Psenner R. 2015. Impact of
melting permafrost and rock glaciers on water quality and aquatic organisms in alpine lakes.
ISBN-Online: 978-3-7001-7813-2.
Lemire M, Kwan M, Laouan-Sidi A, Muckle G, Pirkle C, Ayotte P, Dewailly E. 2015. Local
country food sources of methylmercury, selenium and omega-3 fatty acids in nunavik, northern
quebec. Sci Total Environ. 509:248-259.
Lescord GL, Kidd KA, Kirk JL, O'Driscoll NJ, Wang X, Muir DC. 2015. Factors affecting biotic
mercury concentrations and biomagnification through lake food webs in the canadian high arctic.
Sci Total Environ. 509:195-205.
Lockhart W, Stern G, Low G, Hendzel M, Boila G, Roach P, Evans M, Billeck B, DeLaronde J,
Friesen S. 2005. A history of total mercury in edible muscle of fish from lakes in northern
canada. Sci Total Environ. 351:427-463.
Marusczak N, Larose C, Dommergue A, Paquet S, Beaulne J-S, Maury-Brachet R, Lucotte M,
Nedjai R, Ferrari CP. 2011. Mercury and methylmercury concentrations in high altitude lakes
and fish (arctic charr) from the french alps related to watershed characteristics. Science of the
Total Environment. 409(10):1909-1915.
Muir D. 2017. Temporal trends of persistent organic pollutants and mercury in landlocked char
in high arctic lakes. Synopsis of research conducted under the 2016–2017 northern contaminants
program. Ottawa: Aboriginal Affairs and Northern Development Canada.
Muir D, Wang X, Bright D, Lockhart L, Kock G. 2005a. Spatial and temporal trends of mercury
and other metals in landlocked char from lakes in the canadian arctic archipelago. Sci Total
A
c
c
e
p
te
d
Preprint
This article is protected by copyright. All rights reserved
Muir D, Wang X, Bright D, Lockhart L, Köck G. 2005b. Spatial and temporal trends of mercury
and other metals in landlocked char from lakes in the canadian arctic archipelago. Science of the
Total Environment. 351:464-478.
Muir D, Wang X, Yang F, Nguyen N, Jackson T, Evans M, Douglas M, Kock G, Lamoureux S,
Pienitz R. 2009. Spatial trends and historical deposition of mercury in eastern and northern
canada inferred from lake sediment cores. Environ Sci Technol. 43(13):4802-4809.
Munthe J, Bodaly R, Branfireun BA, Driscoll CT, Gilmour CC, Harris R, Horvat M, Lucotte M,
Malm O. 2007. Recovery of mercury-contaminated fisheries. AMBIO: A Journal of the Human
Environment. 36(1):33-44.
Nielsen S, Mortensen R, Hoydal K, Erenbjerg S, Dam M. 2014. Amap faroe islands heavy
metals and pops core programme 2009–2012. Environment Agency: Faroe Islands.
Olk TR, Karlsson T, Lydersen E, Økelsrud A. 2016. Seasonal variations in the use of profundal
habitat among freshwater fishes in lake norsjø, southern norway, and subsequent effects on fish
mercury concentrations. Environments. 3(4):29.
Olson DM, Dinerstein E, Wikramanayake ED, Burgess ND, Powell GV, Underwood EC,
D'amico JA, Itoua I, Strand HE, Morrison JC. 2001. Terrestrial ecoregions of the world: A new
map of life on eartha new global map of terrestrial ecoregions provides an innovative tool for
conserving biodiversity. Bioscience. 51(11):933-938.
Pecher C, Tasser E, Tappeiner U. 2011. Definition of the potential treeline in the european alps
and its benefit for sustainability monitoring. Ecol Indicators. 11(2):438-447.
Point D, Sonke J, Day RD, Roseneau DG, Hobson KA, Vander Pol SS, Moors AJ, Pugh RS,
Donard O, Becker PR. 2011. Methylmercury photodegradation influenced by sea-ice cover in
A
c
c
e
p
te
d
Preprint
This article is protected by copyright. All rights reserved
Power M, Reist JD, Dempson JB. 2008. Fish in high-latitude arctic lakes. Polar lakes and
rivers.249-267.
Ravichandran M. 2004. Interactions between mercury and dissolved organic matter––a review.
Chemosphere. 55(3):319-331.
Rigét F, Asmund G, Aastrup P. 2000. Mercury in arctic char (salvelinus alpinus) populations
from greenland. Sci Total Environ. 245(1-3):161-172.
Rigét F, Vorkamp K, Muir D. 2010. Temporal trends of contaminants in arctic char (salvelinus
alpinus) from a small lake, southwest greenland during a warming climate. J Environ Monit.
12(12):2252-2258.
Rognerud S, Grimalt J, Rosseland B, Fernandez P, Hofer R, Lackner R, Lauritzen B, Lien L,
Massabuau J, Ribes A. 2002. Mercury and organochlorine contamination in brown trout (salmo
trutta) and arctic charr (salvelinus alpinus) from high mountain lakes in europe and the svalbard
archipelago. Water, Air and Soil Pollution: Focus. 2(2):209-232.
Roux M, Tallman R, Lewis C. 2011. Small‐ scale arctic charr salvelinus alpinus fisheries in canada's nunavut: Management challenges and options. J Fish Biol. 79(6):1625-1647.
Sandheinrich M, Wiener J. 2011. Methylmercury in freshwater fish: Recent advances in
assessing toxicity of environmentally relevant exposures. Environmental Contaminants in Biota:
Interpreting Tissue Concentrations. 2:169-190.
Sandheinrich MB, Bhavsar SP, Bodaly R, Drevnick PE, Paul EA. 2011. Ecological risk of
methylmercury to piscivorous fish of the great lakes region. Ecotoxicology. 20:1-11.
Sandheinrich MB, Miller KM. 2006. Effects of dietary methylmercury on reproductive behavior
A
c
c
e
p
te
d
Preprint
This article is protected by copyright. All rights reserved
Schuster PF, Schaefer KM, Aiken GR, Antweiler RC, Dewild JF, Gryziec JD, Gusmeroli A,
Hugelius G, Jafarov E, Krabbenhoft DP. 2018. Permafrost stores a globally significant amount of
mercury. Geophys Res Lett. 45(3):1463-1471.
Swanson H, Gantner N, Kidd KA, Muir D, Reist JD. 2011a. Comparison of mercury
concentrations in landlocked, resident, and sea‐ run fish (salvelinus spp.) from nunavut, canada. Environ Toxicol Chem.
Swanson H, Gantner N, Kidd KA, Muir D, Reist JD. 2011b. Comparison of mercury
concentrations in landlocked, resident, and sea‐ run fish (salvelinus spp.) from nunavut, canada. Environmental Toxicology and Chemistry. 30(6):1459-1467.
Swanson HK, Kidd KA. 2010. Mercury concentrations in arctic food fishes reflect the presence
of anadromous arctic charr (salvelinus alpinus), species, and life history. Environ Sci Technol.
44(9):3286-3292.
Swanson HK, Kidd KA, Babaluk JA, Wastle RJ, Yang PP, Halden NM, Reist JD. 2010.
Anadromy in arctic populations of lake trout (salvelinus namaycush): Otolith microchemistry,
stable isotopes, and comparisons with arctic char (salvelinus alpinus). Can J Fish Aquat Sci.
67(5):842-853.
Tallman R, Zhu X, Janjua Y, Toyne M, Roux M-J, Harris L, Howland K, Gallagher C. 2013.
Data limited assessment of selected north american anadromous charr stocks. Journal of
ichthyology. 53(10):867-874.
Teather K, Parrott J. 2006. Assessing the chemical sensitivity of freshwater fish commonly used
in toxicological studies. Water Quality Research Journal. 41(1):100-105.
Tsui MTK, Finlay JC. 2011. Influence of dissolved organic carbon on methylmercury
A
c
c
e
p
te
d
Preprint
This article is protected by copyright. All rights reserved
UNEP. 2013. Global mercury assessment: Sources, emissions, releases and environmental
transport. Geneva, Switzerland.
USDA-NRCS. 1999. Major biomes. United States Department of Agriculture, Natural Resources
Conservation Service.
van der Velden S, Dempson J, Evans M, Muir D, Power M. 2013a. Basal mercury concentrations
and biomagnification rates in freshwater and marine food webs: Effects on arctic charr
(salvelinus alpinus) from eastern canada. Sci Total Environ. 444:531-542.
van der Velden S, Dempson J, Power M. 2015. Comparing mercury concentrations across a
thirty year time span in anadromous and non-anadromous arctic charr from labrador, canada. Sci
Total Environ. 509:165-174.
van der Velden S, Evans M, Dempson J, Muir D, Power M. 2013b. Comparative analysis of total
mercury concentrations in anadromous and non-anadromous arctic charr (salvelinus alpinus)
from eastern canada. Sci Total Environ. 447:438-449.
van der Velden S, Reist JD, Babaluk JA, Power M. 2012. Biological and life-history factors
affecting total mercury concentrations in arctic charr from heintzelman lake, ellesmere island,
nunavut. Sci Total Environ. 433:309-317.
Wathne B, Patrick S, Cameron N. 1997. Al: Pe-acidification of mountain lakes: Palaeolimnology
and ecology. Part 2-remote mountain lakes as indicators of air pollution and climate change.
Webb MAH, Feist G, Fitzpatrick M, Foster E, Schreck C, Plumlee M, Wong C, Gundersen D.
2006. Mercury concentrations in gonad, liver, and muscle of white sturgeon acipenser
A
c
c
e
p
te
d
Preprint
This article is protected by copyright. All rights reserved
Wiener JG, Sandheinrich MB, Bhavsar SP, Bohr JR, Evers DC, Monson BA, Schrank CS. 2012.
Toxicological significance of mercury in yellow perch in the laurentian great lakes region.
A
c
c
e
p
te
d
Preprint
This article is protected by copyright. All rights reserved
Figure 1. Geographic distribution of non-anadromous Arctic char (Salvelinus alpinus) samples
included in the screening-level risk assessment (n=83). Populations of non-anadromous Arctic
char were grouped by mean total mercury concentrations in muscle (green circles = below 0.33 μg/gwet weight; orange circles = 0.33 to 0.5 μg/gwet weight; red circles = above 0.5 μg/gwet
weight). Groupings are based on threshold-effects levels 0.33 μg/gwet weight (Beckvar et al.
2005) and 0.5 μg/gwet weight (Dillon et al. 2010; Sandheinrich and Wiener 2011). Inset figures
bordered by solid lines show their respective dashed line boxes in greater detail. Terrestrial
biome demarcations (alpine, boreal, tundra interfrost, and tundra permafrost) were created with
ArcGIS 10.4 and various shapefiles (Brown et al. 2017; Olson et al. 2001; Pecher et al. 2011).
Figure 2. Box and whisker plots representing total mercury concentrations in a subset (n=61) of
non-anadromous Arctic char (Salvelinus alpinus) samples included in the screening-level risk
assessment. Boxes signify the interquartile range (IQR), the whiskers define the distance to the
furthest point within 1.5 X IQR, and the center line is the median. The solid line spanning the
graph represents the mercury threshold-effect level reported by Beckvar et al. (2005) (0.33 μg/g
wet weight) and the dashed line represents the threshold-effect level reported by Dillon et al.
(2010) and Sandheinrich and Wiener (2011) (0.5 μg/gwet weight). Arctic char with muscle total
mercury concentrations in the grey region are potentially at risk for toxic effects. The letters A,
B, I, and P signify alpine, boreal, tundra interfrost, and tundra permafrost biome groupings,
respectively.
Figure 3. Bivariate scatterplots of Arctic char log10 transformed muscle total Hg (μg/g wet
weight) versus total lengths (mm) and ages (years). Data points represent individual
A
c
c
e
p
te
d
Preprint
This article is protected by copyright. All rights reserved
Figure 4. Bivariate scatterplots of latitude (degrees) versus mean ages (years) and mean total
lengths (millimeters) of Arctic char. Data are from non-anadromous Arctic char sampled from 82
A
c
c
e
p
te
d
Preprint
This article is protected by copyright. All rights reserved
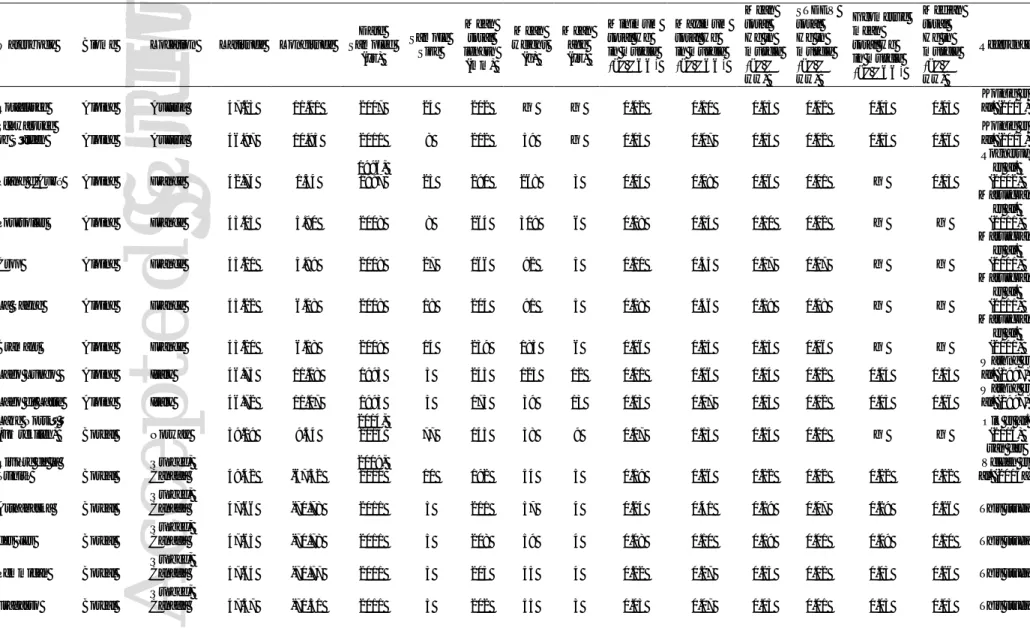
Table 1. Details of sample collection sites and non-anadromous Arctic char included in the screening-level risk assessment. Summary total mercury (THg) data (μg/g wet weight in muscle) are also presented.
Waterbody Biome Location Latitude Longitude
Date Sampled (yr) Sample Size Mean total length (mm) Mean weight (g) Mean age (yr) Minimum total Hg in muscle (μg/g ww) Maximum total Hg in muscle (μg/g ww) Mean total Hg in muscle (μg/g ww) STDEV total Hg in muscle (μg/g ww) Geometric mean total Hg in muscle (μg/g ww) Median total Hg in muscle (μg/g ww) Reference
Rotfelssee Alpine Austria 47.23 11.01 2007 24 202 — — 0.02 0.10 0.05 0.02 0.05 0.05
Koinig et al. (2015) Schwarzsee
ob Sölden Alpine Austria 46.97 10.95 2011 8 212 59 — 0.03 0.07 0.05 0.02 0.05 0.06
Koinig et al. (2015)
Étang d'Aubé Alpine France 42.74 1.34
1996,
1997 25 290 268 3 0.04 0.08 0.06 0.01 — 0.05
Rognerud et al. (2002)
Poursollet Alpine France 45.05 5.90 2008 8 264 309 6 0.08 0.14 0.10 0.02 — —
Marusczak et al. (2011)
Crop Alpine France 45.21 5.99 2008 27 166 92 5 0.10 0.35 0.17 0.07 — —
Marusczak et al. (2011)
La Sagne Alpine France 45.22 6.08 2008 18 204 91 5 0.08 0.46 0.19 0.08 — —
Marusczak et al. (2011)
Bramant Alpine France 45.20 6.18 2008 14 239 185 6 0.06 0.25 0.15 0.06 — —
Marusczak et al. (2011)
Lago Lungo Alpine Italy 46.73 11.08 1993 5 245 123 12 0.01 0.06 0.04 0.02 0.04 0.05
Wathne et al. (1997)
Lago di Latte Alpine Italy 46.72 11.07 1993 5 173 39 13 0.03 0.07 0.05 0.02 0.05 0.06
Wathne et al. (1997) Lake Norsjø
(Fjærekilen) Boreal Norway 59.19 9.54
2014, 2015 77 145 38 9 0.07 1.13 0.24 0.21 — — Olk et al. (2016) Rivière de la Trinité Boreal Québec, Canada 49.42 -67.32 2009, 2010 10 192 54 5 0.19 0.26 0.22 0.02 0.22 0.22 van der Velden et al. (2013a) Arthabaska Boreal Québec,
Canada 47.66 -70.78 2011 5 211 57 4 0.24 0.41 0.29 0.07 0.29 0.26 This study
des Îles Boreal
Québec,
Canada 47.65 -70.78 2011 5 208 59 4 0.08 0.10 0.09 0.01 0.09 0.10 This study
Pemmican Boreal
Québec,
Canada 47.64 -70.77 2011 5 203 55 4 0.22 0.27 0.25 0.02 0.03 0.26 This study
Fragasso Boreal
Québec,
A
c
c
e
p
te
d
Preprint
This article is protected by copyright. All rights reserved Nipishish Lake Boreal Labrador, Canada 54.17 -60.77 1977 7 316 330 8 0.28 0.46 0.35 0.07 — — Bruce et al. (1979a)
Lake Chibini Boreal Russia 67.69 33.44 1993 5 257 169 7 0.03 0.06 0.04 0.01 0.04 0.04
Wathne et al. (1997) á Mýrunum Temperate Faroe Islands 62.18 -7.12 2012 20 280 194 7 0.17 0.36 0.26 0.10 — — Nielsen et al. (2014) Ikarut Lake Tundra interfrost Labrador,
Canada 58.13 -63.63 1978 10 439 560 14 0.07 0.42 0.19 0.12 — — al. (1979a) Bruce et
Komaktorvik Lake Tundra interfrost Labrador, Canada 59.15 -64.23 1978 6 471 750 15 0.06 0.25 0.11 0.07 — — Bruce et al. (1979a) Mistastin Lake Tundra interfrost Labrador, Canada 55.90 -63.27 1978 4 523 1230 10 0.04 0.22 0.11 0.08 — — Bruce et al. (1979a) Mistinippi Lake Tundra interfrost Labrador, Canada 54.78 -61.32 1978 13 426 640 11 0.13 0.96 0.50 0.24 — — Bruce et al. (1979a) Saglek Lake Tundra interfrost Labrador, Canada 58.82 -63.35 1978 17 516 1090 19 0.11 0.34 0.19 0.07 — — Bruce et al. (1979a) Shallow Lake Tundra interfrost Labrador,
Canada 57.65 -63.23 1978 5 459 620 13 0.24 0.39 0.33 — — — al. (1979a) Bruce et
Shapio Lake Tundra interfrost Labrador, Canada 54.97 -61.28 1977 26 402 — 9 0.08 1.75 0.45 — — — Bruce et al. (1979a) Tasialuk Tundra interfrost Labrador, Canada 56.74 -62.69 2007 10 430 777 — 0.08 0.17 0.13 0.02 0.13 0.13 Gantner et al. (2010) Coady's Pond Tundra interfrost Labrador, Canada 56.64 -63.63 2007 10 366 452 — 0.07 0.12 0.10 0.02 0.10 0.10 Gantner et al. (2010) Coady's Pond #2 Tundra interfrost Labrador, Canada 56.64 -63.63 2007 20 316 478 6 0.06 0.21 0.12 0.04 0.11 0.12 van der Velden et al. (2013a) Esker Lake Tundra interfrost Labrador, Canada 57.15 -62.88 2008 20 278 306 11 0.04 0.86 0.11 0.18 0.08 0.07 van der Velden et al. (2015) Hebron Lake #2 Tundra interfrost Labrador, Canada 57.97 -64.02 2008 25 357 — 12 — — 0.19 0.17 — van der Velden et al. (2015) Upper Nakvak Lake Tundra interfrost Labrador, Canada 58.66 -63.32 2007 20 287 360 12 0.03 0.49 0.13 0.12 0.08 0.07 van der Velden et al. (2015) Galggojavri Tundra interfrost Norway 69.35 21.06 2011 49 252 184 4 — — 0.12 0.01 — — Kahilainen et al. (2016) Tasiapik Lake Tundra interfrost Nunavik, Canada 58.52 -68.36 2009, 2010 31 296 659 6 0.06 0.26 0.11 0.05 0.10 0.10 van der Velden et al. (2013a) Lake Tjulträsk Tundra interfrost Sweden 65.97 16.07 1995, 1996 20 — — — — — — — 0.13 — AMAP (2005)
A
c
c
e
p
te
d
Preprint
This article is protected by copyright. All rights reserved Avanersuaq Tundra permafrost Greenland, Denmark 77.42 -66.36 1994, 1995 26 412 492 14 0.04 0.50 0.23 0.14 0.19 0.21 Rigét et al. (2000) Nuuk Tundra permafrost Greenland, Denmark 64.18 -51.70 1994, 1995 25 368 435 11 0.09 1.30 0.60 0.33 0.49 0.60 Rigét et al. (2000) Lake A (Qaqortoq) Tundra permafrost Greenland, Denmark 60.99 -47.51 1994, 1995 50 392 558 12 0.07 3.73 0.80 0.60 0.66 0.60 Rigét et al. (2000) Lake B (Qaqortoq) Tundra permafrost Greenland, Denmark 60.97 -47.56 1994, 1995 22 347 403 11 0.15 1.71 0.58 0.35 0.49 0.48 Rigét et al. (2000) Lake C (Qaqortoq) Tundra permafrost Greenland, Denmark 60.96 -47.53 1994, 1995 25 350 354 12 0.22 1.32 0.64 0.30 0.58 0.54 Rigét et al. (2000) Lake D Qqaqortoq) Tundra permafrost Greenland, Denmark 60.87 -47.58 1994, 1995 22 335 300 11 0.23 2.01 0.62 0.35 0.57 0.57 Rigét et al. (2000) Tasiilaq (Ammassalik) Lake Tundra permafrost Greenland, Denmark 65.61 -37.64 1994, 1995 4 478 1169 19 0.32 0.48 0.40 0.07 0.40 0.40 Rigét et al. (2000) Tasiilaq River Tundra permafrost Greenland, Denmark 65.61 -37.64 1994, 1995 21 235 — 11 0.05 0.19 0.12 0.16 0.26 — Rigét et al. (2000) unnamed lake (near fjord Isortoq) Tundra permafrost Greenland, Denmark 65.58 -51.90 2008 20 387 328 — 0.70 3.56 1.13 0.61 1.05 0.98 Rigét et al. (2010) Lake Fergusson Tundra permafrost Greenland, Denmark 66.97 -50.64 2005 27 373 486 9 0.03 0.39 0.18 0.09 0.15 0.18 Wathne et al. (1997) Pingualuk Tundra permafrost Nunavik, Canada 61.28 -73.66 2007 10 402 395 17 0.11 0.38 0.17 0.08 0.16 0.15 Gantner et al. (2010) Laflamme Tundra permafrost Nunavik, Canada 61.32 -73.71 2007 7 543 1669 13 0.10 0.24 0.14 0.04 0.14 0.14 Gantner et al. (2010) Second Portage Tundra permafrost Nunavut, Canada 65.01 -96.02 2008 15 354 — — — — 0.08 — — — CACAR (2012) Angajurjualuk Tundra permafrost Nunavut, Canada 71.12 -79.00 2006, 2007 28 408 — — — — 0.33 — — — CACAR (2012) Sheardown Tundra permafrost Nunavut, Canada 71.31 -79.31 2006, 2007 26 356 — — — — 0.16 — — — CACAR (2012) 9-Mile Tundra permafrost Nunavut, Canada 74.81 -95.20 2011, 2012 30 366 356 18 0.06 0.39 0.15 0.09 — 0.12 Barst et al. (2016) Amituk Tundra permafrost Nunavut, Canada 75.05 -93.75 2011, 2012 26 375 407 15 0.14 2.08 0.84 0.47 0.69 0.83 Barst et al. (2016) North Tundra permafrost Nunavut, Canada 74.78 -95.09 2011, 2012 28 393 439 17 0.09 0.70 0.26 0.15 0.22 0.21 Barst et al. (2016) Small Tundra permafrost Nunavut, Canada 74.76 -95.06 2011, 2012 30 358 274 14 0.04 0.19 0.10 0.04 — 0.09 Barst et al. (2016) Little Nauyuk Tundra permafrost Nunavut, Canada 68.35 -107.76 2006 10 363 327 12 0.07 0.22 0.13 0.05 0.12 0.12 Gantner et al. (2010)
A
c
c
e
p
te
d
Preprint
This article is protected by copyright. All rights reserved Radar Tundra permafrost Nunavut, Canada 68.44 -66.86 1999 8 453 860 — 0.23 1.92 0.99 0.61 0.81 0.91 Gantner et al. (2010) 12 Mile Tundra permafrost Nunavut, Canada 74.82 -95.34 2006 10 351 515 17 0.10 0.20 0.14 0.04 0.13 0.14 Gantner et al. (2010) Aqiatusuk Tundra permafrost Nunavut, Canada 74.70 -94.23 2011, 2016 15 481 1003 18 0.16 1.03 0.56 0.28 0.49 0.59 This study Boomerang Tundra permafrost Nunavut, Canada 73.94 -92.89 2007, 2012 23 455 560 19 0.09 0.54 0.24 0.14 0.20 0.16 This study, Gantner et al. (2010) Hazen Tundra permafrost Nunavut, Canada 81.83 -70.42 2006 10 346 337 19 0.04 0.29 0.10 0.08 0.08 0.07 Gantner et al. (2010) Lake D Tundra permafrost Nunavut, Canada 82.11 -67.48 2007 7 349 498 19 0.04 0.26 0.11 0.09 0.08 0.07 Gantner et al. (2010) Lake F Tundra permafrost Nunavut, Canada 81.81 -69.35 2007 8 275 344 15 0.07 0.67 0.17 0.20 0.13 0.12 Gantner et al. (2010) Lake G Tundra permafrost Nunavut, Canada 81.82 -69.18 2007 10 299 184 20 0.15 0.26 0.19 0.05 0.19 0.18 Gantner et al. (2010) Char Lake Tundra permafrost Nunavut, Canada 74.71 -94.88 2010, 2011 13 332 278 10 0.15 0.48 0.32 0.11 0.30 0.34 Lescord et al. (2015) Meretta Lake Tundra permafrost Nunavut, Canada 74.68 -94.92 2010, 2011 30 397 563 5 0.11 0.36 0.19 0.06 0.18 0.17 Lescord et al. (2015) Resolute Tundra permafrost Nunavut, Canada 74.69 -94.95 2010, 2011 30 421 609 18 0.06 0.33 0.17 0.07 0.16 0.16 Lescord et al. (2015) Kangiqsujuaq Tundra permafrost Nunavut,
Canada 61.60 -71.96 1998 7 500 — — — — 0.14 — — — Lescord et al. (2015)
Sapphire Tundra permafrost Nunavut, Canada 75.36 -89.49 2001 9 448 606 23 0.16 1.07 0.45 0.29 0.39 0.36 Muir et al. (2005b) Hovaktok Tundra permafrost Nunavut, Canada 68.05 -107.20 2006-2008 7 468 1581 11 0.02 0.08 0.04 0.02 0.04 0.05 Swanson and Kidd (2010) Nauyuk Tundra permafrost Nunavut, Canada 68.38 -107.68 2006-2008 18 274 575 6 0.02 0.16 0.06 0.04 0.05 0.04 Swanson and Kidd (2010) Roberts Tundra permafrost Nunavut, Canada 68.16 -106.52 2006-2008 34 237 210 4 0.01 0.04 0.01 0.01 0.01 0.01 Swanson and Kidd (2010) Gavia Faeces Tundra permafrost Nunavut, Canada 68.34 -107.73 2006 8 289 211 12 0.05 0.51 0.17 0.18 0.11 0.08 Swanson et al. (2011b) Keyhole Tundra permafrost Nunavut, Canada 69.38 -106.24 2006 7 449 1167 9 0.03 0.27 0.13 0.10 0.09 0.10 Swanson et al. (2011b) Notgordie Tundra permafrost Nunavut, Canada 68.35 -107.66 2006 5 464 1134 9 0.15 0.34 0.24 0.90 0.23 0.19 Swanson et al. (2011b)
A
c
c
e
p
te
d
Preprint
This article is protected by copyright. All rights reserved Heintzelman Tundra permafrost Nunavut, Canada 81.70 -66.93 2001 119 216 101 12 0.03 0.32 0.11 0.05 0.10 0.11 van der Velden et al. (2012) Crazy Lake Tundra permafrost Nunavut, Canada 63.87 -68.47 2010 47 185 — 7 — — 0.11 0.16 — 0.06 van der Velden et al. (2013a) Iqalugaarjuit Lake Tundra permafrost Nunavut, Canada 66.57 -66.71 2004 20 185 65 6 0.07 0.30 0.12 0.05 0.11 0.11 van der Velden et al. (2013a) Unnamed Lake Tundra permafrost Nunavut, Canada 72.59 -77.97 2010 18 254 304 10 0.08 0.42 0.23 0.11 0.20 0.19 van der Velden et al. (2013a) Herbert Tundra permafrost Yukon, Canada 69.42 -139.63 1999 8 328 206 — 0.21 2.34 0.69 0.74 0.48 0.35 Gantner et al. (2010) West Lake Tundra permafrost Nunavut, Canada 74.89 -109.60 2008, 2009 26 410 448 — 0.05 0.44 0.17 0.09 0.15 0.16 This study East Lake Tundra permafrost Nunavut, Canada 74.89 -109.54 2008, 2009 17 406 327 — 0.05 0.29 0.11 0.06 0.10 0.10 This study Arresjøen Tundra permafrost Svalbard, Norway 79.67 10.80 1996, 1997 25 336 442 16 0.04 0.44 0.18 0.11 — 0.12 Rognerud et al. (2002) Lake 10 Tundra permafrost Nunavut, Canada 68.14 -106.40 2006-2008 7 398 724 9 0.03 0.08 0.05 0.02 0.05 0.05 This study Lake 32 Tundra permafrost Nunavut, Canada 68.15 -106.52 2006-2008 12 338 375 11 0.02 0.23 0.09 0.05 0.08 0.08 This study
A
c
c
e
p
te
d
Preprint
This article is protected by copyright. All rights reserved
A
c
c
e
p
te
d
Preprint
This article is protected by copyright. All rights reserved
A
c
c
e
p
te
d
Preprint
This article is protected by copyright. All rights reserved
A
c
c
e
p
te
d
Preprint
This article is protected by copyright. All rights reserved