Dépistage précoce du diabète gestationnel
par
Masoud Mahdavian
Programmes de sciences cliniques
Mémoire présenté à la Faculté de médecine et des sciences de la santé en vue de l’obtention du grade de maître ès sciences (M.Sc.)
en sciences cliniques
Sherbrooke, Québec, Canada Juin 2015
Membres du jury d’évaluation
Jean-Luc Ardilouze, M.D., Ph.D., Département de médecine, Université de Sherbrooke Jean-Patrice Baillargeon, M.D., M. Sc., Département de médecine, Université de Sherbrooke
S. John Weisnagel, M.D., Département sciences des aliments, Faculté des sciences de l’agriculture et de l’alimentation, Université Laval
Early Screening of Gestational Diabetes Mellitus
by
Masoud Mahdavian Clinical Sciences Program
Thesis presented at the Faculty of Medicine and Health Sciences for the obtention of Master degree diploma (M.Sc.) in Clinical Sciences
Sherbrooke, Québec, Canada June 2015
Members of the evaluation committee:
Jean-Luc Ardilouze, M.D., Ph.D., Department of Medicine, University of Sherbrooke Jean-Patrice BaillargeonM.D., M. Sc., Department of Medicine, University of Sherbrooke
S. John Weisnagel, M.D., Department of Food Science and Nutrition, Laval University
RÉSUMÉ
Dépistage précoce du diabète gestationnel par
Masoud Mahdavian
Programmes de sciences cliniques
Mémoire présenté à la Faculté de médecine et des sciences de la santé en vue de l’obtention du diplôme de maitre ès sciences (M.Sc.) en sciences cliniques, Faculté de médecine et des sciences
de la santé, Université de Sherbrooke, Sherbrooke, Québec, Canada, J1H 5N4
L’aggravation de certaines caractéristiques cliniques des femmes enceintes (âge, poids) et l’augmentation de la prévalence du diabète gestationnel (DG) poussent à dépister le DG le plus tôt possible pour éviter chez la mère et le fœtus les complications à court et à long terme. Le dépistage du DG est recommandé à 24-28 semaines de grossesse, et le plus souvent un test de tolérance à 50g de glucose (TTG) est réalisé. Pour les femmes qui ont des facteurs de risque, ce test doit être effectué plus précocement, habituellement pendant le premier trimestre de la grossesse. Cette dernière recommandation est peu suivie, d’autant qu’il n’y a pas de consensus international sur le dépistage du DG pendant le premier trimestre de la grossesse.
Objectifs. 1) Définir au premier trimestre de la grossesse la valeur de la glycémie du TTG qui
prédit le diagnostic de DG à 24-28 semaines avec une sensibilité et une spécificité optimales à
l’aide d’une courbe ROC. 2) Déterminer si la glycémie du TTG au premier trimestre est un facteur prédictif indépendant du DG.
Méthodes. Étude prospective de cohorte. Les facteurs d'inclusion étaient : âge ≥ 18 ans et âge gestationnel entre 6 et 13 semaines après la dernière menstruation. Les TTG ont été effectués à la première visite prénatale. Une deuxième visite était programmée à 24-28 semaines pour faire une hyperglycémie provoquée par voie orale (HGPO) et donc un éventuel diagnostic de DG. Les critères utilisés pour ce diagnostic étaient ceux de l’Association américaine du diabète.
Résultats. Les TTG ont été faits à 9,1±2,0 semaines et les HGPO à 26.5±1.1semaines chez 1180 femmes (28,2±4,4 ans, IMC : 25,2±5,5 kg/m2). Un DG a été diagnostiqué chez 100 (8,4%)
participantes. La valeur de glycémie du TTG à 5,6 mmol/L a prédit le DG avec une sensibilité de 84,1% et une spécificité de 62,3%, tandis que la valeur prédictive positive était de 0,121 et la valeur prédictive négative de 0,985. Cette valeur de 5,6 était indépendamment associée au DG (OR=2,806, IC 95%: 1,98 à 3,97, p <0,001). Comparé à d'autres facteurs de risque, le TTG était le plus puissant prédicteur indépendant du DG (OR=1,767, IC 95%: 1,52 à 2,05, p <0,001).
Conclusions. Au premier trimestre, la valeur glycémie de 5.6 mmol/L du TTG prédit avec une bonne sensibilité et spécificité l’apparition d’un DG à 24-28 semaines. La glycémie du TTG au premier trimestre est le plus puissant prédicteur indépendant de DG.
SUMMARY
Early Screening of Gestational Diabetes Mellitus by
Masoud Mahdavian Clinical Sciences Program
Thesis presented at the Faculty of Medicine and Health Sciences for the obtention of Master degree diploma [maitre ès sciences] (M.Sc.) in Clinical Sciences, Faculty of medicine and health
sciences, Université de Sherbrooke, Sherbrooke, Québec, Canada, J1H 5N4
The changes in clinical characteristics of pregnant women and an increase in the prevalence of gestational diabetes mellitus (GDM) warrant the importance of screening as early as possible in order to possibly prevent short and long-term complications in both the mother and fetus. GDM screening is recommended at 24-28 weeks of pregnancy, using a 50g glucose challenge test (GCT) although women with multiple risk factors are expected to be assessed “early” in pregnancy, a recommendation poorly followed. Most importantly, there is no universal agreement currently in place for GDM screening, particularly during the first trimester of pregnancy.
Objectives. 1) To define the cut-off value of GCT during the first trimester in order to predict GDM diagnosed at 24-28 weeks of gestation with optimal sensitivity and specificity using ROC curve. 2) To determine if GCT during the first trimester of pregnancy is an independent predictor of GDM diagnosed at 24-28 weeks gestation.
Methods. This is a prospective cohort study. Women were recruited at their first prenatal visit. Inclusion factors were: age ≥ 18 years and gestational age between 6 and 13 weeks from their last menstrual period. GCT were performed at the first prenatal visit. The second visit was scheduled at 24-28 weeks for the diagnostic 75g oral glucose tolerance test (OGTT). GDM diagnosis was made in accordance with the American Diabetes Association guidelines. A variety of statistical analysis including multivariate logistic regression models and ROC curve were used to address the aims of the study.
Results. Participants (n=1180, age: 28.2±4.4 years, BMI: 25.2±5.5 kg/m2) underwent GCT at 9.1±2.0 weeks and OGTT at 26.5±1.1 weeks of gestation. GDM was diagnosed in 100 (8.4%) women. The cut-off value of 5.6 mmol/L predicted GDM with 84.1% (75.4-92.7) sensitivity, 62.3% (59.5-65.1) specificity, while the positive predictive value was 0.121 (0.091-0.150) and the negative predictive value was 0.985 (0.975-0.994). This 5.6 value was independently associated with GDM (OR=2.806, 95% CI: 1.98-3.97, p<0.001). Compared to other risk factors, GCT was the strongest independent predictor of GDM (OR=1.767, 95% CI: 1.52-2.05, p<0.001).
Conclusions. The cut-off value of 5.6 mmol/L has the optimal sensitivity and specificity for the GCT during the first trimester to predict GDM at 24-28 weeks of gestation according to ADA guidelines. GCT during the first trimester is the strongest independent predictor of GDM at 24-28 weeks of gestation.
TABLE OF CONTENT
RÉSUMÉ III
SUMMARY IV
TABLE OF CONTENT V
LIST OF FIGURES VI
LIST OF TABLES VII
LIST OF ABBREVIATIONS VIII
INTRODUCTION 1
1.1 Definition and Epidemiology 1
1.2 GDM Risk Factors 2
1.3 GDM Complications 3
1.4 Screening test 5
1.5 Diagnostic test 5
1.6 Sensitivity and Specificity 5
1.7 Positive and Negative Predictive values, likelihood ratio 6
1.8 ROC Courve 7
1.9 Current ADA and CDA Screening and Diagnosis Recommendations 7
1.10 Why Early Screening? 8
1.11 Review of Previous Published Articles Related to Early Screening 10
HYPOTHESIS 13 OBJECTIVES 14 3.1 Objective No. 1 14 3.2 Objective No. 2 14 ARTICLE 1 15 DISCUSSION 38
Strengths and limits 42
Future and Perspectives 44
THANKS 46
REFERENCES 47
LIST OF FIGURES
Figure 1 Course of the study………. ……...…23 Figure 2 ROC curve of the GCT plasma glucose……….……….….26
LIST OF TABLES
Table 1 Threshold values for the screening and diagnosis of GDM by ADA and CDA…….…..8 Table 2 Demographic and clinical variables of pregnant women…...………24 Table 3 Predictive values of the GCT PG of 5.6 mmol/L for GDM diagnosis according
to ADA criteria……....…….……….………..27 Table 4 Independent predictors significantly associated with GDM diagnosis according
LIST OF ABBREVIATIONS
A1c Glycated hemoglobinACHOIS Australasian Carbohydrate Intolerance in Pregnancy Study ADA American Diabetes Association
AUROC Area Under ROC Curve
BMI Body mass index
BSP Blood Sampling in Pregnancy Clinic CDA Canadian Diabetes Association
CHUS Centre Hospitalier Universitaire de Sherbrooke GCT 50 grams Glucose Challenge Test
GDM Gestational Diabetes Mellitus
HAPO Hyperglycemia and Adverse Pregnancy Outcome Study
IADPSG International Association of Diabetes and Pregnancy Study Groups LGA Large for gestational age
LR Likelihood Ratio
MIF Macrophage Migratory Inhibitory Factor NPV Negative Predictive Value
OGTT Oral Glucose Tolerance Test
PG Plasma glucose
PPV Positive Predictive value
RFs Risk factors
ROC Receiver Operating Characteristic SGA Small for gestational age
SHBG Sex Hormone Binding Globulin T2D Type 2 diabetes
TGF-β Transforming Growth Factor- beta V1 First Visit at 6-13-week gestation V2 Second Visit at 24-28-week gestation WHO World Health Organization
1.1 Definition and Epidemiology
Pregnancy is characterized by a progressive increase in nutrient-stimulated insulin responses despite an only minor deterioration in glucose tolerance, consistent with progressive insulin resistance (Butte, 2000). Gestational diabetes mellitus (GDM) is a condition in women who have glucose intolerance with onset or first recognition during pregnancy (Canadian Diabetes Association Clinical Practice Guidelines Expert Committee, 2013, Metzger and Coustan, 1998).
The prevalence of GDM is estimated between 2% and 18% depending upon the population studied and the diagnostic tests employed (Kim et al., 2002). We participated in this debate. In a cohort of 459 pregnant women recruited prospectively, we showed that the prevalence of GDM (diagnosed with 75g oral glucose tolerance test – OGTT - in a one-step universal procedure) is multiplied 3.6 fold (Mahdavian et al., 2010) when the International Association of Diabetes in Pregnancy Study Group (IADPSG) cut-off values vs. those recommended in 2010 by the American Diabetes Association (ADA) were used (American Diabetes Association, 2010, IADPSG consensus panel, 2010). In addition to the cut-off values questioning, several parameters influence the detection of GDM by affecting sensitivity and specificity of GCT and OGTT such as sample handling and processing times, and diurnal variations in the tests results (Ardilouze, Mahdavian et al., 2012). All these factors should be considered in the interpretation of tests. Nonetheless, regardless of different diagnostic methods or cut-off values, GDM prevalence has doubled over the past 10 years in all ethnic populations and this seems to be related mainly to increasing weight gain (Dabelea et al., 2005, Ferrara et al., 2004). Although Caucasian women have the lowest GDM risk, one study reported a 12.3% prevalence of GDM in 3,950 Italian women and an absolute 5.6% prevalence in women with low risk for GDM (Di Cianni et al., 2003). Another study performed in the UK (Cosson et al., 2006)found a 13% prevalence using universal screening versus 8% using a risk-factor approach.
Recognition of diabetes for the first time during pregnancy corresponds to both unrecognized pre-gestational diabetes and any overt glucose intolerance occurring during this pregnancy. Pathogenesis of GDM is multifactorial; however, it is not completely clear. Both relative
diminished insulin sensitivity causing insulin resistance and β cell dysfunction causing reduced insulin release have been proposed (Singh et al., 2015, Al-Noaemi and Shalayel, 2013). These changes are affected by multiple factors including but not limited to Human Placental Lactogen secretion, expression of sex hormone binding globulin (SHBG), cytokine release such as MIF, TGF- β (Singh et al., 2015, Li et al., 2015, Marcantoni et al., 2015). GDM may also occur in women with a background of chronic insulin resistance to which the insulin resistance of pregnancy is partially additive. Sequential measurements of insulin sensitivity performed in the same women before pregnancy, early in the second trimester and in the third trimester have documented insulin resistance in both lean and obese women who eventually develop GDM (Catalano et al., 1999 and Catalano et al., 1993).Changes in carbohydrate homeostasis have been described as early as at six weeks’ gestation and, consequently, some women with early onset of GDM could have pregnancy-induced glucose intolerance (Freinkel, 1980). These findings partially explain why GDM develops not only in overweight or obese women but also in lean women, which suggests that normal weight women should be screened for GDM, hypothetical procedure which went against many recommendations at the time we initiated the present study, in particular those of the ADA (see below).
1.2 GDM Risk Factors
Several risk factors (RFs) have been described for GDM. Until recently the ADA would state that women with all of the following characteristics were at low risk for GDM development: age < 25 years, normal body weight before pregnancy, Caucasian, no known diabetes in a first degree relative, no history of abnormal glucose intolerance and no history of abnormal obstetrical outcome (American Diabetes Association, 2009). However, the more recent 2014 ADA guidelines recommend that the RFs for type 2 diabetes (T2D) should be considered for GDM screening (American Diabetes Association, 2014).
Age ≥ 35 years, body mass index (BMI) ≥ 30 kg/m2, ethnicity, polycystic ovary syndrome, previous GDM, history of macrosomic infant or current fetal macrosomia or polyhydramnios, acanthosis nigricans and corticosteroid use have been considered as GDM
RFs by the Canadian Diabetes Association (CDA) (Canadian Diabetes Association Clinical Practice Guidelines Expert Committee, 2013).
1.3 GDM Complications
GDM carries short and long-term health risks for both the fetus and the mother. Short-term fetal complications include death in utero, prematurity, large (LGA) or small (SGA) for gestational age neonates, macrosomia, dystocia, admission to neonatal nursery and intensive care units, hypoglycemia, hypocalcaemia, convulsions and hyperbilirubinemia (Metzger and Coustan, 1998, Coustan, 2010). The short-term complications for the mother include preeclampsia, antenatal admission, hydramnios, induced labor and caesarean section (Metzger and Coustan, 1998). In addition, GDM is a forerunner of T2D (Kim et al., 2002). It was shown in the Diabetes Prevention Program Study in 3,234 pre-diabetic subjects, that a history of GDM increases by 74% the risk of developing T2D (Knowler et al., 2002).
The focus of the impact of GDM on offspring has now shifted from the prevention and care of perinatal morbidity to the long-term prevention of metabolic diseases.GDM, as maternal BMI, is a risk factor contributing to the worldwide epidemics of obesity and T2D in childhood ‒ and adulthood (Dabelea et al., 2000, Dabelea and Pettitt, 2001) ‒ although these epidemics are still not completely understood. Thus, prevention is the key. However, it requires thorough comprehensive screening strategies.
Furthermore, the level of hyperglycemia and the time of screening/diagnosis matter. Women with GDM diagnosed early in pregnancy are more hyperglycemic and at higher risk for obstetrical and neonatal complications during the current pregnancy and for recurrent GDM in future pregnancies (Ben-Haroush et al., 2004, Berkowitz et al., 1992).The Hyperglycemia and Adverse Pregnancy Outcome (HAPO) Study showed in 23,325 women (age: 29.2±5.8, BMI 27.7±5.1 kg/m2) that the relationship between maternal glycaemia and fetal hyperinsulinemia, LGA, cesarean-section rate and neonatal hypoglycemia, adverse maternal and fetal outcomes is a continuum (The HAPO Study Cooperative Research Group, 2008).
Interestingly, the most frequent short-term complications are preventable in neonates, even with moderately hyperglycemic mothers, as shown by the Australasian Carbohydrate Intolerance in Pregnancy Study (ACHOIS) (Crowther et al., 2005).In this study, performed in women with glucose intolerance diagnosed during pregnancy (subjects with pre-gestational diabetes were excluded), the number to treat was 34 to avoid 1 serious perinatal complication, 11 and only 9 to avoid LGA and macrosomia, respectively in the neonate (Crowther et al., 2005).This study demonstrated the clinical validity of screening for GDM. However, the impact of universal “early” screening remains to be demonstrated.
Data from several studies suggest that exposure of the fetus to the mother’s GDM environment confers a risk for T2D and obesity during childhood and adolescence that overrides any genetically transmitted susceptibility. Maternal antenatal glycaemia is related to the long-term risk of obesity, metabolic syndrome, abnormal levels of inflammatory and coagulation markers, and diabetes in the offspring (Boney et al., 2005, Dabelea et al., 2000a, Dabelea et al., 2000b Dabelea and Pettitt, 2001).
The concept of ‘metabolic programming’ (Ismail-Beigi et al., 2006)was first illustrated in Pima Indians (Dabelea et al., 2000b)and thereafter in offspring of GDM women in the USA (Boney et al., 2005, Metzger, 2007),Canada (Keely et al., 2007),and Denmark (Clausen et al., 2007).However, these cross-sectional studies failed to control for maternal disease history and genetic background since heredity is a major epidemiologic risk factor for type 2 diabetes. Exclusion of confounding genetic factors is a key element to establish the role of GDM as an independent marker of cardio-metabolic risk in GDM offspring. Our team is carrying out a study that aims to demonstrate in children that metabolic syndrome and cardio-metabolic markers are more frequent in offspring of GDM mothers than in their siblings born from non-GDM pregnancies.
In addition, the exact effects of GDM and maternal obesity remain to be established (Gillman et al., 2003, Schaefer-Graf et al., 2005).Compounding this worrisome future is a suggestion that treatment of GDM decreases the prevalence of obesity in 5-7 year-old offspring (Hillier
et al., 2007).This data, taken together with the “Programming hypothesis,” points to early screening and treatment of GDM.
1.4 Screening test
Many women with GDM are asymptomatic; however, GDM has a significant impact on them and their offspring (The HAPO Study Cooperative Research Group, 2008). Most of these short and long-term complications are preventable (Crowther et al., 2005, Hillier et al., 2007). Screening test is used to determine individual who may have a disease in apprently healthy and asymptomatic people. In addition, a screening test requires to be done when it can fulfil Wilson’s criteria (Wilson and Jungner, 1968), and these criteria must be attained: 1) early screening, 2) in asymptomatic people, 3) validity and reliability, 4) affordable costs, 5) acceptance, and 6) follow-up services. A screening test does not establish a diagnosis. The major benefit of a screening test is to identify an asymptomatic person at risk for the disease to reduce the mortality and morbidity of the disease of interest.
1.5 Diagnostic test
A positive screening test is usually followed by a diagnostic (confirmatory) test to verify a definitive diagnosis (Kanchanaraksa & Diener-West, 2008). A diagnstic test is used to verify the presence or absence of a disease when a person has signs or symptoms of the disease of interest (Kanchanaraksa & Diener-West, 2008). The best available test to determine a person has the disease of interest is considered as the “Gold Standard test”. Validity and reliabity of other tests are compared to the gold standard test to diagnose the disease of interest (Kanchanaraksa & Diener-West, 2008).
1.6 Sensitivity and Specificity
Sensitivity and specificity are two indices of validity of a test when the outcome and the exposure are categorical variable (Szklo and Nieto, 2014). An ideal screening test should have both high sensitivity and high specificity (Bonita et al., 2006). Sensitivity of a test is the ability of a test to determine accurately people who have the disease of interest. Specificity of a test is the ability of a test to determine accurately people who do not have the
disease of interest (Szklo and Nieto, 2014). A more sensitive test usualy is initially the first step to detect more possible cases; however, it will increase the number of false positive cases. Therefore, it is followed by a more specific (diagnostic or confirmatory) test. A sequential screening (two step) will increase net gain in specificity of the screening (Kanchanaraksa & Diener-West, 2008). Sensitivity and specificity of the test are not dependent on the disease prevalence.
1.7 Positive and Negative Predictive values, likelihood ratio
To interpret a test result, healthcare providers need to know about the positive and negative predictive values. A positive predictive value (PPV) is the proportion of true positive among people who have a positive test result. A negative predictive value (NPV) is the proportion of true negative results among people who have a negative test result. PPV and NPV are affected by the prevalence of the disease in the population that is being tested. If the prevalence of a disease is high, it is more possible that the person with a positive test has a true positive result. Healthcare providers also need to know the positive and negative likelihood ratios (LRs) which are also used to assess the value of a positive or negative diagnostic test (Szklo and Nieto, 2014). A positive LR gives us the probability of a positive finding in a patient with the disease of interest compare to the probability of the same finding in a subject without the disease of interest (McGee, 2002).
Disease + Disease - Total
Positive test result a (True Positive) b a + b Negative test result C d (True Negative) c + d
Total a + c b + d a + b + c + d
Sensitivity= a / (a + c) Specificity= d / (b + d) PPV= a / (a + b) NPV= d / (c + d)
𝑃𝑜𝑠𝑖𝑡𝑖𝑣𝑒 𝐿𝑖𝑘𝑒𝑙𝑖ℎ𝑜𝑜𝑑 𝑟𝑎𝑡𝑖𝑜𝑛 = 𝑃𝑟𝑜𝑏𝑎𝑏𝑖𝑙𝑖𝑡𝑦 𝑜𝑓 𝑡ℎ𝑒 𝑓𝑖𝑛𝑑𝑖𝑛𝑔 𝑖𝑛 𝑎 𝑝𝑎𝑡𝑖𝑒𝑛𝑡 𝑤𝑖𝑡ℎ 𝑑𝑖𝑠𝑒𝑎𝑠𝑒 𝑜𝑓 𝑖𝑛𝑡𝑒𝑟𝑒𝑠𝑡 Probability of the finding in a subject without the disease of interest
1.8 ROC Curve
If the test results are reported as ordinary or continuous scale, the different cutoff (threshold) values affect the sensitivity and specificity of the test, and specificity is inversly related with sensitivity (Hajian-Tilaki, 2013). Receiver operating characteristic (ROC) curve is the plot of sensitivity versus 1-specificity. The area under the ROC curve (AUROC) is the measure of the accuracy of the test (Hanley and McNeil, 1982, Hajian-Tilaki, 2013). This curve has a pivotal role in the assessment of a diagnostic test to determine the optimal cutoff value (Hajian-Tilaki, 2013). This type of analysis has been used in many clinical studies to assess the diagnostic ability of the tests (biomarkers and imaging studies) to differentiate population with the disease from healthy ones (Hajian-Tilaki, 2013). Furthermore, it is commonly used to predict the risk of an adverse event (Hajian-Tilaki, 2013).
1.9 Current ADA and CDA Screening and Diagnosis Recommendations
The ADA recommends that pregnant women with RFs for T2D should be screened for previously unrecognized T2D during the first prenatal visit. Otherwise, GDM screening should be undertaken on pregnant women who do not have a history of diabetes at 24-28 weeks of gestation (American Diabetes Association, 2014). The CDA recommends a universal screening for GDM at 24-28 weeks of gestation. However, women with multiple RFs should be screened during the first trimester (Canadian Diabetes Association Clinical Practice Guidelines Expert Committee, 2013).
Both the ADA and CDA guidelines currently recommend the one-step or two-step approaches. In the one-step approach, there is no requirement for a 50g glucose challenge test (GCT) and pregnant women directly undergo a 75g oral glucose tolerance test (OGTT). The 75g-OGTT results are interpreted according to the IADPSG guidelines with GDM diagnosed if any plasma glucose (PG) value exceeds the thresholds presented in Table 1 (IADPSG Consensus Panel, 2010).
In the two-step approach, pregnant women are initially tested with a GCT. If the GCT plasma glucose (PG) value is above the threshold (≥ 7.8 mmol/L), women will proceed to a 75g-OGTT (CDA preferred approach and NIH consensus of the ADA [NDDG]) or a 100g-75g-OGTT
(NIH consensus of the ADA [Carpenter/Coustan]). The PG results of the second step are interpreted according to thresholds presented in Table 1. According to ADA, GDM diagnosis is made when at least two of the four 100g-OGTT PG values exceed thresholds shown in Table 1 (American Diabetes Association, 2014). However, according to CDA, GDM is diagnosed if one 75g-OGTT PG value meets or exceeds the recommended threshold (Canadian Diabetes Association Clinical Practice Guidelines Expert Committee, 2013).
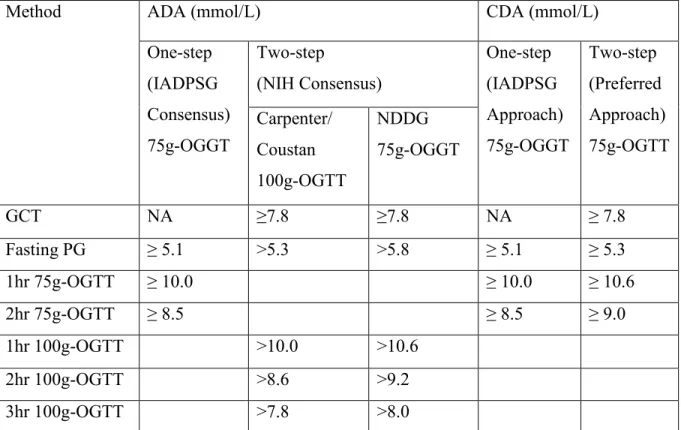
Table 1. Threshold values for the screening and diagnosis of GDM by ADA and CDA.
Method ADA (mmol/L) CDA (mmol/L)
One-step (IADPSG Consensus) 75g-OGGT Two-step (NIH Consensus) One-step (IADPSG Approach) 75g-OGGT Two-step (Preferred Approach) 75g-OGTT Carpenter/ Coustan 100g-OGTT NDDG 75g-OGGT GCT NA ≥7.8 ≥7.8 NA ≥ 7.8 Fasting PG ≥ 5.1 >5.3 >5.8 ≥ 5.1 ≥ 5.3 1hr 75g-OGTT ≥ 10.0 ≥ 10.0 ≥ 10.6 2hr 75g-OGTT ≥ 8.5 ≥ 8.5 ≥ 9.0 1hr 100g-OGTT >10.0 >10.6 2hr 100g-OGTT >8.6 >9.2 3hr 100g-OGTT >7.8 >8.0
ADA: American Diabetes Association 2014, CDA: Canadian Diabetes Association 2013, NDDG: National Diabetes Data Group, IADPSG: International Association of Diabetes and Pregnancy Study Groups, NA: Not applicable and GCT is not necessary in this approach.
1.10 Why Early Screening?
Although there are still controversies surrounding the screening and consequences of GDM (Sermer, 2003, Wen et al., 2000, Ouzilleau et al., 2003, Brody et al., 2003),there is a general agreement that screening should be performed as soon as possible in at-risk women (American Diabetes Association, 2014, Canadian Diabetes Association Clinical Practice Guidelines Expert Committee, 2013).
Nowadays, universal early GDM screening sounds crucial; the reason could be simply because it is recommended by most diabetes professional associations in a large part of the population since aging and overweight are RFs. The common assumption that “the earlier the treatment, the better the outcomes” is another reason, although weaker. However, several strong lines of evidence reinforce the universal early screening policy hypothesis.
First, clinical characteristics of pregnant women have changed (Ferrara et al., 2004).Over the last decades, RFs for insulin resistance have increased rapidly in the population of childbearing women. The percentage of overweight and obese women of childbearing age has increased tremendously, reaching a whopping 43% in Canada (Tjepkema, 2006, Shields et al., 2011).This weight gain causes a parallel increase in insulin resistance, a condition contributing to GDM (Kauffman et al., 2006).Moreover, pregnancy is occurring at an older age (Ferrara et al., 2004) and age is another well-known risk factor for GDM (Ben-Haroush et al., 2004).Both of these trends (weight gain and aging) increase the risk and precocity of the GDM onset and underline the importance of early screening.
Second, the proportion of women with undiagnosed T2D is also on the rise in the North American population (Casson et al., 2006).It was also reported that T2D represents 27.3% of pre-gestational diabetes in a United Kingdom population including, indeed, a large ethnic (Pakistanis and South India) proportion (Casson, 2006).
Third, early-onset GDM is a serious condition. Women with early-onset GDM are more likely to be hypertensive, to have higher glycemic values, and to need insulin therapy than those in whom diabetes develops later (Bartha et al., 2000, Svare et al., 2001).In one Spanish study, all cases of neonatal hypoglycemia and perinatal death occurred within the early-onset group (Bartha et al., 2000).
Fourth, testing in early pregnancy potentially allows for earlier and more efficient intervention (diet, exercise and pharmacotherapies). One explanation to the current controversy surrounding the benefits of GDM screening and treatment might be that
screening at 24-28 weeks of gestation is too late. Nonetheless, it has been demonstrated that treatment of GDM is effective in reducing short-term (Crowther et al., 2005)and long-term complications (Hillier et al., 2007). Taken together, the above-mentioned evidence provides strong justification for early screening.
1.11 Review of Previous Published Articles Related to Early Screening We found six papers focusing on early GDM screening.
1) In 1986, Benjamin et al.performed GCTs during the first trimester (weeks 6 to 13) and a 100g-OGTT (American Diabetes Association standards) during the second(weeks 14 to 26) and thirdtrimesters (weeks 27 to term) in a small cohort of 101 high-risk women aged 26.4±6 years, classified obese although BMI and weight were not specified. The thirdtrimester 100g-OGTT was the diagnostic test. With a 7.7 mmol/L threshold, the sensitivity and specificity of the GCT were 88% and 73%, respectively, using the thirdtrimester 100g-OGTT results for the GDM diagnosis. However, the GCT sensitivity was only 25% when GDM women were discovered by a positive 100-OGTT during the secondtrimester. Similar issues were found when the GCT threshold was > 8.25 mmol/L. Therefore, authors concluded that guidelines for GDM screening should include follow-up with a thirdtrimester OGTT on all patients who test positive at screening, even in the presence of normal second trimester OGTT, and that OGTT should be deferred until the early thirdtrimester (Benjamin et al., 1986). However, because the number of events (8) was very low, one ponders the validity and conclusions of this pioneering study.
2) Nahum and Huffaker (1990) performed GCT in first and in early third trimesters in a small cohort of 124 American women described as white (61%) and non-white, normal weight (47%) and obese. They found a correlation (r=0.54, P= 0.000001) between the firsttrimester and the thirdtrimester (28-32 weeks) GCTs. The correlation was stronger among white people (r= 0.67, P= 0.000001). A 100g-OGTT was performed in subjects with 1h post GCT ≥ 7.4 mmol/L. Nine (7%) were found to have GDM during the thirdtrimester. No one was diagnosed with GDM among white women with first trimester GCT value < 6.1mmol/L. They recommended there is no yield from a third trimester GCT when the first trimester GCT is less than 6.1 mmol/L (NPV= 91%). In addition, when the first trimester GCT is > 7.8
mmol/L, it has a high predictive value (PPV= 91%) for an abnormal third trimester GCT which requires a subsequent OGTT (Nahum and Huffaker, 1990). Again, the limited number of events and the heterogeneity of the sample bring into question the validity of these findings.
3) Nahum et al.(2002) again found a correlation between the GCT results at the end of the firsttrimester and at week 28 in 255 (out of 439 enrolled) normal-weight pregnant women aged 27.6±6.2 years (BMI: 23.9±5.2 kg/m2) except in 37 Pacific Islanders with a BMI 28.9±6.8 kg/m2 who had the lowest mean PG post GCT at 5.6±1.5 mmol/L. In subjects with 1-h post GCT ≥ 7.4 mmol/L, a 100g-OGTT diagnostic test was performed. GDM was diagnosed in 10% of subjects (only 25 women). Patients with first GCT PG ≥ 7.5 mmol/L had a positive predictive value showing a 55% risk of developing diabetes during pregnancy, while the risk was 0.6% in patients with values ≤ 6.1 mmol/L (Nahum et al., 2002). However, a plasma hexokinase glucose determination was used during the secondtrimester GCT, whereas capillary whole-blood reflectance glucometer was used at 28 weeks.
4) Bhattacharya et al. (2002) studied an Indian population (n=458) of non-diabetic women [100g-OGTT early in the first trimester, Coustan’s criteria (Coustan et al., 1989)] with BMI < 25 kg/m2. The 100g-OGTT diagnostic test was performed in only 133 women with GCT ≥ 7.8 mmol/L at third trimester. GDM was found in 38 women (8.3% of the cohort). When the first trimester GCT PG was under 5.5 mmol/L, no subject tested positive for GDM during the third trimester OGTT. When the first trimester GCT glucose was ≥ 7.8 mmol/L (n=18), 72% (n=13) cases tested positive for GDM. The GCT during the first trimester was predictive (correlation coefficients= 0.38) of the early third trimester OGTT result (substantial correlation for 0.20< CC<0.70). However, it is well established that the Indian population is predisposed to cardiovascular disease, T2D and visceral obesity (Retnakaran et al., 2006). Moreover, it was reassessed that international standards are not appropriate for Indian women (Kulkarni et al., 2007). Accordingly, the external validity of this study is very low.
5) Maegawa et al.(2003) measured GCT and OGTT during the firsttrimester in a Japanese population (n=749, age 28.9±4.1 years, BMI 21±2.9 kg/m2). Subjects with normal results
were tested again at 24–28 weeks of gestation with GCT and 75g-OGTT. Only 22 women (2.9%) tested positive for GDM (Japan Diabetes Society and the Japan Society of Obstetrics and Gynecology criteria) with OGTT. Among those 22 women who diagnosed with GDM, 14 were predicted with the firsttrimester (threshold: 7.2 mmol/L) and 8 with the second trimester GCT (threshold: 7.2 mmol/L). This study concluded that the majority of cases of GDM were detected during the firsttrimester with a positive GCT. However, the absence of the clear definition of firsttrimester (gestational weeks) and the low prevalence of GDM were both weaknesses of the study. In addition, the OGTT cutoff values for the GDM definition were different with ADA and CDA guidelines.
6) Bito et al.(2005) studied a cohort of 163 women having one or two risk factors for GDM (mostly familial history of diabetes, obesity and age). A 75g-OGTT was performed at ≤ 16 weeks, 24-28weeks and 32-34weeks and the World Health Organization (WHO) criteria were used for the GDM diagnosis. Using logistic regression analysis and ROC curves, it was determined that at 14 weeks, fasting (5.0 mmol/L) and 2-hr 75g-OGTT (6.2 mmol/L) glucose are cut-off values under which GDM at 24-28 weeks is unlikely. The best combined cut-off values to exclude subsequent GDM were ≤ 5.3 mmol/L (fasting) and ≤ 6.8 mmol/L (2-hr post load) (Bito et al., 2005). However, using these cut-off values, the lowest false-positive rate was very high, 73.5% at 24-28weeks. Results from this study must be considered with caution since this Hungarian cohort (age: 29±5 years, pre-gestational BMI: 29.5±5.6 kg/m2) had a noteworthy and surprising risk for GDM: 54% of the 163 women developed GDM at some point during pregnancy although no risk factor was significant for the prediction of GDM. This suggests that risk factors are useful to identify at-risk women yet they have low predictive value (Griffin et al., 2000).
There are several important drawbacks in these above-mentioned studies. First of all, there is an extended definition of firsttrimester in the first, second and fourth papers. Two other papers (Bartha et al., 2000and Meyer et al., 1996)were not included in this review because screening was performed at 18 weeks and 22 weeks, respectively. In addition, the CDA recommended threshold (7.8 mmol/L) was seldom used (in the first and fourth papers). Furthermore, all papers were underpowered as previously explained.
Although some reported sensitivities or specificities seem high, 95% confidence intervals were not reported and are expected to be very large (for sensitivity and likelihood ratios, for example). The fourth and fifth studies are encouraging but were performed on Japanese and Indian women, respectively. In these studies, women with a negative GCT were not assessed and excluded although it was shown that 6.3% of women with a GCT < 7.8 mmol/L develop GDM (Di Cianni et al., 2003, Naylor et al., 1997). True GDM and pre-existing T2D were not differentiated in these studies. Another important weakness of these studies is the absence of blinding in their research design. None of these papers specify whether or not first screening results were blinded for the participants and/or the research team.
The above-mentioned weaknesses have been considered in our study design.
HYPOTHESIS
Rational: As described in the above section, the escalating prevalence of obesity and the increasing age of pregnancy, both risk-factors to increase insulin resistance, strengthen the need to find an appropriate method to screen universally for GDM in the early stage of pregnancy. Moreover, it would be very appropriate to identify early on women who will later develop GDM, in order to prevent the mother and her fetus from the appearance of GDM as well as the short and long-term complications of GDM, assuming that “the earlier the treatment, the better the outcomes”. However, in early pregnancy there is no approved and generalizable screening method to predict GDM with high sensitivity and acceptable specificity. Such determination of prediction criteria would enable healthcare providers to distinguish pregnancies at high risk of GDM from those at low risk. This criteria would allow for early intervention and prevention of GDM providing that the clinical validity of such approach is demonstrated in future study.
Hypothesis: GCT plasma glucose value obtained during the first trimester is an independent predictor of GDM determined by 75g-OGTT at 24-28 weeks of gestation despite presence or absence of other risk factors for GDM.
OBJECTIVES
3.1 Objective No. 1To determine if GCT obtained during the first trimester of pregnancy is an independent predictor of GDM diagnosed by 75g-OGTT at 24-28 weeks of gestation.
3.2 Objective No. 2
To define the cut-off value of the one hour GCT plasma glucose value obtained during the first trimester in order to predict GDM with optimal sensitivity and specificity as diagnosed by 75g-OGTT at 24-28 weeks of gestation.
ARTICLE 1
First-trimester 50g-glucose challenge test: A robust predictor of gestational diabetes mellitus at 24-28 weeks of pregnancy.
Auteurs de l’article : Masoud Mahdavian, Marie-France Hivert, Julie Menard, Jean-Marie Moutquin, Annie Ouellet, Patrice Perron, Ghislaine Houde, Patrice Baillargeon, Jean-Luc Ardilouze
Statut de l’article : submitted to JAMA.
Avant-propos : my contribution in this article was in acquisition, analysis and interpretation of data, statistical analysis, drafting of the manuscript and critical revision of the manuscript for important intellectual content.
Résumé en français
Objectif : Déterminer au premier trimestre de la grossesse quelle est la valeur de la glycémie d’un test de tolérance à 50g de glucose (TTG) qui permet de prédire l’apparition d’un diabète gestationnel (DG) à 24-28 semaines.
Méthodes. Étude prospective d’une cohorte de femmes enceintes (âge ≥ 18 ans, sans diabète connu). Les TTG étaient effectués avant la 14e semaine de grossesse et les hyperglycémies
provoquées par voie orale (HGPO) à 24-28 semaines. Les résultats des TTG étaient gardés en aveugle. Le diagnostic de DG était posé sur l’HGPO, en utilisant les critères 2014 de l’Association américaine du diabète.
Résultats. Les dossiers de 1180 femmes (âge : 28,2±4,4 ans, IMC : 25,2±5,5 kg/m2) ont été
analysés. Les TTG ont été faits à 9,1±2,0 semaines et les HGPO à 26.5±1.1semaines. Un DG a été diagnostiqué chez 100 (8,4%) participantes. La glycémie post-TTG (5,6 mmol/L) prédisait le DG avec une sensibilité de 84,1% et une spécificité de 62,3%. Outre la glycémie post-TTG à 5.6 mmol/L, les autres prédicteurs indépendants du DG étaient les antécédents d’intolérance au glucose, l'âge ≥ 35 ans et l’IMC ≥ 25 kg/m2. Le TTG était le meilleur
marqueur de DG : après ajustement pour les autres facteurs prédictifs, la glycémie post-TTG ≥ 5.6 mmol/L multipliait les risques de DG par 7.8 (IC 95% de 4,15 à 16,1, p <0,001). Conclusions. Le TTG au premier trimestre est un puissant facteur prédicteur de DG à 24-28 semaines de gestation. Nous proposons qu’il soit utilisé pour identifier les femmes à risque élevé de DG à qui des soins préventifs pourraient être offerts.
Title: First-trimester 50g-glucose challenge test: a robust predictor of gestational diabetes mellitus at 24-28 weeks of pregnancy.
Short running title: First trimester GCT predicts 24-28 weeks GDM.
Authors: Masoud Mahdavian, MD1,2,Marie-France Hivert, MD, MMSc1,2,3, Julie Menard, PhD1, Jean-Marie Moutquin, MD, MSc1,4, Annie Ouellet, MD1,4, Patrice Perron, MD, MSc1,2, Ghislaine Houde, MD1,2, Jean-Patrice Baillargeon, MD, MSc1,2*, Jean-Luc Ardilouze, MD, PhD1,2*
*co-senior authors
Affiliation: 1Centre de recherche du Centre hospitalier universitaire de Sherbrooke,
Sherbrooke, QC, Canada, 2Endocrine Division, Department of Medicine, Université de Sherbrooke, Sherbrooke, QC, Canada, 3Harvard Pilgrim Health Care Institute, Department of Population Medicine, Harvard Medical School, Boston, MA, 4Department of Obstetrics and Gynecology, Université de Sherbrooke, Sherbrooke, QC, Canada.
Corresponding author: Jean-Luc Ardilouze
Tel.: Fax: Email:
ABSTRACT
Objectives. To determine first-trimester 50g-glucose-challenge test (GCT) glucose cut-off value that is most predictive of development of gestational diabetes mellitus (GDM) diagnosed at 24-28 weeks using 75g oral glucose tolerance test (OGTT), according to 2014 ADA thresholds.
Research Design and Methods. Population-based, prospective cohort study of pregnant women (age ≥18 years, no diabetes prior to pregnancy). GCT was performed before 14th week of pregnancy and diagnostic OGTT at 24-28 weeks. GCT results were blinded until OGTT for GDM diagnosis.
Results. Complete data from 1180 women were analyzed. Women were 28.2±4.4 years old, and had a BMI of 25.2±5.5 kg/m2. They completed GCT at 9.1±2.0 weeks of gestation and OGTT at 26.5±1.1 weeks. A total of 100 (8.4%) women were diagnosed with GDM. The 1h-glucose post-GCT cut-off value of 5.6 mmol/L predicted GDM with 82.0% (74.5-89.5) sensitivity and 60.8% (57.9-63.7) specificity. The significant independent clinical predictors of GDM measured in our study were GCT result ≥5.6 mmol/L, history of abnormal glucose tolerance, age ≥35 years and BMI ≥ 25 kg/m2, among which GCT was the strongest predictor. After adjustment for these predictors, a GCT ≥5.6 mmol/L increased the odds of GDM 7.8 folds (95% CI of OR: 4.15-16.1, p<0.001).
Conclusions. First-trimester GCT is a strong predictor of GDM at 24-28 weeks of gestation. We propose that first-trimester GCT could be used to identify women at high-risk for GDM and to offer them appropriate preventive care.
Keywords: Gestational diabetes mellitus, GDM, screening, predicting, 1st trimester, pregnancy
Introduction
Clinical characteristics of pregnant women have changed. More and more women delay starting a family (Kjos and Buchanan, 1999) and the proportion of childbearing-age women who are overweight and obese has significantly increased (Gingras et al., 2012, Coustan, 1996). The prevalence of gestational diabetes mellitus (GDM) and pre-existing glucose intolerance or diabetes has also sharply risen (Ferrara, 2007, Lawrence et al., 2008). Some studies report GDM prevalence as high as 10%, 12% and 28% in Caucasian, Japanese and Southeast Asia region populations, respectively (Jiwani et al., 2012). GDM is therefore a serious public health concern, the prevalence of which will in all likelihood only increase in coming years. Screening and prevention are thus cornerstone to reducing the short and perhaps long-term complications of GDM for mothers and their babies.
However, screening recommendations remain the subject of ongoing debate (American Diabetes Association, 2014, Canadian Diabetes Association Clinical Practice Guidelines Expert Committee, 2013, Nankervis et al., 2014, Vandorsten et al., 2013). Meanwhile, prevention recommendations have yet to be firmly established. This is partly due to a lack of robust means to adequately identify those women at high risk of GDM early during pregnancy. For screening, the American Diabetes Association (ADA) and many others recommend the two-step strategy consisting of a universal 50g-glucose challenge test (GCT) at 24-28 weeks of gestation, although women with multiple risk factors should in fact be tested earlier (Canadian Diabetes Association Clinical Practice Guidelines Expert Committee, 2013, Nankervis et al., 2014, Vandorsten et al., 2013). When 1h-glucose post-GCT results exceed a certain threshold, the value of which varies according to national and international professional associations or organizations, women then undergo a diagnostic 75g or 100g oral glucose tolerance test (OGTT). Others however perform the one-step 75g-OGTT approach according to the 2010 recommendations of the International Association of Diabetes and Pregnancy Study Groups, which have since been adopted by the ADA. This latter approach calls for the OGTT in all clinical settings of pregnancy i.e. early on in high-risk pregnancies to detect diabetes, and at 24-28 weeks as part of a universal screening strategy (IADPSG Consensus Panel, 2010).
The “early-screening” expert recommendation suggests that the same GCT or OGTT plasma glucose (PG) cut-off values be used both at 24-28 weeks and earlier. For prevention purposes, it is currently unknown whether the GCT early on in pregnancy helps identify those women at high risk of developing GDM later on.
Accordingly, the aims of this study were to 1) determine the first-trimester GCT cut-off value with optimal sensitivity and specificity to predict development of GDM as diagnosed by standard 75-g OGTT between 24 and 28 weeks of gestation; 2) determine if first-trimester 1h-glucose levels post-GCT predict GDM incidence independently of traditional first-trimester risk factors.
Research Design and Methods
We conducted a population-based prospective study of pregnant women receiving care at the Centre Hospitalier Universitaire de Sherbrooke (CHUS). The CHUS Research Ethics Board approved the study protocol and all participants gave written informed consent prior to their participation in accordance with the Helsinki declaration and all applicable laws and regulations.
Inclusion criteria were age ≥ 18 years, gestational age between 6 and 13 weeks from last menstrual period, no diabetes prior to pregnancy, < 2 alcoholic drinks/day, no regular high-intensity physical activity, singleton pregnancy, and otherwise good health status.
Women were recruited between April 2009 and June 2012, during their first prenatal visit (V1) at the CHUS Blood Sampling in Pregnancy (BSP) Clinic. The BSP Clinic offers routine prenatal blood sampling, including GCT and OGTT. The BSP Clinic is also a clinical research platform ensuring first-rate healthcare and follow-up for pregnant women with GDM by highly-trained staff (Hivert et al., 2012).
At V1, non-fasting women arrived between 8h30 AM and 3h30 PM. Weight was measured barefoot, in light clothing on a body composition analyzer (Tanita, TBF-300A, Tanita Corporation, Arlington Heights, IL) to the nearest 0.1 kg and height, with a stadiometer to
the nearest 0.01 m. BMI was calculated as weight (kg) divided by squared height (m2). Women self-reported their pre-gestational weight which was used to calculate pre-gestational BMI. In addition to age and BMI, other traditional GDM risk factors were documented (2010 ADA guidelines) (American Diabetes Association, 2010): history of diabetes in first-degree relatives, personal medical history of abnormal glucose metabolism including previous GDM, ethnicity, and poor obstetrical outcomes such as previous delivery of a newborn with fever, infection, hypoglycemia, jaundice, respiratory problem, fraction or malformation, being admitted to the intensive care unit, or stillborn.
Women were asked to drink a 300-ml 50g-glucose oral solution (Glucodex, Rougier Pharma, Mirabel, Qc, Canada) within 5 minutes. Each bottle contained 166.6 mg dextrose, as recommended. Over the next hour, women remained seated and venous PG was measured once the hour was up. An appointment was then set for the second visit (V2). No dietary or exercise counseling was provided. A qualified biochemist verified GCT results. These were kept blinded to the study team members and participating women until V2, except when PG reached ≥ 10.3 mmol/L. Pursuant recommendations from the Canadian Diabetes Association (CDA) at the time (Canadian Diabetes Association Clinical Practice Guidelines Expert Committee, 2013). 11 women with GCT 1h-glucose ≥ 10.3 mmol/L were considered as GDM, and thus were excluded and referred for usual care (Hivert et al., 2012).
For V2, scheduled between 24 and 28 weeks of gestation, women were asked to fast during the 12 hours preceding their appointment. Anthropometric data were collected according the same standardized protocols described for V1. Blood samples were collected (fasting, at 1h and 2h post 300-ml 75g-glucose oral solution (Glucodex) drunk within 5 minutes). Each bottle contained 250 mg dextrose, as recommended. Women remained seated during the 2h wait. Those with GDM were referred for usual care (Hivert et al., 2012).
Venous plasma glucose was measured using the oxidase method (Modular Analytics, Roche Diagnostics, USA) at the CHUS Biochemistry Laboratory.
The main outcome of this study was GDM diagnosed between the 24th and 28th weeks of gestation (V2), according to 2014 ADA recommended criteria: one glycaemia ≥ 5.1, 10.0 or 8.5 mmol/L at time 0, 60 and 120 min post-glucose, respectively. This main outcome was pre-specified, before the initiation of the study.
We reported continuous variables as means ± standard deviations and categorical variables as percentages with 95% confidence intervals. We tested for differences between women with or without GDM; unpaired Student’s t-tests were used for continuous variables and chi-squared tests for dichotomous variables. P-values < 0.05 were considered statistically significant for all analyses. Under objective 1, we constructed a ROC curve using sensitivities and specificities calculated from results of first trimester GCT to predict GDM at 24-28 weeks. We used the knee of the ROC curve to select the GCT 1h-glucose cut-off value where sensitivity and specificity are both optimal. Such a cut-off maximizes case-finding rates while minimizing false-positive rates and misclassification. Under objective 2, multivariate logistic regression models were performed in order to determine independent first-trimester predictors of GDM, using stepwise forward-backward methods: all variables collected at V1 (Table 2) that were associated with a GDM diagnosis in univariate analyses (p≤0.10) were successively added to the model, based on the lowest p-value, and then removed from the model if not independently associated with the outcome (p>0.05) in the multivariate model. We calculated the area-under-the-ROC-curve (AUROC) for the post-GCT selected 1h-PG value and for each multivariate model. Older age was associated with increased risk of GDM in a non-linear fashion in our population, such that age ≥ 25 years (ADA GDM risk factor definition) was not associated with GDM diagnosis, but age ≥ 35 years was (CDA GDM risk factor definition) (Canadian Diabetes Association Clinical Practice Guidelines Expert Committee, 2013). This is why age ≥ 35 years, instead of 25 years, was used for multiple logistic regression analyses. Statistical analyses were performed using JMP version 11.0 (SAS Institute).
Results
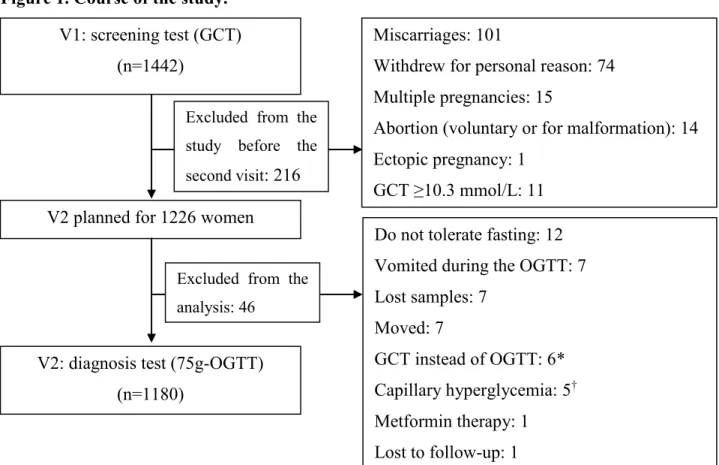
At V1, we recruited 1442 women who underwent a GCT. Of these, 216 women were excluded from the analyses (miscarriages: 101, withdrew for personal reason: 74, multiple
pregnancies: 15, medical abortion: 14, GCT plasma glucose ≥ 10.3 mmol/L: 11, ectopic pregnancy: 1). The other 1226 women were invited to V2. Of these, 46 were excluded from analyses (did not tolerate fasting: 12, vomited during the OGTT: 7, lost samples: 7, moved away from region: 7, GCT performed instead of OGTT: 6, high capillary glucose testing: 5, metformin therapy: 1, lost to follow-up: 1). Complete data from a total of 1180 women were thus analyzed.
Figure 1. Course of the study.
Footnotes: GCT: glucose challenge test; OGTT: oral glucose tolerance test.
*GCT was performed instead of the OGTT.†Measured capillary glycaemia before the visit and were high.
Characteristics of participants are provided in Table 2. Women self-reported a mean pre-pregnancy weight of 66.0±15.1 kg. Using the measured height at first trimester, we calculated that the mean pre-pregnancy BMI was 24.5±5.4 kg/m2, including 35.7% of women with BMI ≥ 25 kg/m2 and 14.8% with BMI ≥ 30 kg/m2. At V1, the mean BMI was 25.2±5.5 kg/m2. The
V1: screening test (GCT) (n=1442)
V2: diagnosis test (75g-OGTT) (n=1180)
Miscarriages: 101
Withdrew for personal reason: 74 Multiple pregnancies: 15
Abortion (voluntary or for malformation): 14 Ectopic pregnancy: 1
GCT ≥10.3 mmol/L: 11 Do not tolerate fasting: 12 Vomited during the OGTT: 7 Lost samples: 7 Moved: 7 GCT instead of OGTT: 6* Capillary hyperglycemia: 5† Metformin therapy: 1 Lost to follow-up: 1 V2 planned for 1226 women
Excluded from the study before the second visit: 216
Excluded from the analysis: 46
correlation between the pre-gestational BMI and BMI at V1 was r = 0.986 (P<0.001). The mean GCT PG was 5.5±1.4 mmol/L ranging from 2.6 to 10.2 mmol/L.
Table 2. Demographic and clinical variables of pregnant women (n=1180) V1
GCT visit
V2 OGTT visit
Gestational age (weeks) 9.1±2.0 26.5±1.1
Age (years) 28.2±4.4 -
BMI (kg/m2) 25.2±5.5 27.8±5.2
Primiparous (n, %) 568 (48.1%) -
ADA risk factors
Age ≥ 25 years (n, %) 949 (80.4%) (78.2 – 82.7) - Pre-pregnancy BMI ≥ 25 kg/m2 (n, %)a 417 (35.7%) (33.0 – 38.5) - Non-Caucasian (n, %) 53 (4.5%) (3.3 – 5.7) -
Familial history of diabetes (n, %)b 135 (18.2%) (15.4 – 21.0)
-
History of abnormal glucose tolerance (n, %)c 49 (5.7%) (4.1 – 7.2)
-
Prior history of poor obstetrical outcomes (n,%)d 217 (24.9%) (22.0 – 27.8)
-
GCT (mmol/L) 5.5±1.4 -
OGTT 0 min (mmol/L) - 4.2±0.4
OGTT 60 min (mmol/L) - 7.2±1.6
OGTT 120 min (mmol/L) - 5.9±1.4
Results are means ± SD or n, percentage and 95% confidence interval.
V1: visit 1; GCT: glucose challenge test; V2: visit 2; OGTT: oral glucose tolerance test; ADA: American Diabetes Association. adata collected in n=1165; bdata collected in n=741; cdata collected in n=863; ddata collected in n=872.
Women gained a mean of 2.6±0.3 kg/m2 of BMI (7.0±0.4kg) between V1 and V2. Mean OGTT PG values are shown in Table 2. According to ADA criteria, a total of 100 (8.4%) women were diagnosed with GDM.
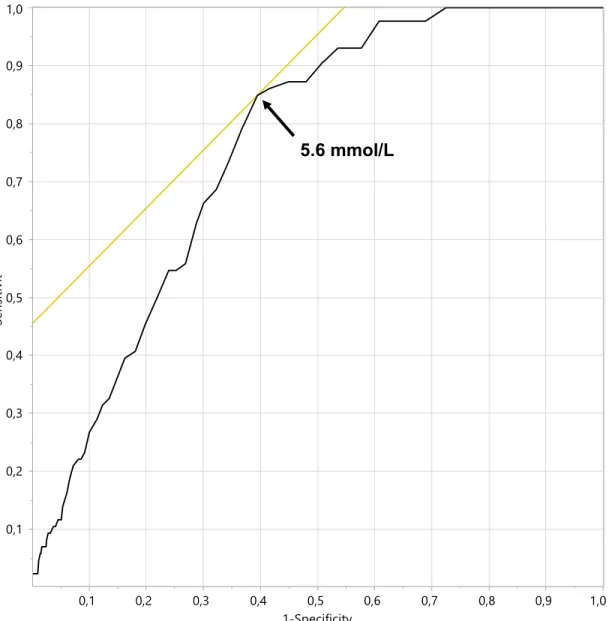
The ROC curve (Figure 2) indicates that the GCT 1h-PG value with optimal sensitivity and specificity to predict GDM is 5.6 mmol/L. This cut-off value has the following predictive values (95% CI) for GDM diagnosis using ADA criteria: sensitivity 82.0%, specificity 60.8%, positive predictive value 16.2% and negative predictive value 97.3% (Table 3). In other words, 505 women had first trimester GCT PG ≥ 5.6 mmol/L, among which 82 were classified with GDM at 24-28 weeks, therefore a GCT PG > 5.6 mmol/L at first trimester doubles the probability to develop GDM at 24-28 weeks (16.2 vs 8.5%), while this risk is 3 times lower (2.7 vs 8.5%) in those with PG ≤ 5.6 mmol/L. Accordingly, the LR+ of GCT is close to 2, which is the threshold for a good test to rule-in a condition; and its LR- is close to 0.2, the threshold for a very good test to rule-out a disease (Sackett et al., 2000).
Figure 2. ROC curve of the GCT plasma glucose.
Footnotes: GCT: glucose challenge test.
Table 3. Predictive values of the GCT PG of 5.6 mmol/L for GDM diagnosis according to ADA criteria.
Sensitivity (%) 82.0 (74.5 – 89.5)
Specificity (%) 60.8 (57.9 – 63.7)
False positive rate (%) 39.2 (36.3 – 42.1) False negative rate (%) 18.0 (10.5 – 25.5) Positive predictive value (%) 16.2 (13.0 – 19.5) Negative predictive value (%) 97.3 (96.1 – 98.5) Positive likelihood ratio 2.094 (1.86 – 2.36) Negative likelihood ratio 0.296 (0.19 – 0.45)
Precision (%) 62.6 (59.9 – 65.4)
Values are presented with 95% confidence interval.
GCT: glucose challenge test; PG: plasma glucose; GDM: gestational diabetes mellitus; ADA: American Diabetes Association
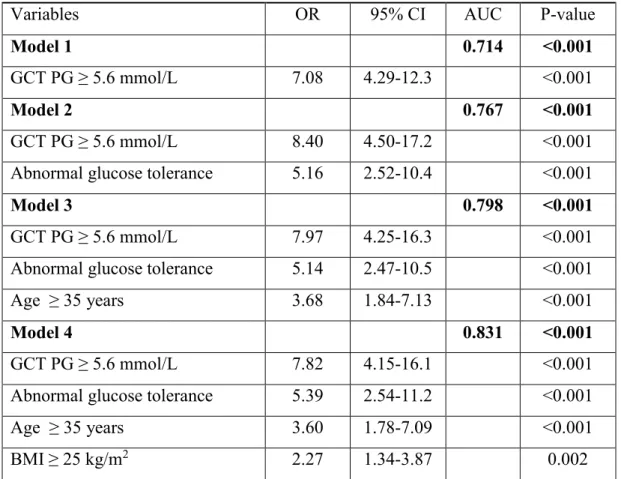
The first-trimester 5.6 mmol/L GCT value to discriminate women ‘at high risk of GDM’ vs. ‘not at risk’ was significantly increased the odds of developing GDM by 7 folds (OR=7.1) (see Table 4). The AUROC based on the GCT 1h-PG value alone was 0.714. The best overall predictive model included results of the GCT and three other clinical risk factors: history of abnormal glucose tolerance, age ≥ 35 years and BMI ≥ 25 kg/m2. Each of the latter risk factors added statistically to the logistic regression model and the AUROC of the full model, including all 4 variables, was 0.831. However, the 1h-PG result of the first-trimester GCT was the single best GDM predictor (Table 4). GCT used as a continuous variable was also independently and significantly associated with GDM and yields results similar to those of the model using the 5.6 GCT cut-off (OR=1.74 per mmol/L increase, 95% CI: 1.51-2.00, p<0.001).
Table 4. Independent predictors significantly associated with GDM diagnosis according to ADA criteria.
Variables OR 95% CI AUC P-value
Model 1 0.714 <0.001
GCT PG ≥ 5.6 mmol/L 7.08 4.29-12.3 <0.001
Model 2 0.767 <0.001
GCT PG ≥ 5.6 mmol/L 8.40 4.50-17.2 <0.001
Abnormal glucose tolerance 5.16 2.52-10.4 <0.001
Model 3 0.798 <0.001
GCT PG ≥ 5.6 mmol/L 7.97 4.25-16.3 <0.001
Abnormal glucose tolerance 5.14 2.47-10.5 <0.001
Age ≥ 35 years 3.68 1.84-7.13 <0.001
Model 4 0.831 <0.001
GCT PG ≥ 5.6 mmol/L 7.82 4.15-16.1 <0.001
Abnormal glucose tolerance 5.39 2.54-11.2 <0.001
Age ≥ 35 years 3.60 1.78-7.09 <0.001
BMI ≥ 25 kg/m2 2.27 1.34-3.87 0.002
GDM: gestational diabetes mellitus; ADA: American Diabetes Association; OR: odds ratio; AUC: area under the curve; GCT: glucose challenge test; PG: plasma glucose.
Multivariate logistic regression models were built using stepwise forward-backward methods. All variables in Table 2 associated with GDM diagnosis in univariate analyses (p≤0.10) were tested.
Conclusion
Different methods, using maternal clinical data and/or biomarkers, have been proposed for early screening of GDM during the first trimester of pregnancy. The aim of such screening is to protect mothers and fetuses from the short and long-term complications of GDM (Lacroix et al., 2013, Rasanen et al., 2013, Nanda et al., 2011, Kazandi, 2010, Punthumpol et al., 2008, Georgiou et al., 2008, Plasencia et al., 2011, Teede et al., 2011). Exposure to abnormally high concentrations of blood glucose during pregnancy can lead to abnormal fetal metabolic programming (Portha et al., 2011). In clinical practice, early identification of women at risk of developing GDM would allow the convenient detection of hyperglycemia
as soon as it arises during pregnancy, and thus closer follow-up, or offer preventive interventions.
Previous studies have proposed the early identification of women at risk of GDM through a combination of clinical risk factors. A retrospective study (Teede et al., 2011) proposed considering maternal demographics and medical characteristics at first trimester including the ADA’s classical risk factors (see Table 2). The proposed clinical scoring system had an AUROC of 0.703. A clinical risk score ≥ 4 points (out of possible total 8 points) identified women developing GDM with a sensitivity of 61.3% and a specificity of 71.4% (Teede et al., 2011). This clinical risk score seems promising, should it be validated in other populations outside Australia, and as long as clinicians are willing to adopt a multi-factor scoring system. Nevertheless, clinical risk-factor scoring may be improved by additional biochemical predictive markers.
Biochemical compounds measured early on in pregnancy as risk markers of developing GDM during the second trimester have been proposed as isolated predictors per se, or as part of a set to improve clinical risk-factor predictive scoring. One promising circulating protein is adiponectin. Low adiponectin levels during the first trimester of pregnancy are associated with increased risk of GDM in the second trimester, and this association was demonstrated in several cohorts including our own (Lacroix et al., 2013, Rasanen et al., 2013, Nanda et al., 2011). Unfortunately, adiponectin is not measured in routine clinical practice. Thus, it is unlikely to be adopted in real life. Another proposed biomarker was sex hormone-binding globulin (SHBG) levels (Thadhani et al., 2003). However, adding SHBG levels to clinical factor predictive scores provided relatively limited additional predictive value (Nanda et al., 2011).
Hemoglobin A1c is now part of the diagnostic criteria for diabetes. It can also be conveniently measured in a non-fasting state. It could thus be an interesting predictive biomarker. In one study, no case had GDM when A1c was less than 5.2% whereas all women with A1c ≥ 6.1% developed GDM (Anaka et al., 2014). Another study in high-risk women (Garner et al., 2014) showed that, half of women with A1c between 5.7 and 6.4% had GDM,
whereas only 13.6% of those with A1c less than 5.7% (P=0.002) developed GDM. Adjustment for race and history of GDM showed that women with A1c between 5.7 and 6.4% had five times higher estimated risk of developing GDM compared to those with A1c < 5.7% (OR 5.43, 95% CI 1.69-17.44) (Garner et al., 2014). Yet, because hemoglobin levels vary greatly during pregnancy (hemodilution, red blood cell turnover, anemia) from woman to woman, the use of A1c is limited.
Measurement of the glycation of other proteins has also been proposed. For example, a case-control study on 182 Finnish pregnant women showed that glycosylated fibronectin concentration might be considered as an early independent predictor of GDM during the first trimester (Rasanen et al., 2013). A threshold at 107 mg/dl had a sensitivity of 81% (95% CI 73–89), a specificity of 90% (95% CI 84–96) and an AUROC of 0.91 (95% CI 0.87–0.96) to predict GDM (Rasanen et al., 2013). However, glycated fibronectin is not a biochemical measurement commonly available in clinical settings and its predictive value of GDM incidence needs to be confirmed further in a population-based study before it is considered for clinical application.
Our results are in line with a report that 1h-glucose post-GCT at first trimester was a very strong predictor of risk for GDM during the second trimester with an AUROC of 0.912 (Plasencia et al., 2011). Interestingly, -1h-PG was a better predictor than baseline glucose (pre-glucose load) during the GCT. One of the limitations of that study was that GDM cases at second trimester were diagnosed based on a two-step procedure. Thus many cases may have been missed since OGTT was not performed in all women. Also nor did it assess or propose any optimal cut-off.
Our own study established that first trimester GCT is an excellent predictor of GDM in a large prospective population-based cohort where all women underwent a full 75g-OGTT, as recommended in the most recent ADA guidelines. The 1h-PG threshold of 5.6 mmol/L provided a sensitivity of 82.0%, specificity 60.8% and AUROC of 0.714. The AUROC reached 0.831 by adding three simple maternal clinical factors including history of abnormal glucose tolerance, age ≥ 35 years and BMI ≥25 kg/m2. This threshold is substantially lower
(- 2.2 mmol/L) than the 2014 value proposed by the ADA for GDM screening at the second trimester i.e. 7.8 mmol/L, or even the 7.2 mmol/L value of previous recommendations. Of note, the same screening value is recommended at the first trimester in women with risk factors. Our low threshold value is not surprising given the physiologic variation in glycemic regulation during pregnancy. Indeed, early pregnancy is usually characterized by enhanced insulin sensitivity which in turn decreases over the second and third trimesters (Lain and Catalano, 2007).
Our results are in line with previous research (Plasencia et al., 2011, Nahum and Huffaker, 1990, Bhattacharya, 2002, Yeral et al., 2013) showing a correlation between first-trimester GCT and early third-trimester OGTT. Furthermore, compared to other above-mentioned GDM screening methods used during the first trimester, GCT fulfills all WHO guideline criteria for screening-tests (Wilson’s Criteria) (Wilson and Jungner, 1968). GCT is also more feasible for health institutions than are biomarkers such as adiponectin or glycosylated fibronectin. Additionally, using the GCT may prove more practical than fasting PG measurement or OGTT for pregnant women who often preferred not to remain fasting during their first trimester while experiencing nausea or morning sickness.
Our study showed that GCT results taken as a continuous variable are a predictor of GDM. However, use of a ROC curve verified optimal sensitivity and specificity with a cut-off value of 5.6 mmol/L. In real-life clinical practice, clinicians need cut-off values to take action. Here, we propose that physicians should monitor women more closely when first trimester GCT PG ≥ 5.6 mmol/L as well as provide advice on the adoption of healthful lifestyle habits that reduce the risk of GDM. Other higher-specificity thresholds could be proposed if GCT is used for identification of ‘very high-risk’ women to offer high intensity preventive interventions, or higher-sensitivity thresholds to identify women who are most unlikely to develop GDM in order to avoid futile GDM testing during the second trimester.
To our knowledge, this is the first study of its kind specifically designed to determine GCT as a predictive test in a large population. We conducted the study prospectively and recruited a representative sample of the population of pregnant women receiving care at our tertiary
and quaternary care institution. GCT results were blinded until OGTT diagnosis, thus ensuring that study participants did not modify their lifestyle habits; consequently, our data were collected under real-life condition. Nevertheless, our study also has certain limitations. It was performed mainly in Caucasian women, due to the homogeneous population of mostly French/European descent in the province of Quebec and relatively low immigration rates in our area. Our data however can likely be generalized to other Caucasian women. Our hypotheses need to be now tested further in other ethnicities to determine whether the 5.6 mmol/L cut-off value is appropriate for other ethnic groups.
This prospective longitudinal cohort study in a Caucasian population showed that first-trimester GCT predicts GDM incidence at second first-trimester with both high sensitivity and specificity. This could allow, from now on, closer follow-up and advice relating to lifestyle improvement early on in the first trimester of pregnancy in women found to be at risk for GDM. More research is clearly needed to assess whether lifestyle modification and/or pharmacotherapy initiated early on in pregnancy decreases complication rates of GDM or even avoids development of GDM all together. Thus, we propose a GCT 1h-glucose value > 5.6 mmol/L for early identification of at-risk women and for use in future preventive-intervention studies starting early of pregnancy.