OATAO is an open access repository that collects the work of Toulouse
researchers and makes it freely available over the web where possible
This is an author’s version published in:
http://oatao.univ-toulouse.fr/25450
Official URL:
https://doi.org/10.1255/jnirs.1168
Any correspondence concerning this service should be sent
to the repository administrator:
[email protected]
To cite this version:
Levasseur-Garcia, Cécile
and Kleiber, Didier A Method for the Allotment of
Maize Contaminated by Toxins. (2015) Journal of Near Infrared Spectroscopy,
A method for the allotment of maize
contaminated by toxins
Cécile Levasseur-Garcia
a,b* and Didier Kleiber
caUniversité de Toulouse, Institut National Polytechnique de Toulouse, Ecole d’Ingénieurs de Purpan, LCA (Laboratoire de Chimie
Agro‑Industrielle), Département Sciences Agronomiques et Agroalimentaires, 75 voie du TOEC, F‑31076 Toulouse Cedex 3, France. E‑mail: [email protected]
bINRA, UMR 1010 CAI, F‑31030 Toulouse, France
cUniversité de Toulouse, Institut National Polytechnique de Toulouse, Ecole d’Ingénieurs de Purpan, Département Sciences Agronomiques et
Agroalimentaires, 75 voie du TOEC, F‑31076 Toulouse Cedex 3, France
Deoxynivalenol and fumonisins pose a health concern and have economic consequences, so the European regulation CE 1126/2007 dictates the maximal content allowed in cereals. The direct measurement of mycotoxin content using the established method is not only time-consuming and tedious, but also destructive and cannot be used in a silo. Alternative tools such as infrared spectroscopy are there-fore being studied. For the present investigation, spectral data collected from maize kernels contaminated naturally by mycotoxins were studied to predict the risk of deoxynivalenol and fumonisins. Discriminant models were used to create and identify batches that satisfy regulations for animal or human consumption.
Keywords: maize, toxins, allotment, infrared spectroscopy, discriminant analysis
Introduction
Mycotoxins are toxic secondary metabolites produced by some species of moulds that may develop on cereals. Five main mycotoxins are known to be associated with these products: aflatoxins, deoxynivalenol (DON), fumonisins (FUM), ochra‑ toxin and zearalenone. In the field during cultivation, maize can be infected in particular by Fusarium species. These moulds mainly produce three of the five mycotoxins mentioned above: DON, FUM and zearalenone.1–4 They are a health concern
and cause serious economic consequences by generating lower crop yields, food refusals from herds, low rates of fecun‑ dity, etc.5 Consequently, a European regulation was developed
to set the maximum allowed mycotoxin content in cereals:6
1750 µg kg−1 for DON and 4000 µg kg−1 for FUM in unprocessed
cereals for human consumption. Therefore, professionals need a tool to test for the presence in maize of these myco‑ toxins.
In the past, this problem has been addressed by studying models based on climatologic or environmental data.7–12
doi: 10.1255/jnirs.1168
However, the disadvantage of these models is that they require collection of a batch of data in the field during the growing season, which does not facilitate routine analysis.
Another approach to this problem is to use near infrared spectroscopy.13,14 Various groups have presented models that
use near infrared spectroscopy to predict the contents of DON or FUM in wheat, maize or barley. Some studies use a quanti‑ fying approach, whereas others prefer the allotment of cereals into different categories.15–25 However, these studies have not
always been done under ‘field’ conditions. The main sources of bias in these studies are a narrow range of mycotoxin content, a small number of samples, reference levels obtained through enzyme‑linked immunosorbent assay and cross valida‑ tion instead of external validation on an independent set. In conclusion, although the quantification of mycotoxins appears possible, it is not sufficiently precise to be used in the field. In fact, the standard error of prediction is too large with respect to the limit set by regulations.26
The objective of the study presented in this paper was the grouping of maize samples as a function of their mycotoxin contents. This work makes several new contributions to the field: it exploited a powerful maize database; the samples used were naturally contaminated, so their mycotoxin content varied over a wide range; and the mycotoxin content was determined using accredited methods. Because numerous samples (892) were used, the models reported herein are more robust than those achieved in previous work.
Materials and methods
Maize samples
Maize samples were collected between 2007 and 2009, in six different European countries (Italy, Denmark, France, Hungry, Holland and Poland), from experimental plots. The plots were chosen to be representative of the soil and climate diversity in Europe. Each sample was contaminated naturally by moulds and their mycotoxins. Before analysis, each sample of 1.5 kg was dried at 40 °C for four days. Samples were then stored at 4 °C until being scanned using infrared spectroscopy. Sample reduction was done with a grain sampler, to achieve represent‑ ative laboratory samples for scans and for chemical analyses . The same sample was used for scanning and chemical anal‑ ysis. This study used 892 samples: 381 for the DON model and 511 for the FUM model. After sample reduction, the DON and FUM content was determined using accredited methods.27
Reference analysis
The samples were crushed for 3 min with a Rasmill crusher (Romer Labs, Singapore), and then filtered with a 0.5 mm sieve. After adding an internal standard (neosolaniol for DON and fumonisin B1 C13 for FUM), 5 g of homogenate was extracted using an accelerated solvent extraction system (ESA 200, Dionex, USA). The extract was filtered using paper (Whatman GF/A, 1.6 µm), and an aliquot was injected in a liquid chromatography tandem mass spectrometry instru‑ ment (Ultima).28,29
Acquisition of infrared spectra
Using a near infrared spectrometer (NIRSystems 6500, Foss Tecator, Sweden), we acquired visible–near infrared reflectance spectra between 400 and 2498 nm at 2 nm incre‑ ments from whole‑grain samples (200 g). Each spectrum was obtained by averaging 32 scans. The entire spectrum was used for data analysis, and each spectrum had 1050 absorbance data.
Data analysis
Multivariate data analysis was applied to quantify the rela‑ tionship between the level of mycotoxin contamination (the dependent variable) and infrared spectra of maize (1050 predictors for each spectrum). Note that specific statistical procedures are required when using infrared spectra, as discussed below.
Round‑robin evaluation
To obtain robust models, a round‑robin evaluation was conducted in which each year (2007, 2008 and 2009) was used as a test set and the other two were the training set, repeated three times30,31 (Table 1).
Principal component analysis
For each round, we began by applying a principal component analysis (PCA) to the training samples, using FUM and DON databases, separately. PCA is an orthogonal transformation that converts the set of 1050 possibly correlated infrared vari‑ ables into a set of linearly uncorrelated variables called prin‑ cipal components (PCs). PCA is defined so that the first PC accounts for as much variability in the infrared spectra as possible, with the subsequent PCs accounting for less and less variability.32 The next step after applying PCA was to develop
a simpler model that connects the dependent variable (i.e. mycotoxin contamination level) to the infrared spectra (repre‑ sented by the PCs). Kaiser criterion was used for deciding the number of factors to be retained for PCA–linear discriminant analysis (all factors with eigenvalues greater than one).33
Data pre‑processing
The spectral data were pre‑processed to remove the effects of light scattering and to compensate for baseline offsets and bias. To obtain the best discrimination model, four different types of pre‑processing were tested. These included no treatment (i.e. the raw data were used), first‑derivative (D1) transformations (Savitzky–Golay) and standard normal variate (SNV) ± D1. The first derivative of a spectrum was used to emphasise small bands and resolve overlapping peaks. SNV removes the multi‑ plicative interference due to scatter and particle size. This method also corrects the variation in baseline shift.34 Data
pre‑processing was done using Unscrambler®multivariate
data analysis (v. X; CAMO A/S, Oslo, Norway).
Discriminant analysis
Discriminant analysis is often used in infrared spectros‑ copy;34,35 it constitutes a supervised multivariate method. The
PCs were used as input features into the classifiers. During the analysis, algorithms were developed, based on a set of mathematical relationships using the input data (PCs) of the training dataset, in order to identify the two categories of maize. The classifiers that were used for the analysis were linear discriminant analysis, quadratic discriminant analysis and Mahalanobis discriminant analysis.
Different parameters were used for developing discrimi‑ nant analysis models during each of the three rounds. Three regulatory limits were used for FUM (4000 µg kg−1, 5000 µg kg−1
Table 1. Round-robin evaluation of model performances. Training samples Evaluation samples Round 1 2007 + 2008 2009 Round 2 2007 + 2009 2008 Round 3 2008 + 2009 2007
and 10,000 µg kg−1) and three for DON (900 µg kg−1, 1750 µg kg−1
and 2000 µg kg−1). Four pre‑processings were used (no
pre‑processing, SNV, first derivative and a combination of first derivative and SNV). Finally, three classifiers were used (linear, quadratic and Mahalanobis). Thus, 36 models were developed for each toxin and each of the three rounds, for a total of 216 models. Models were realised using Unscrambler® multi‑
variate data analysis (v. X).
The standard approach, linear discriminant analysis, seeks a linear combination of the input variables, in this case the PCs, which discriminated well between the two groups, i.e. the two categories of maize samples: one with mycotoxin content below the regulatory limit (batch 1) and another with myco‑ toxin content above this limit (batch 2). Quadratic discriminant analysis is a general discriminant function with quadratic decision boundaries which can be used to classify datasets with two or more classes.
The best model was selected on the basis of the accuracy criterion: the greater the criterion, the better the model.33
The test set was used to estimate how well the models would perform on new data. The model was evaluated through confusion matrices.36 Table 2 shows the confusion matrix for a
two‑class classifier.
The prediction accuracy and the classification error can be calculated from Table 2. The prediction accuracy is obtained as follows: Accuracy a d a b c d + = + + + (1)
The classification error is obtained from the confusion matrix: Error b c a b c d + = + + + (2)
Samples in groups a and d are properly classified, whereas samples b and c are not. Group b contains maize with incor‑ rect positive predictions. They have a mycotoxin content below the limit and are improperly classified. Samples in group c have a mycotoxin content above the limit and are classified as accepted.
Accuracies obtained for each of the three rounds were averaged. The best model was defined as the one with the highest accuracy and the lowest error in tests. The final model was calculated using the optimised parameters (data
pre‑treatment , type of classifier), as proposed by Dardenne.31
Once the model was constructed, sorting a batch of maize into two new batches may be simulated.
These models must allow industry to sort maize according to whether it is destined for human or animal consumption, on the basis of binning a consignment of maize based on taking and analysing samples from a consignment.
Results and discussion
Visual and spectral characteristics
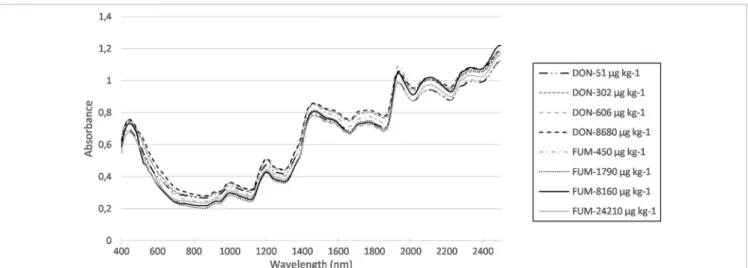
Figure 1 shows examples of spectra from samples with varying FUM and DON contents.
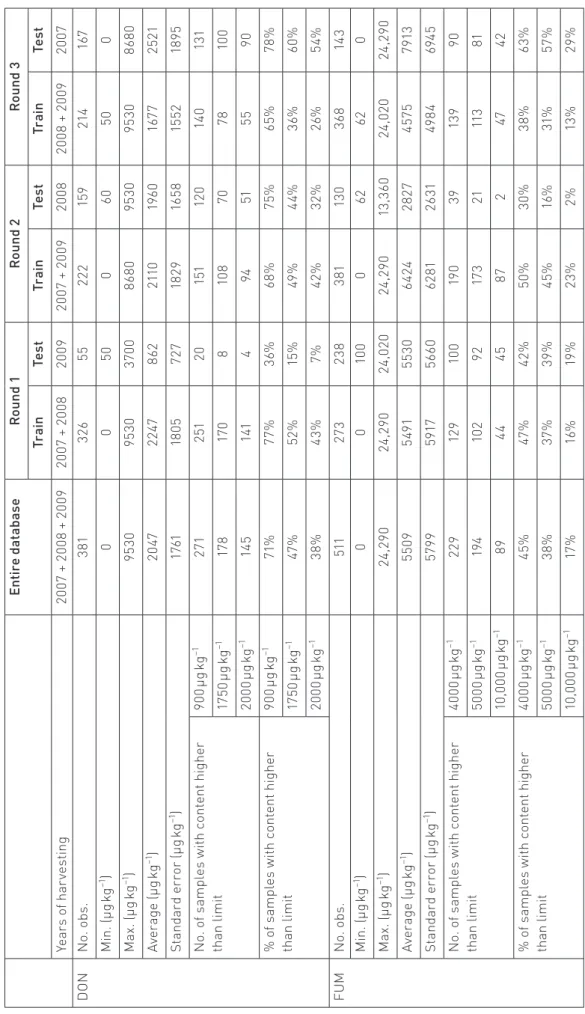
Figure 2 shows the loadings of the first PC for DON and FUM sample sets. A higher loading means that the corre‑ sponding wavelength carries greater weight for explaining the variance in the data. As shown in Figure 2, the wave‑ lengths 518 nm, 1016 nm, 1222 nm, 1400–1890 nm, 2028 nm, 2240 nm and 2400 nm are the most important because of higher loading.
Infrared bands have been tentatively assigned to chem‑ ical functional groups. The band at 518 nm can be related to changes in damaged kernel colour.37,38 The bands at 1016 nm
and 1222 nm are similar to bands observed for OH defor‑ mation modes, which can be associated with ergosterol, a component of fungal cell membranes,16 or with protein or
carbohydrate modifications.39,40 The region from 1400 nm to
1900 nm contains combinations involving changes of kernel composition and pigmentation.16,18,22,41 The bands at 2028 nm,
2240 nm and 2400 nm can be assigned to deteriorative altera‑ tion of kernels.16,41 Finally, the largest magnitude difference
occurs between 1400 nm and 1900 nm, as observed by several authors.22,42 The interpretation of this observation is based
on the assumption that the mycotoxin content is too small (of the order of parts per million) for direct detection. Their presence is thus associated with a complex ensemble of infor‑ mation related to the growth of the fungus on the cereal. In previous work, we listed the spectral zones that are modified by the presence of moulds or mycotoxins.26 These spectral
signatures are mainly due to modified protein or carbohydrate levels (starch, cellulose, ergosterol, chitin, etc.).
Table 3 summarises the statistical characteristics of the 892 samples.
Table 2. Two-way confusion matrix.a
Predicted by discriminant analysis Negative
(mycotoxin content < limit)
Positive
(mycotoxin content > limit) Actual content Negative (mycotoxin content < limit) a b
Positive (mycotoxin content > limit) c d
aParameter a is the number of correct negative predictions (maize samples having a mycotoxin content below the limit and properly classified), b is the
number of incorrect positive predictions (maize samples having a mycotoxin content below the limit and improperly classified), c is the number of incorrect negative predictions (maize samples having a mycotoxin content above the limit and improperly classified), d is the number of correct positive predictions (maize samples having a mycotoxin content above the limit and properly classified).36
Characteristics of chemical data
In this qualitative study, we consider six content limits indi‑ cated in Commission Regulation (EC) No. 1126/2007 (Table 4). The maximum content we find for DON is 9530 µg kg−1 and the
maximum content for FUM is 24,290 µg kg−1. Consequently,
the following limits were chosen to test the predictive capa‑ bility of the qualitative models: 900 µg kg−1, 1750 µg kg−1
and 2000 µg kg−1 for DON; 4000 µg kg−1, 5000 µg kg−1 and
10,000 µg kg−1 for FUM.
In the entire database, we find that 71% of the samples have a DON content above 900 µg kg−1, 47% above 1750 µg kg−1 and
38% above 2000 µg kg−1. In the FUM database, 45%, 38% and
17% of the samples have a FUM content above 4000 µg kg−1,
5000 µg kg−1 and 10,000 µg kg−1, respectively.
Principal component analysis
The eigenvalues and the explained and cumulative variances represented by each of the first 10 PCs are presented in Table 5.
The variance corresponding to each PC indicates how much variation in the data is described by the given PC.
The number of PCs retained is determined based on the Kaiser criterion. The first PC represents 84.1% and 81.0% of the variation in the infrared spectra for DON and FUM databases, respectively. For the DON database, the second PC represents 10.6%, so the first two PCs together repre‑ sent 94.7% of the initial variation. Considering the Kaiser criterion, we retain the first seven PCs to describe the 1050 variables of the DON infrared spectra and eight PCs for FUM. For the two databases, the chosen PCs represent 99.8% of the variation in the infrared data. These new variables (or factors) are used as inputs in the discriminant analysis models.
Discriminant analysis models and
performances
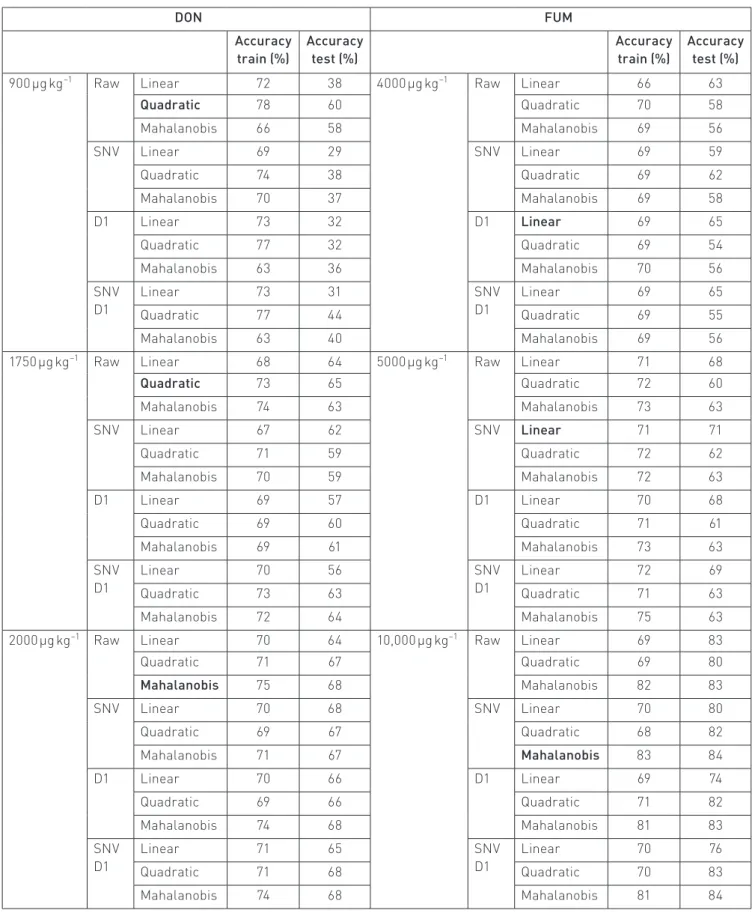
We developed 216 models with seven or eight inputs (the seventh or eighth first components of the PCA) and one binary output (below and above the European limit). Tables 6, 7 and 8 show the results of the models.
The results of the training and test are presented sepa‑ rately. No outliers were removed from the database. As shown in Table 6, all six best classifiers result in accuracies for classifying mycotoxin‑infected samples from 60% to 84%.
The results for sorting DON‑contaminated maize are shown in Table 7. The two‑way classification results vary between 72% and 77%. The results for sorting FUM‑contaminated maize are also presented in Table 7, the accuracy of the results being 70%, 71% and 77% for the limits of 4000 µg kg−1, 5000 µg kg−1
and 10,000 µg kg−1, respectively.
The objective of this work was not “to identify whether a batch of grain was contaminated (yes or no) with absolute accuracy” – our models are not sufficiently accurate to do this. Instead, the objective was to optimise the orientation of grains towards “their proper utility”.
The method currently applied in the grain industry to deter‑ mine whether a grain lot meets regulatory standards is based on occasional grain samplings. If the mean content of the Figure 1. Raw near infrared spectra of eight maize samples with DON content varying between 51 µg kg−1 and 8680 µg kg−1, and FUM
content varying between 450 µg kg−1 and 24,210 µg kg−1.
518 1016 1222 1418-1890 2028 2240 2400 0 0,01 0,02 0,03 0,04 0,05 400 600 800 1000 1200 1400 1600 1800 2000 2200 2400 Ab so rb an ce Wavelength (nm) FUM DON
Figure 2. Loading-vector plot of first principal component cor-responding to the DON and FUM datasets constructed from the maize samples.
Tabl e 3. St atis tic al char act eris
tics of the 892 maize sampl
es r
egar
ding DON and FUM c
ont
ents, depending on the s
tep of the r ound-r obin e valuation. En tir e d at ab as e R ou nd 1 R ou nd 2 R ou nd 3 Tr ai n Test Tr ai n Test Tr ai n Test Ye ar s o f h ar ve sti ng 20 07 + 2 00 8 + 20 09 20 07 + 2 00 8 20 09 20 07 + 20 09 20 08 20 08 + 20 09 20 07 D ON N o. ob s. 381 326 55 222 15 9 214 16 7 M in . ( µg k g −1 ) 0 0 50 0 60 50 0 M ax . ( µg k g −1) 95 30 95 30 37 00 86 80 95 30 95 30 86 80 Av er ag e (µ g kg −1) 20 47 22 47 862 211 0 19 60 16 77 25 21 St an dar d er ro r ( µg k g −1 ) 17 61 18 05 72 7 18 29 16 58 15 52 18 95 N o. o f s am pl es w ith c ont ent h ig he r th an li mi t 90 0 µg k g −1 271 251 20 15 1 12 0 14 0 13 1 17 50 µ g kg −1 17 8 17 0 8 10 8 70 78 10 0 20 00 µ g kg −1 14 5 141 4 94 51 55 90 % o f s am pl es w ith c ont ent h ig he r th an li mi t 90 0 µg k g −1 71 % 77 % 36% 68% 75% 65% 78 % 17 50 µ g kg −1 47 % 52 % 15 % 49 % 44% 36% 60% 20 00 µ g kg −1 38% 43% 7% 42 % 32 % 26% 54% FUM N o. ob s. 511 27 3 238 381 13 0 36 8 14 3 M in . ( µg k g −1 ) 0 0 10 0 0 62 62 0 M ax . ( µg k g −1) 24 ,2 90 24 ,2 90 24 ,0 20 24 ,2 90 13 ,3 60 24 ,0 20 24 ,2 90 Av er ag e (µ g kg −1) 55 09 549 1 55 30 64 24 28 27 457 5 79 13 St an dar d er ro r ( µg k g −1 ) 57 99 59 17 566 0 62 81 26 31 49 84 694 5 N o. o f s am pl es w ith c ont ent h ig he r th an li mi t 40 00 µ g kg −1 22 9 12 9 10 0 19 0 39 13 9 90 50 00 µ g kg −1 19 4 10 2 92 17 3 21 11 3 81 10 ,0 00 µ g kg −1 89 44 45 87 2 47 42 % o f s am pl es w ith c ont ent h ig he r th an li mi t 40 00 µ g kg −1 45% 47 % 42 % 50% 30% 38% 63% 50 00 µ g kg −1 38% 37 % 39 % 45% 16 % 31 % 57 % 10 ,0 00 µ g kg −1 17 % 16 % 19 % 23% 2% 13 % 29%
grain lot estimated by this sampling exceeds EU regulatory limits, then the lot is rejected for its original use and rerouted to another use.
By following this binary decision scheme and applying the models presented in this work, grain distribution in the trans‑ formation circuit (for five of the six models proposed) can be optimised by separating the initial grain lot into two batches, each destined for a different use (Table 8). Thus, grain from model DON‑1750 µg kg−1 should have been entirely rejected
for human consumption because the mean content of the 381 samples was 2047 µg kg−1. However, by sorting based on
our model, 48% of the grain could still be routed to human consumption because the mean content of batch 1 is lowered to 1265 µg kg−1. Regarding model DON‑2000 µg kg−1, 67% of
the samples could be oriented towards human consumption because the sorting reduces the mean content to less than 1750 µg kg−1. Applying the same reasoning to FUM, models
FUM‑4000 µg kg−1 and FUM‑5000 µg kg−1 would orient 55%
and 57% of the grain, respectively, towards human consump‑ tion. Finally, model FUM‑10,000 µg kg−1 would orient 77% of
the grain towards “complementary and complete feedstuffs for pigs, horses, rabbits and pet animals” instead of orienting it for fish. For model DON‑900 µg kg−1, despite the proposed
sorting method, neither of the two new lots is acceptable for swine consumption.
These models thus allow maize to be sorted into batches of higher purity for human consumption or to remove the more contaminated maize for other use. This sorting can be done by industry to properly route maize for human consumption, for animal consumption or for other uses.
Discussion
In our study, because the grains were contaminated naturally and harvested over several years, this database offers a good Table 4. European limits for DON and FUM contents in maize and by-products.
European limit for maize
Reference DON (µg kg−1) FUM (µg kg−1)
Food material Human 1881/2006/CE 1750 4000
Feed material Complementary and complete feedstuffs 2006/576/CE 5000 Complementary and complete feedstuffs for calves
(<4 months), lambs and kids
2006/576/CE 2000 Complementary and complete feedstuffs for pigs 2006/576/CE 900 Complementary and complete feedstuffs for pigs,
horses, rabbits and pet animals
2006/576/CE 5000
Complementary and complete feedstuffs for fish 2006/576/CE 10,000 Complementary and complete feedstuffs for poul‑
try, calves (<4 months), lambs and kids
2006/576/CE 20,000
Complementary and complete feedstuffs for adult ruminants (>4 months) and mink
2006/576/CE 50,000
Feed materials maize by‑products 2006/576/CE 12,000 60,000 Table 5. Variance represented by the first 10 PCs extracted from the PCA of DON and FUM databases.
DON database FUM database
Eigenvalue Explained variance (%) Cumulative explained variance (%) Eigenvalue Explained variance (%) Cumulative explained variance (%) PC0 0 0 0 0 0 0 PC1 883.4 84.1 84.1 850.2 81.0 81.0 PC2 111.3 10.6 94.7 133.1 12.7 93.6 PC3 34.3 3.3 98.0 36.7 3.5 97.1 PC4 8.5 0.8 98.8 11.5 1.1 98.2 PC5 5.2 0.5 99.3 9.8 0.9 99.2 PC6 3.7 0.4 99.7 3.3 0.3 99.5 PC7 1.5 0.1 99.8 2.0 0.2 99.7 PC8 0.8 0.1 99.9 1.3 0.1 99.8 PC9 0.4 0.0 99.9 0.6 0.1 99.9 PC10 0.2 0.0 99.9 0.3 0.0 99.9
Table 6. Training and testing accuracies of the 72 models, each one averaged from three rounds of evaluation, for the DON and FUM data-bases, depending on the type of pre-processing and discriminant analysis, and the European limit for mycotoxin content. The best model in terms of test accuracy, for each mycotoxin and European limit, is in bold.
DON FUM Accuracy train (%) Accuracy test (%) Accuracy train (%) Accuracy test (%) 900 µg kg−1 Raw Linear 72 38 4000 µg kg−1 Raw Linear 66 63
Quadratic 78 60 Quadratic 70 58 Mahalanobis 66 58 Mahalanobis 69 56 SNV Linear 69 29 SNV Linear 69 59 Quadratic 74 38 Quadratic 69 62 Mahalanobis 70 37 Mahalanobis 69 58 D1 Linear 73 32 D1 Linear 69 65 Quadratic 77 32 Quadratic 69 54 Mahalanobis 63 36 Mahalanobis 70 56 SNV D1 Linear 73 31 SNV D1 Linear 69 65 Quadratic 77 44 Quadratic 69 55 Mahalanobis 63 40 Mahalanobis 69 56
1750 µg kg−1 Raw Linear 68 64 5000 µg kg−1 Raw Linear 71 68
Quadratic 73 65 Quadratic 72 60 Mahalanobis 74 63 Mahalanobis 73 63 SNV Linear 67 62 SNV Linear 71 71 Quadratic 71 59 Quadratic 72 62 Mahalanobis 70 59 Mahalanobis 72 63 D1 Linear 69 57 D1 Linear 70 68 Quadratic 69 60 Quadratic 71 61 Mahalanobis 69 61 Mahalanobis 73 63 SNV D1 Linear 70 56 SNV D1 Linear 72 69 Quadratic 73 63 Quadratic 71 63 Mahalanobis 72 64 Mahalanobis 75 63
2000 µg kg−1 Raw Linear 70 64 10,000 µg kg−1 Raw Linear 69 83
Quadratic 71 67 Quadratic 69 80 Mahalanobis 75 68 Mahalanobis 82 83 SNV Linear 70 68 SNV Linear 70 80 Quadratic 69 67 Quadratic 68 82 Mahalanobis 71 67 Mahalanobis 83 84 D1 Linear 70 66 D1 Linear 69 74 Quadratic 69 66 Quadratic 71 82 Mahalanobis 74 68 Mahalanobis 81 83 SNV D1 Linear 71 65 SNV D1 Linear 70 76 Quadratic 71 68 Quadratic 70 83 Mahalanobis 74 68 Mahalanobis 81 84
picture of what is found in the field. It contains a significant number of samples, and the concentration ranges are much larger than those discussed in the literature, which is, again, representative of what is found in the field.26
This approach of allotment is superior to quantification approaches because, as shown in some studies,25,26 even if
the quantification of mycotoxins appears possible, it is not
sufficiently precise to be used in the field. Indeed, the standard error of prediction is too large with respect to regulatory limits – notably European limits.
Similar to the DON models, the FUM models enable, on the one hand, assembly of less contaminated lots and, on the other hand, assembly of lots whose FUM content exceeds the regulatory limit.
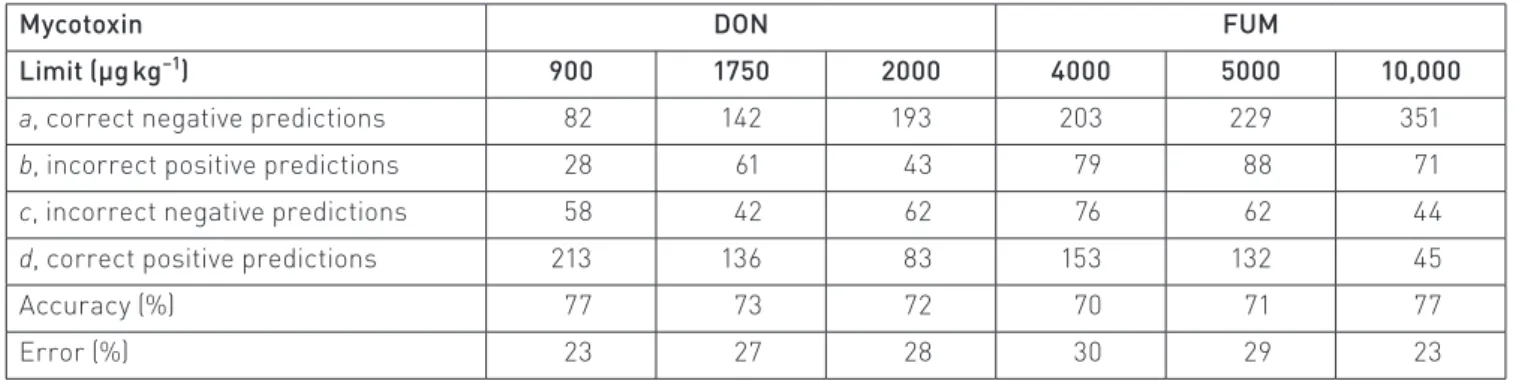
Table 7. Performances of the six best discriminant analysis models applied to the 381 (DON) and 511 (FUM) samples: two-way confusion matrix, accuracy and error rates, for DON and FUM models, and for the six European limits
Mycotoxin DON FUM
Limit (µg kg−1) 900 1750 2000 4000 5000 10,000
a, correct negative predictions 82 142 193 203 229 351
b, incorrect positive predictions 28 61 43 79 88 71
c, incorrect negative predictions 58 42 62 76 62 44
d, correct positive predictions 213 136 83 153 132 45
Accuracy (%) 77 73 72 70 71 77
Error (%) 23 27 28 30 29 23
Table 8. Comparison of actual percentage of samples with mycotoxin content higher than European limit, and mean contents of DON and FUM, before and after simulating the sorting of maize grains in grain storage, regarding the six European limits
Percentage of samples (%) Actual percentage of samples with mycotoxin content higher than limit (%) Mean content (µg kg−1) Variation of mycotoxin average content compared to content before sorting, in grain storage Accepted or rejected regarding EU limit? DON (381 samples)
900 µg kg−1 In training 100 71 2 047 Before sorting Rejected
Batch 1 37 41 1 163 − Rejected
Batch 2 63 88 2 561 + Rejected
1750 µg kg−1 In training 100 47 2 047 Before sorting Rejected
Batch 1 48 23 1 265 − Accepted
Batch 2 52 69 2 778 + Rejected
2000 µg kg−1 In training 100 38 2 047 Before sorting Rejected
Batch 1 67 24 1 574 − Accepted
Batch 2 33 66 3 005 + Rejected
FUM (511 samples)
4000 µg kg−1 In training 100 45 5 509 Before sorting Rejected
Batch 1 55 27 3 253 − Accepted
Batch 2 45 66 8 222 + Rejected
5000 µg kg−1 In training 100 38 5 509 Before sorting Rejected
Batch 1 57 21 3 418 − Accepted
Batch 2 43 60 8 275 + Rejected
10,000 µg kg−1 In training 100 17 5 509 Before sorting Accepted
Batch 1 77 11 4 279 − Accepted
Our best‑available DON model offers an accuracy that varies between 72% and 77%. For the FUM model, the corresponding accuracy ranges from 70% to 77%. The literature contains few studies that focus on FUM. Comparing these results with those from other studies is difficult because the classification strategies are not quite the same: the toxin threshold used to separate the lots varies between different research groups. Nevertheless, according to previous studies, accuracies vary from 69% to 90% in external‑validation sets.15,24,25
We note, however, that even if the proposed models are promising, a loss of precision is sure to arise upon creating the database. In fact, the sieving process that follows grinding (through a filter with pores of 0.5 mm in diameter) may remove part of the pericarp, thereby lowering the mycotoxin content. This scenario does not affect the sorting capacity of the proposed models but does induce a bias because the spectra are acquired from whole grains.
Some next steps would be to add new samples to improve performances, and to validate the models with new samples; also, to study co‑contamination of samples with different mycotoxins. Another step would be to work online on grain flows at the silo, since the models presented here were devel‑ oped for whole grains (non‑ground). An application in breeding programmes and common systems of quality management could be imagined.
Conclusions
This study assessed the feasibility of using near infrared spectroscopy for screening maize for DON and FUM contents. Because the contamination level (in µg kg−1) is too low to be
detected, the observed spectral modification must be related to the presence of fungi on grain.
Since quantitative models are not sufficiently precise to satisfy European regulatory limits, this qualitative approach could prove to be a valuable industrial tool leading to better distribution and use of maize. The power of our approach lies in working on qualitative models based on European limits, testing a large number of naturally contaminated samples that have significant variation in geographic origin and harvest dates, and the use of a statistical method of combining PCA and a discriminant analysis model, which could also be used to detect other contaminants.
Acknowledgement
The authors thank the working group STIMUL for providing maize samples and their reference values.
References
1. C.J. Alexopoulous, C.W. Mims and M. Blackwell, Introductory Mycology. John Wiley, New York (1996).
2. R. Krska, P. Schubert‑Ullrich, A. Molinelli, M. Sulyok, S. Macdonald and C. Crews, “Mycotoxin analysis: an update”, Food Addit. Contam. A 25, 152 (2008). doi: http:// dx.doi.org/10.1080/02652030701765723
3. J.I. Pitt and A.D. Hocking, Fungi and Food Spoilage. Blackie Academic & Professional, London (1997).
4. A. Yiannikouris and J.P. Jouany, “Mycotoxins in feeds and their fate in animals: a review”, Anim. Res. 51, 81 (2002). doi: http://dx.doi.org/10.1051/animres:2002012
5. J.W. Bennett and M. Klich, “Mycotoxins”, Clin. Microbiol. Rev. 16, 497 (2003). doi: http://dx.doi.org/10.1182/ CMR.16.3.497‑516.2003
6. European Commission, Commission Regulation (EC) No. 1126/2007 of 28 September 2007 Amending Regulation (EC) No. 1881/2006 Setting Maximum Levels for Certain Contaminants in Foodstuffs as Regards Fusarium Toxins in Maize and Maize Products (2007).
7. P. Battilani, A. Pietri, C. Barbano, A. Scandolara, T. Bertuzzi and A. Marocco, “Logistic regression modeling of cropping systems to predict fumonisin contamina‑ tion in maize”, J. Agric. Food Chem. 56, 10433 (2008). doi:
http://dx.doi.org/10.1021/jf801809d
8. R. de la Campa, D.C. Hooker, J.D. Miller, A.W. Schaafsma and B.G. Haamond, “Modeling effects of environment, insect damage, and Bt genotypes on fumonisin accu‑ mulation in maize in Argentina and the Philippines”, Mycopathologia 159, 539 (2005). doi: http://dx.doi. org/10.1007/s11046‑005‑2150‑3
9. A. Maiorano, A. Magni, C. Ramponi and A. Reyneri, “Système d’aide à la décision (SAD) pour l’évaluation du
risque de contamination par les fumonisines dans le grain de maïs”, in Mycotoxines Fusariennes des Céréales, Arcachon, France, 11–13 September 2007.
10.A. Maiorano, A. Reyneri, D. Sacco, A. Magni and C. Ramponi, “A dynamic risk assessment model (FUMAgrain) of fumonisin synthesis by Fusarium verticil-lioides in maize grain in Italy”, Crop Prot. 28, 243 (2008). doi: http://dx.doi.org/10.1016/j.cropro.2008.10.012 11.J.D. Miller, “Factors that affect the occurrence of fumon‑
isin”, Environ. Health Perspect. 109, 321 (2001).
12.A.W. Schaafsma and D.C. Hooker, “Climatic models to predict occurrence of Fusarium toxins in wheat and maize”, Int. J. Food Microbiol. 119, 116 (2007). doi: http:// dx.doi.org/10.1016/j.ijfoodmicro.2007.08.006
13.D. Bertrand and E. Dufour, La Spectroscopie Infrarouge et Ses Applications Analytiques. Tec & Doc Lavoisier, Paris (2005).
14.D. Bertrand, “La spectroscopie proche infrarouge et ses applications dans les industries de l’alimentation ani‑ male”, INRA Prod. Anim. 15, 209 (2002).
15.F.E. Dowell, T.C. Pearson, E.B. Maghirang, F. Xie and D.T. Wicklow, “Reflectance and transmittance spec‑ troscopy applied to detecting fumonisin in single corn kernels infected with Fusarium verticillioides”, Cereal Chem. 79, 222 (2002). doi: http://dx.doi.org/10.1094/ CCHEM.2002.79.2.222
16.N. Berardo, V. Pisacane, P. Battilani, A. Scandolara, A. Pietri and A. Marocco, “Rapid detection of kernel rots and mycotoxins in maize by near‑infrared reflectance spectroscopy”, J. Agric. Food Chem. 53, 8128 (2005). doi:
http://dx.doi.org/10.1021/jf0512297
17.C. Bolduan, J.M. Montes, B.S. Dhillon, V. Mirdita and A.E. Melchinger, “Determination of mycotoxin concentration by ELISA and near‑infrared spectroscopy in Fusarium‑ inoculated maize”, Cereal Res. Commun. 37, 521 (2009). doi: http://dx.doi.org/10.1556/CRC.37.2009.4.5
18.F.E. Dowell, M.S. Ram and L.M. Seitz, “Predicting scab, vomitoxin, and ergosterol in single wheat kernels using near‑infrared spectroscopy”, Cereal Chem. 76, 573 (1999). doi: http://dx.doi.org/10.1094/CCHEM.1999.76.4.573 19.R. Ruan, Y. Li, X. Lin and P. Chen, “Non‑destructive
determination of deoxynivalenol levels in barley using near‑infrared spectroscopy”, Appl. Eng. Agric. 18, 549 (2002). doi: http://dx.doi.org/10.13031/2013.10141 20.S.R. Delwiche and G.A. Hareland, “Detection of scab‑
damaged hard red spring wheat kernels by near‑ infrared reflectance”, Cereal Chem. 81, 643 (2004). doi:
http://dx.doi.org/10.1094/CCHEM.2004.81.5.643 21.S.R. Delwiche, T.C. Pearson and D.L. Brabec, “High‑
speed optical sorting of soft wheat for reduction of deox‑ ynivalenol”, Plant Dis. 89, 1214 (2005). doi: http://dx.doi. org/10.1094/PD‑89‑1214
22.M. Beyer, F. Pogoda, F.K. Ronellenfitsch, L. Hoffmann and T. Udelhoven, “Estimating deoxynivalenol con‑ tents of wheat samples containing different levels of Fusarium‑damaged kernels by diffuse reflectance spectrometry and partial least square regression”, Int. J. Food Microbiol. 142, 370 (2010). doi: http://dx.doi. org/10.1016/j.ijfoodmicro.2010.07.016
23.S. Tekle, Å. Bjøornstad, H. Skinnes, Y.H. Dong and V.H. Segtnan, “Estimating deoxynivalenol content of ground oats using VIS‑NIR spectroscopy”, Cereal Chem. 90, 181 (2013). doi: http://dx.doi.org/10.1094/CCHEM‑07‑12‑ 0084‑R
24.A. De Girolamo, V. Lippolis, E. Nordkvist and A. Visconti, “Rapid and non‑invasive analysis of deoxynivalenol
in durum and common wheat by Fourier‑transform near infrared (FT‑NIR) spectroscopy”, Food
Addit. Contam. A 26, 907 (2009). doi: http://dx.doi. org/10.1080/02652030902788946
25.A. De Girolamo, S. Cervellieri, A. Visconti and M. Pascale, “Rapid analysis of deoxynivalenol in durum wheat by FT‑NIR spectroscopy”, Toxins 6, 3129 (2014). doi: http://dx.doi.org/10.3390/toxins6113129
26.C. Levasseur‑Garcia, “Infrared spectroscopy applied to identification and detection of microorganisms and their metabolites on cereals (corn, wheat, and barley)”, in Agricultural Science, Ed by G. Aflakpui. InTech, Rijeke, Croatia, p. 185 (2012). doi: http://dx.doi. org/10.5772/34762
27.COFRAC, “Guide technique d’accréditation. Dosage des mycotoxines et des phycotoxines dans les denrées
alimentaires destinées à l’homme ou aux animaux”, Document Lab GTA 21, Révision 01, p. 24 (2014).
28.AFNOR, “Food products – determination of tri‑
chothecenes B in wheat and corn – determination by gas chromatography–mass spectrometry (GC‑MS)”, NF V03‑ 146‑2008 (2008).
29.G.A. Lombaert, “Methods for the determination of deoxynivalenol and other trichothecenes in foods”, in Mycotoxins and Food Safety, Ed by J.W. DeVries, M.W. Trucksess and L.S. Jackson. Springer, New York, p. 141 (2002). doi: http://dx.doi.org/10.1007/978‑1‑4615‑0629‑ 4_14
30.S.W. Coleman and J. Halgerson, “Comparison of global and local equations for bias within a structured data set”, in Near Infrared Spectroscopy: Proceedings of the 11th International Conference, Ed by A.M. Davies and A. Garrido‑Varo. NIR Publications, Chichester, p. 171 (2004).
31.P. Dardenne, “Some considerations about NIR spectros‑ copy: closing speech at NIR‑2009”, NIR news 21(1), issue 1, 8 (2010). doi: http://dx.doi.org/10.1255/nirn.1165 32.J.D. Jobson, Applied Multivariate Data Analysis: Volume
II. Categorical and Multivariate Methods. Springer‑Verlag, New York (1992).
33.S. Tuffery, Data Mining and Statistics for Decision Making. John Wiley, Hoboken, NJ (2007).
34.D.‑W. Sun, Infrared Spectroscopy for Food Quality Analysis and Control. Academic Press, San Diego, CA (2009).
35.S. Sankaran, R. Ehsani, S.A. Inch and R.C. Ploetz, “Evaluation of visible‑near infrared reflectance spectra
of avocado leaves as a non‑destructive sensing tool for detection of laurel wilt”, Plant Dis. 96, 1683 (2012). doi:
http://dx.doi.org/10.1094/PDIS‑01‑12‑0030‑RE 36.S. Visa, B. Ramsay, A. Ralescu and E. van der Knaap,
“Confusion matrix‑based feature selection”, in 22nd Midwest Artificial Intelligence and Cognitive Science Conference 2011, Cincinnati, OH, p. 120 (2011).
37.T.C. Pearson and D.T. Wicklow, “Detection of corn ker‑ nels infected by fungi”, Trans. ASABE 49, 1235 (2006). doi:
http://dx.doi.org/10.13031/2013.21723
38.C. Levasseur, L. Pinson‑Gadais, D. Kleiber and O. Surel, “Near infrared spectroscopy used as a support to the
diagnostic of fusarium species”, Revue de Médecine Vétérinaire 161, 438 (2010). http://prodinra.inra.fr/ record/169146
39.T. Borjesson, B. Stenberg and J. Schnurer, “Near‑ infrared spectroscopy for estimation of ergosterol con‑ tent in barley: a comparison between reflectance and transmittance techniques”, Cereal Chem. 84, 231 (2007). doi: http://dx.doi.org/10.1094/CCHEM‑84‑3‑0231 40.G. Socrates, Infrared and Raman Characteristic Group
Frequencies: Tables and Charts, 3rd Edn. John Wiley, New York (2001).
41.V. Fernandez‑Ibanez, A. Soldado, A. Martinez‑Fernandez and B. de la Roza‑Delgado, “Application of near infrared spectroscopy for rapid detection of aflatoxin B1 in maize and barley as analytical quality assessment”, Food Chem.
113, 629 (2009). doi: http://dx.doi.org/10.1016/j.food‑ chem.2008.07.049
42.K.H.S. Peiris, M.O. Pumphrey and F.E. Dowell, “NIR absorbance characteristics of deoxynivalenol and of sound and Fusarium‑damaged wheat kernels”, J. Near Infrared Spectrosc. 17, 213 (2009). doi: http://dx.doi. org/10.1255/jnirs.846