O
pen
A
rchive
T
oulouse
A
rchive
O
uverte
(OATAO)
OATAO is an open access repository that collects the work of some Toulouse
researchers and makes it freely available over the web where possible.
This is an author’s version published in:
http://oatao.univ-toulouse.fr/
20537
To cite this version:
Rouvre, Ingrid and Gauquelin, Charles and Meynial, Isabelle and Basséguy, Régine
Impact of the chemicals, essential for the purification process of strict Fe-hydrogenase,
on the corrosion of mild steel. (2016) Bioelectrochemistry, 109. 9-23. ISSN 1567-5394
Any correspondance concerning this service should be sent to the repository administrator:
[email protected]
Impact of the chemicals, essential for the purification process of strict
Fe-hydrogenase, on the corrosion of mild steel
Ingrid Rouvre
a, Charles Gauquelin
b,c,d, Isabelle Meynial-Salles
b,c,d, Régine Basseguy
a,⁎
a
Laboratoire de Génie chimique, CNRS-Université Fédérale de Toulouse (INP, UPS), 4 allée Emile Monso, BP 84234, 31432 Toulouse, France
bUniversité Fédérale de Toulouse, INSA, UPS, INP, LISBP, 135 Avenue de Rangueil, F-31077 Toulouse, France
cINRA, UMR792 Ingénierie des Systèmes Biologiques et des Procédés, F-31400 Toulouse, France
dCNRS, UMR5504, F-31400 Toulouse, F-60200 Compiègne, France
a b s t r a c t
The influence of additional chemical molecules, necessary for the purification process of [Fe]-hydrogenase from Clostridium acetobutylicum, was studied on the anaerobic corrosion of mild steel. At the end of the purification process, the pure [Fe–Fe]-hydrogenase was recovered in a Tris–HCl medium containing three other chemicals at low concentration: DTT, dithionite and desthiobiotin. Firstly, mild steel coupons were exposed in parallel to a 0.1 M pH 7 Tris–HCl medium with or without pure hydrogenase. The results showed that hydrogenase and the additional molecules were in competition, and the electrochemical response could not be attributed solely to hydrogenase. Then, solutions with additional chemicals of different compositions were studied electrochem-ically. DTT polluted the electrochemical signal by increasing the Eocby 35 mV 24 h after the injection of 300 μL of control solutions with DTT, whereas it drastically decreased the corrosion rate by increasing the charge transfer resistance (Rct10 times the initial value). Thus, DTT was shown to have a strong antagonistic effect on corrosion and was removed from the purification process. An optimal composition of the medium was selected (0.5 mM dithionite, 7.5 mM desthiobiotin) that simultaneously allowed a high activity of hydrogenase and a lower impact on the electrochemical response for corrosion tests.
Keywords: Hydrogenase Anaerobic corrosion Dithiothreitol (DTT) Dithionite Desthiobiotin Mild steel 1. Introduction
Anaerobic microbiologically influenced corrosion (MIC), also named bio-corrosion, is a problem that affects materials used in many industri-al fields such as the oil and gas industry[1]. This is the acceleration of the degradation of conductive materials in the presence of microorganisms that adhere to and grow on the surface of materials as biofilms[2]. It is now commonly agreed that sulfate-reducing bacteria (SRB) and thiosulfate-reducing bacteria (TRB) are the main causes of anaerobic MIC[3–6].
Hydrogenases, which are either present in bacteria (such as SRB) or free in solution, have also been identified as key proteins in MIC phe-nomena[7,8].
Hydrogenases catalyze the reversible reaction linked to hydrogen shown in Eq.(1).[9–13].
2Hþ þ 2e"
↔ H2 ð1Þ
Generally, this reaction is the rate-limiting reaction in the system and can be considered as the driving force of anaerobic corrosion.
Various mechanisms of action of hydrogenase on corrosion have been established[7,8,14]. A first mechanism involves a synergetic effect be-tween hydrogenase and phosphates (or weak acids) in the presence of a redox mediator[14]. The second mechanism proposed does not require a redox mediator and hydrogenase catalyzes the reduction of protons or water by direct electronic transfer[7,8].
Among hydrogenases ([Ni–Fe]-hydrogenases, [Fe–Fe]-hydrogenases, [Ni–Fe–Se]-hydrogenases), [Fe–Fe]-hydrogenases were chosen for our study because of their high activity in the reduction of protons (10- to 100-fold that of [Ni–Fe]-hydrogenases)[15]. [Fe–Fe]-hydrogenases, often found as monomers, contain a catalytic domain, called the H-cluster, and a variable number of Fe-S clusters thought to be involved in electron transfer. The H-cluster of [Fe–Fe]-hydrogenase is composed of a 2Fe subsite covalently bound to a [4Fe–4S] subcluster.
Here, we chose the [Fe–Fe]-hydrogenase from Clostridium acetobutylicum (Ca) as this bacterium is known to be the microorganism that most efficiently produces hydrogen from hexose[15,16]. The cata-lytic domain of this [Fe–Fe]-hydrogenase is an arrangement of six iron atoms in the form of two groups: [4Fe–4S] and [2Fe], where the two iron atoms connected together constitute the active site.
During the production and purification of [Fe–Fe]-hydrogenase, some indispensable chemicals: dithiothreitol (DTT), sodium hydrosulfite (also called sodium dithionite) and desthiobiotin are added to the
⁎ Corresponding author.
medium to purify the protein in its active form[16]. As DTT and dithionite are sulfur compounds that are very reactive and may exist in many oxidation stages[17,18], they can also have an impact on corrosion.
In biotechnology, solutions of sodium dithionite are currently used as reducing agents. There is absorption and a fast chemical reaction be-tween sodium dithionite and oxygen[19,20]. In alkaline solutions, dithionite (S2O42−) is first oxidized to sulfite (SO32−) and sulfate (SO42−)
(Eq.(2)) and then sulfite is oxidized to sulfate (Eq.(3))[21]:
S2O2−4 þ O2þ 2OH−→ SO2−3 þ SO2−4 þ H2O ð2Þ SO2−3 þ
1 2O2→ SO
2−
4 : ð3Þ
Even without oxygen, dithionite is a reactive molecule that dispro-portionates in other sulfur compounds[22]. At pH values close to 7, the main decomposition reaction that occurs in an aqueous solution can be represented by the following equation[22,23]:
2S2O2−
4 þ H2O→2HSO−3 þ S2O2−3 : ð4Þ In an anaerobic aqueous alkaline solution, dithionite is also reported to disproportionate into sulfite and sulfide[17](Eq.(5)):
3S2O2−
4 þ 6OH−→ S2−þ 5SO2−3 þ 3H2O: ð5Þ At lower pH-values (pH 3), a disproportion reaction of dithionite generating sulfur and sulfite is suspected, since solid sulfur precipitate was observed (Eq.(6))[17]:
2S2O2−4 þ 2OH−→ S þ 3SO2−3 þ H2O: ð6Þ There is first a formation of a mackinawite film on the carbon steel, and, with sulfide excess, the film is converted to pyrrhotite and pyrite, and eventually further to smythite.
Thus, Hemmingsen et al.[17]reported an effect of dithionite on the corrosion of carbon steel in an aqueous solution at room temperature (20–22 °C). At low pH (pH 5), they observed a relatively high corrosion current of 80 μA·cm2during an initial phase, which, after 10 h of
immer-sion, decreased and stabilized at 55 μA·cm². At pH 7, the corrosion cur-rent was stable and around 12 μA·cm². When the pH was increased, the
corrosion rate decreased. They also compared the influence of different sulfur compounds (thiosulfate, sulfite, dithionite and sulfide), without giving values for a control experiment, they demonstrated that at high pH, sulfide and thiosulfate formed the densest film and at low pH, it was sulfide and dithionite.
Elsewhere, dithionite ion is also known to have an impact on corro-sion in sulfuric acid solution for 304 stainless steel, by generating thio-sulfate (H2SO3)[24]. At pH 1.2, S2O42−should decompose into S and
H2SO3, as shown in Eq.(7).
2S2O2−4 þ 4Hþþ 3H2O → S þ 3H2SO3þ 2H2O: ð7Þ Corrosion tests were performed at 30 °C and 60 °C in 0.1 mol/L H2SO4
(pH 1.2) with various amounts of Na2S2O4and H2SO3added, up to
60 mmol/L. The corrosion rate increased gradually as the amount of Na2S2O4was increased, reaching a maximum rate of 7.9 mm/year
for 20 mM. When the concentration of Na2S2O4was greater than
20–30 mM, the corrosion rate dropped drastically and 304 was passiv-ated, the passivated film containing NiS.
In the presence of H2SO3solution, similar corrosion behavior of 304
has been reported, with an induction period for the initiation of corro-sion. Thiosulfate ion produced by sulfate-reducing bacteria is also known to exacerbate anodic dissolution of stainless steel[25–28].
Regarding DTT, it has been identified to be a protective reagent for SH-groups[29]. Due to its low redox potential (−0.332 V at pH 7), DTT can maintain monothiols in the reduced state and can reduce disulfides according to the following reactions:
ð8Þ
ð9Þ
There have been few experiments on DTT and corrosion and little is known about its potential impact. Like dithionite, DTT is a sulfur com-pound and it is likely that DTT also has an impact on the corrosion of mild steels.
Another molecule also found in the medium with hydrogenase at the end of the purification process is desthiobiotin[16]. During the chromatographic purification step, hydrogenase is adsorbed to a Strep-Tactin Superflow column by a C-terminal Strep-tag II. The bound Strep-tag fusion protein is then eluted from the streptavidin column by a buffer solution containing a low concentration of desthiobiotin. At the end of the purification process, the strep-tagged hydrogenase is eluted from the purification column with low concentration of desthiobiotin[30]. Desthiobiotin is widely used for this competitive elution[31–34]so that the Strep-Tactin affinity resins can be used re-peatedly[35]. There are no reports of experiments on the impact of desthiobiotin on corrosion but, considering its structure, it can be as-sumed that desthiobiotin is probably an inert molecule and can protect the electrode surface.
The purpose of the present work was, first, to study the influence of [Fe–Fe]-hydrogenase from C. acetobutylicum (Ca) on the anaerobic corrosion of mild steel. The pure Fe hydrogenase was recovered in a 0.1 M pH 8 Tris/HCl medium containing three other molecules at low concentration: DTT, dithionite and desthiobiotin, which are possibly reactive on the surface of mild steel. The final objective was to study the effect of these molecules on corrosion in order to improve the un-derstanding of mild steel corrosion in the presence of hydrogenase.
2. Materials and methods
2.1. Hydrogenase production and purification
Tris(hydroxymethyl) aminomethane (named Tris) was purchased from Acros Organic, sodium dithionite, desthiobiotin and dithiothreitol from Sigma.
Hydrogenases used in this work were [Fe–Fe]-hydrogenase. They were extracted and purified from C. acetobutylicum cells in a 0.1 M pH 8 Tris–HCl medium. The hydrogenase purification process was per-formed as described in[30,36]. At the end of the purification process, to keep the enzyme in its active form, DTT (final concentration 2 mM) was added to the fraction of interest.
Thus, hydrogenase was contained in a 0.1 M pH 8 Tris–HCl medium with 2 mM DTT, 2 mM dithionite and 2.5 mM desthiobiotin. Hydroge-nase solution was divided into aliquots, flushed with pure hydrogen and stored at −80 °C. Hydrogenase oxidation activity of the purified en-zyme was assayed as described in[30,36]. The purified hydrogenase in the aliquots used in this study had a specific activity of 3000 U/mg and a concentration of 40 μg/mL or 0.605 μmol/L (weight 66.07 kDa).
2.2. Electrochemical cell setup
The experiments were performed with a three-electrode system in closed cells (Metrohm) (Schematic 1).
The working electrodes were 2-cm-diameter cylinders of S235JR mild steel from Descours–Cabaud, France (elemental composition by weight percentage: 0.17 C, 1.4 Mn, 0.55 Cu, 0.03 S, 0.03 P, 0.01 N). They were surrounded with adhesive lined heat shrink tubing (His-A 24/8 PO-X-BK) from HellermannTyton leaving a flat disk of the surface uncovered, with a total exposed area of 3.14 cm². Electrical connection was provided by a titanium threaded rod also protected with heat shrink tubing. Coupons were successively ground with SiC papers of in-creasing grit fineness (P120 to P2400) and then rinsed with distilled water and stored for 24 h before the experiments began.
Saturated calomel electrodes (SCE) from Materials Mates Sentek were used as references and platinum (Pt, 10% Ir) meshes, connected with a platinum (Pt, 10% Ir) wire, from Goodfellow were used as counter electrodes. The Pt electrode was cleaned before use by heating it in the oxidizing flame of a gas burner.
The medium in which the electrodes were immersed was 0.1 M pH 7 Tris/HCl containing 0.1 M Cl−. This was a compromise between the pH 8
of the purification process and the pH 6.3 which is the optimum of hydrogenase towards the hydrogen production[37].
The electrochemical cell was hermetically closed and the tempera-ture was maintained at 37 °C with a water-bath. Nitrogen was continu-ously bubbled into the solution for 1 h before the working electrodes were inserted. After the deoxygenation, the surface of the steel coupon was immersed in the solution and the nitrogen flow was maintained above the solution surface during the whole experiment. After 1 h and 15 min of immersion, hydrogenase solution or control solutions were injected with a syringe (Hamilton) in strict anaerobic conditions, oxy-gen having been removed from the syringe with nitrooxy-gen.
2.3. Electrochemical measurements
The electrochemical measurements were performed by using a VMP2 multipotentiostat (Bio-Logic, SA) monitored by the software EC-lab 9.98.
2.3.1. Open-circuit potential or free corrosion potential
The open-circuit potential (Eoc), also called free corrosion potential,
was monitored over time when the steel coupon was immersed in the solution for 24 h.
2.3.2. Voltammetry
Voltammetries were performed around the open-circuit potential from Eocto Eoc−20 mV to Eoc+20 mV, at 0.167 mV/s. Voltammograms
were made just before the injection, and after the injection at 10 min, 30 min, every 30 min up to 5 h and then at 24 h.
The slope of the polarization curve in the vicinity of the corrosion potential (dj/dE) was proportional to the corrosion rate (which was proportional to the corrosion current density) and corresponded to the inverse of the polarization resistance (Rp)[38,39]as in Eq.(10).
jcorr¼ B Rp¼ B dj dE ! " Ecorr ð10Þ
where B is a constant depending on Tafel constants βaand βc.
B ¼1 βaþ
1
βc ð11Þ
Slopes were obtained by taking 100 points around Eoc.
Schematic 1. Scheme of the experimental setup
Table 1
Composition of the injected solutions
Tris/HCl DTT Dithionite Desthiobiotin Hase
Hydrogenase solution in the aliquot 0.1 M pH 8 [NaCl] = 0.15 M 2 mM 2 mM 2.5 mM 0.605 μmol/L
Controls Control solution 1 0.1 M pH 8 [NaCl] = 0.15 M 2 mM 2 mM 2.5 mM –
2.3.3. Impedance
EIS measurements were performed just before the injection, and 5 h and 24 h after the injection.
Electrochemical impedance diagrams were drawn at Eocand at
−20 mV/Eocwith a frequency range from 100 kHz to 10 mHz, 10 points
per decade and an amplitude of 10 mV peak to peak. The impedance was modeled with EC-lab® software. 3. Results and discussion
3.1. Impact of hydrogenase on the corrosion of mild steel
Mild steel (S235JR) coupons were immersed in a Tris/HCl 0.1 M pH 7 (0.1 M Cl−) medium for 24 h. After a stabilization of the free potential
for 1 h and 15 min, cyclic voltammetry was performed to determine the slope of the polarization curve just before the injection. Then 50 μL volumes of hydrogenase (Hase) solution were injected in strictly anaer-obic conditions (t = 0). Several control experiments were performed by injecting the control solution without hydrogenase or just the Tris/HCl medium (0.1 M pH 7). The compositions of the different injected solu-tions are reported inTable 1.
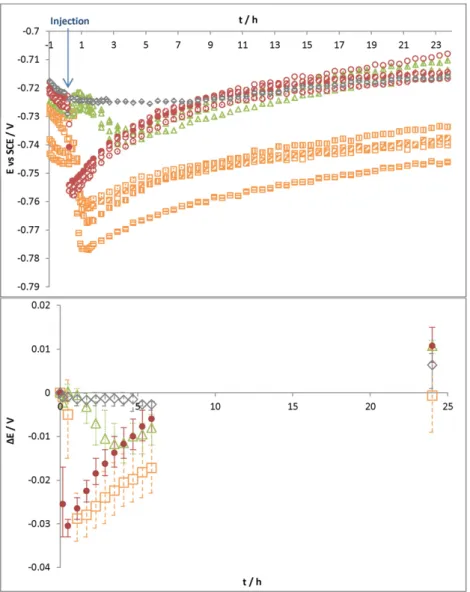
The variation of the open-circuit potential (Eoc) was recorded versus
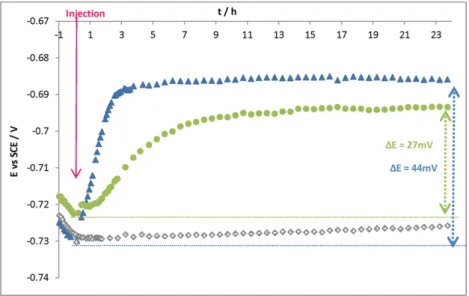
time for 24 h. No significant potential evolution was observed when injecting the Tris/HCl medium (0.1 M pH 7) (Fig. 1), which proves that there was no introduction of oxygen in the cell during injection of the solution. The addition of hydrogenase solution caused a fast increase in potential, which reached −0.688 V vs SCE in 3 h. When control solu-tion 1 (solusolu-tion without hydrogenase) was injected, the open-circuit potential also increased but less quickly than with hydrogenase (lower slope). Potential ennoblement also occurred during the first hours after injection.
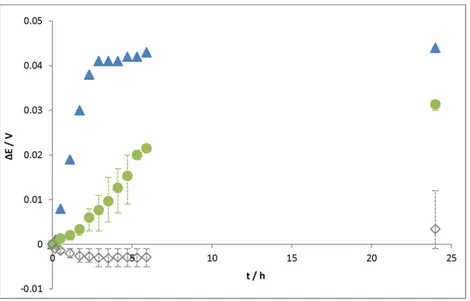
Some potential ennoblement values (∆E) were calculated by subtracting the starting potential (just before the injection) from the value of the potential at a given time.Fig. 2reports the average ∆E for ex-periments with Tris–HCl (0.1 M pH 7) medium, control solution 1 and hy-drogenase solution. The standard deviation encompassed the minimum and maximum values measured for each experiment. In the Tris–HCl (0.1 M pH 7) medium, there was no ennoblement of the potential and ΔE oscillated between −3 and +3 mV after 24 h. However, when injecting hydrogenase solution, a potential ennoblement of 41 mV in 3 h was observed and remained stable (44 mV after 24 h). When control solution 1 was injected, there was also a potential ennoblement (31 mV after 24 h). The increase of the free potential was more gradual with
control solution 1 (just 8 mV after 3 h) than with hydrogenase, for which the potential jump was clearly observed. Assuming the kinetics of the anodic reaction to be the same over time, the Eocennoblement
may be attributed to the catalysis of the cathodic process[40,41]. Indeed the injection of hydrogenase may induce catalysis of the reduction of pro-ton (or water) into hydrogen. By accelerating this cathodic reaction, hy-drogenase will accelerate the corrosion process of S235JR mild steel. However, the potential jump observed after injection could not be attrib-uted only to hydrogenase since an increase was also observed when in-troducing the control solution. Consequently, the additional molecules present in the medium can also be said to have an impact on corrosion.
Voltammetries performed in the vicinity of Eocgave the polarization
resistance (Rp).Fig. 3shows the inverse of Rp(1/Rp), which corresponds
to the slope obtained on voltammograms, and indicates the evolution of the corrosion rate. Experiments were repeatable, and the starting value of 1/Rpwas the same around 1.1 · 10−31/(Ω·cm²). In the Tris–HCl
(0.1 M pH 7) medium, 1/Rpdecreased a little over time and remained
stable at values close to 8.7 · 10−41/(Ω·cm²) after 3 h and 5.9 · 10−4
1/(Ω·cm²) after 24 h.
Injecting the control solution led to a fall of 1/Rpand around 3 h after
the injection, 1/Rpbecame stable (5.0 · 10−51/(Ω·cm²)); this value is
very low compared to that obtained in the Tris–HCl (0.1 M pH 7) medium. During the first hour after the injection of hydrogenase solution, 1/Rp
values followed those of control solution. Then, after 1 h of decrease, the 1/Rpvalues increased again, to reach 4.0 · 10−41/(Ω·cm²) which is
close to values obtained in the Tris–HCl (0.1 M pH 7) medium. To sum up, these findings confirmed that hydrogenase had an im-pact on corrosion and could accelerate the corrosion rate by catalyzing the cathodic reaction, but the presence of additional chemicals in the so-lution did not allow full expression of the hydrogenase impact on mild steel corrosion. Indeed, the results obtained for the injection of the con-trol solution gave parameters that counterbalanced one another (Figs. 2 and 3). The evolution of the corrosion rate over time with additional molecules from the control solution was surprising. According to the potential ennoblement (Fig. 2), it would seem that additional molecules enhanced the corrosion process, but the corrosion rate decreased when such molecules were injected (Fig. 3). Thus, hydrogenases and addi-tional molecules have an antagonistic effect on the corrosion rate. The molecules contained in the control solution certainly changed the surface state of the mild steel electrode that may partially hide the hy-drogenase effect.
To improve our understanding of the impact of hydrogenase on corrosion, it was necessary to deepen the study on the additional
Fig. 1. Open-circuit potential (Eoc) versus time for S235JR mild steel electrodes in a 0.1 M Tris–HCl pH 7 medium. Injection at t = 0+of 50 μL of: Tris–HCl medium, control solution 1,
molecules. The rest of the study focused on additional molecules and ex-periments were performed without hydrogenase.
3.2. Impact of molecules from the purification process on the corrosion of mild steel
Experiments were carried out with the same procedure as described above. To exacerbate the phenomena seen previously with additional molecules, the amount of solution injected was increased to 300 μL (rather than 50 μL as done previously). Moreover, beyond a certain level, there was no significant gain in the evolution of the electrochem-ical response; the system arrived at saturation (curves not shown). 3.2.1. Control solutions with different additional molecule compositions
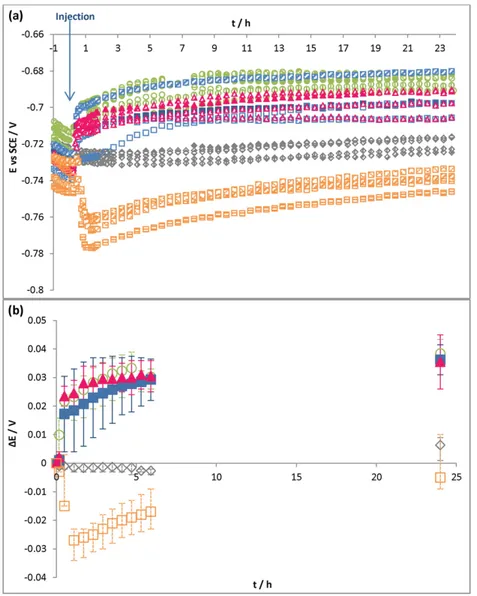
Different compositions of control solutions were injected into the electrochemical cell. They are given inTable 2. The variation of the open-circuit potential was recorded versus time for 24 h (Fig. 4(a)) and ∆E was calculated as previously (Fig. 4(b)).
As in the preceding experiments, the injection of the Tris–HCl (0.1 M pH 7) medium induced no significant evolution of Eocover time. In
contrast, injecting control solutions containing DTT (control solutions 1, 2 and 3) caused a Eocjump. Most of the potential ennoblement
oc-curred in the first hour and tended to stabilize thereafter (Fig. 4(b)). After 24 h, ∆E was about 30–35 mV for all control solutions with DTT. Moreover, by comparing the evolution of Eocennoblement inFigs. 2
and 4, it can be seen that the injection of 6 times more control solution 1 (300 μL rather than 50 μL) induced a drastically faster increase of the Eoc. In only half an hour, ∆Eocreached 17 mV with 300 μL while, with
50 μL injected, it took 5 h to reach the same value.
For the control solution without DTT (control solution 4-A-), a po-tential fall occurred just after the injection (∆E = −27 mV at 1 h). The free potential then tended to stabilize and increased gradually to reach a ∆E of −5 mV after 24 h.
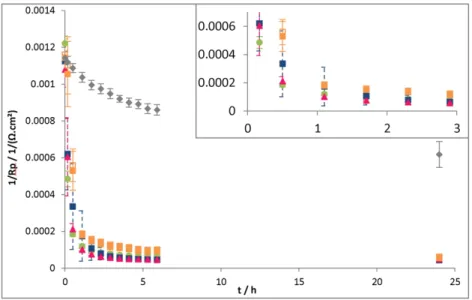
With all control solutions, 1/Rp(Fig. 5) dropped significantly
just after the injection, reaching 6 · 10− 51/(Ω·cm²) after 24 h.
In comparison, a very lower evolution of 1/Rpwas recorded with
the Tris/HCl (0.1 M pH 7) medium. Additional molecules, with or without DTT, induced a fast decrease of the corrosion rate that may be attributed to a decrease of the surface reactivity in their presence.
Fig. 2. Potential ennoblement ∆E (Eoc(t) − Eoc(t = 0)) versus time after 50 μL injection (point 0 = just before the injection) for S235JR mild steel electrodes in a 0.1 M Tris–HCl pH 7
medium of Tris–HCl medium, control solution 1, hase solution.
Fig. 3. 1/Rp (slope of polarization curve) versus time for S235JR mild steel electrodes in a 0.1 M Tris–HCl pH 7 medium. Injection at t = 0+of 50 μL of: Tris–HCl medium, control
For the control solution without DTT (4-A-), the evolution of Eoc, that
first decreased and then tended to come back to the initial value after 24 h, is in accordance with the diminution of the corrosion rate. For con-trol solutions containing DTT, parameters counterbalanced one another as seen in the previous experiment. The injection of these control solu-tions induced a potential ennoblement on the one hand, and a fall of the corrosion rate on the other. So on the one hand, DTT could introduce a new cathodic reaction that would occur at a less cathodic potential than the proton (water) reduction. On the other hand, changes in the surface state on the mild steel electrode may explain the decrease of corrosion rate, as for instance the additional molecules may mask the active surface. Impedance experiments were carried out to investigate these ideas in greater depth and to observe the global behavior of mild steel in
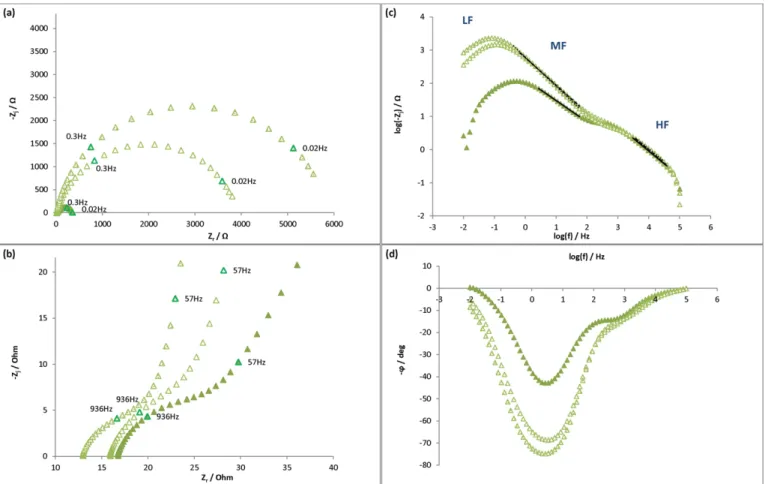
the Tris/HCl (0.1 M pH 7) medium, control solution 1 and control solu-tion 4-A- just before the injecsolu-tion, at t = 5 h and at t = 24 h.Fig. 6shows the impedance response of mild steel exposed in the Tris/HCl medium. On the Nyquist diagrams (global and zoom,Fig. 6(a) and (b)), two to three phenomena could be identified. At high frequencies (HF: 100 kHz to 1 kHz) there was a semi-circle with a small diameter (Fig. 6(b)) that decreased with time. At medium frequencies (MF: 1 kHz to 0.4 Hz) there was a depressed semi-circle that tended to curl below the horizontal axis at low frequencies (LF: 0.4 Hz to 10 mHz). The Bode phase angle vs. frequency (Fig. 6(d)) confirmed the occur-rence of these three phenomena with the presence of two minima (HF and MF) and one maximum (more or less clearly defined at LF).
In order to quantitatively characterize these phenomena, the electric model: Rs+ Q1//R1+ Q2//R2was used (Fig. 7(a)), where Rsis the
elec-trolyte resistance, Q1and R1are the parameters corresponding to the
small depressed circle at HF and R2and Q2those corresponding to the
depressed semi-circle at MF. The phenomenon at LF was not sufficiently well defined to be quantified, so only a qualitative description will be given. The impedance of a CPE (Constant Phase Element) characterized by the parameters Q and α is given by Eq.(12).
ZCPEð Þ ¼ω 1
Q jωð Þα ð12Þ
Table 2
Composition of control solutions tested.
Tris/HCl 0.1 M DTT (2 mM) Dithionite (2 mM) Desthiobiotin (2.5 mM) Tris/HCl medium pH 7 Control solution 1 pH 8 × × × Control solution 2 pH 8 × Control solution 3 pH 8 × ×
Control solution 4-A- pH 8 × ×
Fig. 4. (a) Open-circuit potential (Eoc) versus time, (b) potential ennoblement (ΔE) versus time, for S235JR mild steel electrodes in a 0.1 M Tris–HCl pH 7 medium. Injection at t = 0+of
Q and α are independent of the frequency. α is dimensionless. When α = 1, Q has units of a capacitance (F) and represents the capacitance of the interface. When 0 b α b 1, Q is expressed in (F·sα − 1)[42].
The two semi-circles were analyzed separately. The HF signal was simulated using the HF part of the circuit shown inFig. 7and the MF
with the model shown inFig. 7(b).Table 3reports the impedance pa-rameters and it can be seen that Rsvaried little during the tests (values
around 48–59 Ω·cm²).
At HF, the small resistance values obtained (8–43 Ω·cm²), especially when the immersion time increased, suggest that the HF phenomenon
Fig. 5. 1/Rp (slope of polarization curve) versus time for S235JR mild steel electrodes in a 0.1 M Tris–HCl pH 7 medium. Injection at t = 0+of 300 μL of different compositions of control
solutions: Tris–HCl medium, control solution 1, control solution 2, control solution 3, control solution 4-A-.
Fig. 6. Impedance diagrams of S235JR mild steel electrodes plotted at Eocat t = 0 (just before the injection), t = 5 h and t = 24 h in a 0.1 M Tris–HCl pH 7 medium. Injection at t =
was related to the presence of oxides on the steel surface. The capaci-tance C1was then calculated using Eq.(13), which was derived from
the power-law distribution of Hirschorn et al.[43,44]. This expression worked well for such diverse systems as aluminum oxides and oxides on stainless steel. This method of calculation is preferred in the case of normal distribution of resistivity and provides the most accurate assess-ment of CPE parameters in terms of physical properties[45].
C ¼ gQ ρð δϵϵ0Þ1−α
where g ¼ 1 þ 2:88 1−αð Þ2:375 ð13Þ with ρδthe resistivity of the oxide, ε0the vacuum permittivity, equal to
8.85 · 10−14F/cm, and ε the permittivity inside the oxide, equal to 12,
which is the number habitually used for iron oxides[46]. Eq.(13). can also be expressed as:
C ¼ gQð Þα1 δρ
δ
ð Þ1"αα ð14Þ
C ¼ gQð Þα1ðR1SÞ1"αα ð15Þ
with δ the film thickness and R1¼δρδ
S.
Before injection (t = 0), the capacitance was calculated to be 17 μF/cm². At t = 5 and 24 h, since α1was equal to 1, Q1can be
identified as the capacitance C1. The value was stable and equal to
2 μF/cm².
The thickness of the oxide film can be estimated using the following equation:
δ¼εε0
C ð16Þ
Before the injection, the thickness of the oxide layer was evalu-ated to be 62 nm. After injection it rapidly increased to attain 485 nm after 5 h, and then remained stable (530 nm after 24 h). This thickness evolution is in agreement with the high corrosion rate observed.
At MF, linear parts were observed on the plot of the modulus of the imaginary component of the impedance vs. the frequency in logarithmic coordinates (Fig. 6(c)). The slope values of these linear parts were used to determine α2values in order to confirm
wheth-er the system had a constant phase element (CPE) behavior or purely capacitive behavior[47–49]. For all instants, the α2values
were found to be equal to 0.8, so lower than 1, confirming a CPE behavior, i.e. the system exhibited a heterogeneous distribution of time constants. The effective capacitances associated with the CPE were calculated using Eq.(17), which was derived by Brug et al.
[50]: Cdl¼ Q1α 1 R0 s þ 1 R2 ! "α−1α with R0s ¼ Rs þ R1: ð17Þ The values of capacitances varied from 155 to 198 μF/cm² which is in the high range of a double layer capacitance (classically in the range of 10–100 μF/cm²[47]). Thus it can be assumed that the CPE behavior
Fig. 7. (a) Rs+ Q1//R1+ Q2//R2electric model to fit the two distinct semi-circles observed on the Nyquist plot (Fig. 6). Rs= solution resistance, R1and R2= resistances corresponding to
the circle diameters at HF and MF respectively; Q1,α1; Q2, α2= characteristic parameters of CPE at HF and MF respectively. (b) R′s+ Q2//R2electric model to fit the depressed semi-circle
observed at MF.
Table 3
Evolution in time of impedance parameters for S235JR mild steel electrodes in a 0.1 M Tris/HCl pH 7 medium, fromFig. 6, for Eocmeasurement.
HF MF
t (h) Rs(Ω·cm²) R1(Ω·cm²) Q1(F·sα − 1) α1 C1(μF/cm²) δ (nm) R2(Ω·cm²) Q2(F·sα − 1) α2 C2(μF/cm²)
0 59 43 1.5 · 10−4 0.8 17 62 814 1.4 · 10−3 0.8 167
5 58 8 – 1 2 485 1108 1.3 · 10−3 0.8 165
24 49 8 – 1 2 530 1253 1.4 · 10−3 0.8 198
With Rs= solution resistance; R1and R2= resistances corresponding to the circle diameters at HF and MF respectively; Q1,α1; Q2, α2= characteristic parameters of CPE at HF and MF
was due to a surface distribution of time constants linked to the charge transfer. Consequently, the diameter, R2, of the depressed semi-circles
can be attributed to a charge transfer resistance (Rct), which oscillated
around 1000 Ω·cm² and increased a little with time: +400 Ω·cm² after 24 h. As a first approach, it can be assumed that this small increase indicates a small decrease in the corrosion rate since the electron trans-fer on the interface decreases, which is in accordance with the 1/Rp evo-lution (Figs. 3 and 5).
Impedance spectra were also drawn at a cathodic potential (−20 mV/Eoc): the corresponding Nyquist plots are given inFig. 8. For
each immersion time, the graphs drawn at −20 mV/Eocare identical
to those drawn at Eocexcept at LF, where the depressed semi-circles
displayed a higher diameter and no curl below the horizontal axis was observed. Thus, the LF signal obtained at Eoccan be attributed to an
an-odic phenomenon, rather than a cathan-odic one. As the curves tend to curl and go below the horizontal axis, it can be assumed that an adsorption phenomenon existed.
Over time, impedance measurement confirmed that mild steel electrodes immersed in a Tris/HCl (0.1 M pH 7) medium are sub-mitted to general corrosion that led to the formation of a thick oxide layer (R1), and due to this layer, the corrosion rate decreased
a little as demonstrated in the previous electrochemical tests (Figs. 3 and 5).
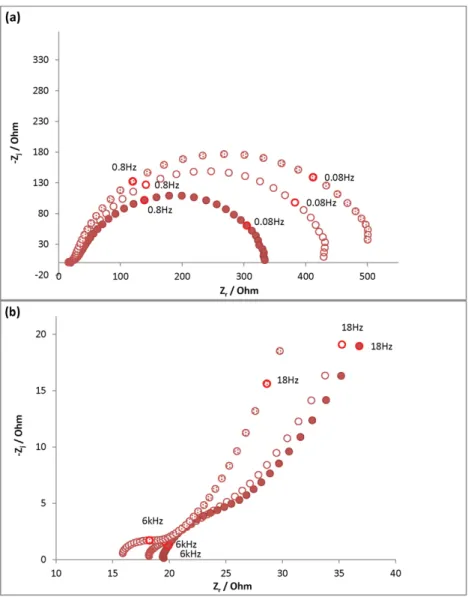
For the experiments corresponding to the injection of control solu-tion 1 (Fig. 9), the impedance signal before injection was the same as for the control medium (Tris/HCl) (Fig. 6), which indicates the repro-ducibility of the initial conditions. As can be seen in the Nyquist plot (Fig. 9(a) and (b)), after the injection of control solution 1 (2 mM DTT, 2 mM dithionite, 2.5 mM desthiobiotin), three phenomena occurred. At HF, a small semi-circle was also observed as in the Tris/ HCl medium, but it was not well-defined and less and less so with time. At MF, the depressed semi-circle obtained before injection be-came a large semi-circle that flattened at LF corresponding to two phenomena. At LF, the initial signals (curl below the horizontal axis) evolved as another capacitive or a diffusive phenomenon oc-curred. The plot of the imaginary modulus and Bode phase angle vs. frequency (Fig. 9(c) and (d)) confirmed the occurrence of those three phenomena.
For the initial signals (t = 0), Rsand the parameters corresponding
to the small circle (HF) and the depressed semi-circle (MF) were calcu-lated following the same model as with the Tris/HCl medium (Fig. 7). For signals obtained at 5 h and 24 h after the injection, it was assumed that the flattened semi-circle obtained at medium and low frequencies was due to two phenomena, one capacitive at MF and the other (capac-itive or diffusive) at LF. Thus the signal was simulated with the following models: Rs+ Q1//R1+ Q2//R2+ Q3//R3(Fig. 10(a)) or Rs + Q1//
Fig. 8. Impedance diagrams of S235JR mild steel electrodes plotted at −20 mV/Eocat t = 0 (just before the injection), t = 5 h and t = 24 h in a 0.1 M Tris–HCl pH 7 medium. Injection
R1+ Q2//(R2+ W) (Fig. 10(b)). InFig. 10(b), the model used involves a
Warburg term corresponding to a diffusion phenomenon. The Warburg impedance can be defined as in Eq.(18).
ZWarburgð Þ ¼ω σ
ffiffiffiffiffiffi jω
p : ð18Þ
In both cases, the theoretical signal obtained did not fit the experi-ments really well. Consequently, just the first part of the semi-circle at MF was analyzed, by using the following model: R′s + Q2/R2
(where R′s= R1+ R2), knowing that another phenomenon also
oc-curred at the interface at LF.
Values of impedance parameters are gathered inTable 4. Through-out the immersion test, Rsremained stable (around 60–70 Ω·cm²). At
HF, the semi-circles were not well defined. However, as previously, the resistances estimated are small and the HF circle can be attributed to an oxide layer developing on the surface of the mild steel electrode. The capacitance and the film thickness were calculated using Eqs.(15) and (16), respectively. The capacitances were in the range of 10 to 26 μF/cm² and the film thickness tended to increase with the immersion time to reach 110 nm after 24 h. This smaller thickness is in accordance with the smaller corrosion rate observed with the control, compared to what happened in the Tris–HCl medium.
At MF, the α2values were found to be lower than 1, indicating CPE
behavior. The capacitance, calculated using Eq.(17), decreased after the injection of control solution 1 and remained around 40–50 μF/cm². These values correspond to double layer capacitance values. Thus, R2can be attributed to a charge transfer resistance that increased
radically after the injection of control solution 1 (10 times the initial value). Consequently, as the surface of mild steel was more resistive or
less reactive, the corrosion rate decreased, which confirms the Rpresults
(Fig. 5).
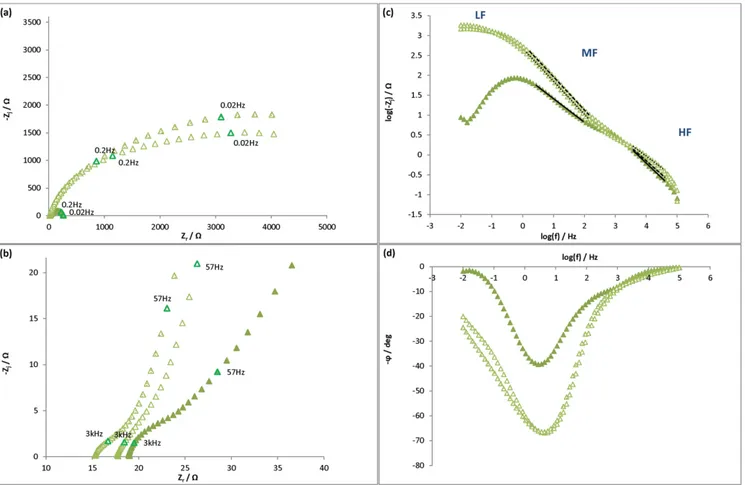
In the presence of control solution 4-A- (2 mM dithionite, 2.5 mM desthiobiotin) two principal phenomena were observed at t = 5 h and 24 h in the Nyquist plot (Fig. 11(a) and (b)). At HF and at MF–LF, two depressed semi-circles were present. The imaginary modulus and Bode phase angle vs. frequency plots (Fig. 11(c) and (d)) confirm the occurrence of those two phenomena.
Rsand the parameters corresponding to the small circle (HF) and the
depressed semi-circle (MF) were calculated following the same model as with the Tris/HCl medium (Fig. 7) and the values of impedance pa-rameters are given inTable 5.
During the experiment, Rsremained stable (around 50 Ω·cm²). The
HF semi-circle tended to decrease in terms of diameter (R1around
20 Ω·cm² after the injection). The capacitance C1(10–14 μF/cm²) was
calculated using the power-law (Eq.(15)). As before, this HF circle can be attributed to an oxide layer occurring at the surface of the mild steel electrode. The film thickness evaluation evolved as with control solution 1 and reached 110 nm.
At MF, the capacitance decreased after the injection of control solu-tion 4-A- and remained around 50 μF/cm² as with control solusolu-tion 1. This value corresponds perfectly to a double layer capacitance and the associated resistance of the depressed semi-circle can be attributed to a charge transfer resistance that increased radically after the injection of control solution 4-A (15 times the initial value after 24 h). Conse-quently, as the surface of mild steel was more resistive or less reactive, the corrosion rate decreased (as already shown inFig. 5). Moreover, as the resistance was greater than with control solution 1, the corrosion rate had to be lower. This difference was however not found with the Rp tests (Fig. 5).
Fig. 9. Impedance diagrams of S235JR mild steel electrodes plotted at Eocat t = 0 (just before the injection), t = 5 h and t = 24 h in a 0.1 M Tris–HCl pH 7 medium. Injection at t = 0+
In conclusion, in the presence of DTT, some parameters counter-balanced one another: Eocincreased (Fig. 4) whereas the corrosion
rate decreased as shown by the evolution of 1/Rp (Fig. 5) and the in-crease of Rct(Table 4). Without this molecule, although the injection
of the control solution (4-A-) involved a simultaneous decrease of Eoc
and the corrosion rate (Rctincreased), parameters all went in the right
direction for the phenomena to be understood. In this way, DTT can be claimed to pollute the electrochemical signal (Eocmonitoring).
With-out this molecule, it is possible that the injection of hydrogenase solu-tion may induce a potential jump which would be the effect of the enzyme only and not of additional molecules. Actually, DTT was used to avoid the inhibition of hydrogenase by possible traces of oxygen. Experimental conditions (work in a glove box for the purification and sealing of aliquots) would allow DTT to be removed from the experi-ment protocol. Moreover, we have shown that the injection of control solution without DTT using a gastight syringe showed no introduction of oxygen (as seen inFig. 4). Different control solutions without DTT were then tested.
3.2.2. Influence of additional molecules in control solutions without DTT So far, the concentrations of dithionite and desthiobiotin have been respectively 2 and 2.5 mM. After the hydrogenase purification, activity
tests were performed in both senses: consumption and production of hydrogen. In fact, dithionite was observed to lead to a hydrogen salting-out, which distorted activity results for hydrogenase. In conse-quence, it was decided to decrease the concentration of dithionite in the purification process to 0.5 mM, which could also improve the under-standing of hydrogenase impact on corrosion, since dithionite also played a role in the corrosion of mild steel.
Moreover, to increase the concentration of hydrogenase obtained after the purification process, the amount of desthiobiotin was in-creased. At first, 10 mM of desthiobiotin was used to elute the protein and, after some tests, an optimized reduced concentration of 7.5 mM was chosen. As it was supposed that desthiobiotin was inert with re-spect to corrosion, the fact that the amount of this molecule was in-creased in our tests did not seem to be important.
The control solutions without DTT were tested, as was done previ-ously, by injecting 300 μL of control solutions in a Tris/HCl (0.1 M pH 7) medium. Compositions are given inTable 6.
Injecting control solutions with different dithionite and desthiobiotin compositions always caused a decrease of the Eoc(Fig. 12) in comparison
with the injection of the Tris/HCl (0.1 M pH 7) medium. In all 3 cases, injecting additional chemicals had an impact on Eocin the early
hours and then Eoctended to stabilize. When thedesthiobiotindithionite ratio was
Fig. 10. (a) Rs+ Q1//R1+ Q2//R2+ Q3//R3electric model to fit one semi-circle at HF and two semi-circles, non-distinct at MF and LF, observed on the Nyquist plot (Fig. 9). Rs= solution
resistance, R1, R2and R3= resistances corresponding to the circle diameters at HF, MF and LF respectively; Q1, α1, Q2, α2and Q3, α3= characteristic parameters of CPE at HF, MF and LF
respectively. (b) R′s+ Q2//(R2+ W) electric model to fit the flattened depressed semi-circle observed at MF and LF.
Table 4
Evolution in time of impedance parameters for S235JR mild steel electrodes. Injection at t = 0+of control solution 1 fromFig. 9for E
ocmeasurement. HF MF t (h) Rs(Ω·cm²) R1(Ω·cm²) Q1(F·sα − 1) α1 C1(μF/cm²) δ (nm) R2(Ω·cm²) Q2(F·sα − 1) α2 C2(μF/cm²) 0 72 23 1.9 · 10−3 0.6 26 42 829 1.4 · 10−3 0.8 157 5 70 10 2.3 · 10−4 0.9 17 63 8761 3.1 · 10−4 0.8 39 24 62 10 2.3 · 10−4 0.8 10 110 8471 4.1 · 10−4 0.8 52
With Rs= solution resistance; R1and R2= resistances corresponding to the circle diameters at HF and MF respectively; Q1,α1; Q2, α2= characteristic parameters of CPE at HF and MF
the highest (control solution 4-A-: ratio = 0.8) there was a major potential fall, the Eocalways stayed under the Eocfound in the Tris/HCl
medium. For the other two control solutions (B and C), there was also a potential fall but after around 8 h, the open-circuit potential followed the Eocevolution in the Tris–HCl medium. Consequently, dithionite can
be claimed to have a greater influence on Eocthan desthiobiotin and
seemed, in our conditions, to inhibit the corrosion process. The control solution that gave the lowest potential variation according to the Tris/HCl medium (Fig. 12) was 4-B. Comparing the control solutions
4-C and B, the diminution of the concentration of desthiobiotin (4-B) involved fewer molecules that could cover the surface of mild steel and thus protect the surface from the corrosion process.
As expected, injecting control solutions led to a fall of 1/Rpin
com-parison with the Tris–HCl medium (Fig. 13). After 24 h, 1/Rpwas divided
by ten. In all cases, injecting control solutions decreased the corrosion rate, as was suspected with the Eoc evolution. However, with less
dithionite, the decrease was less immediate, and even less when there were fewer molecules (control 4-B). These results confirmed that dithionite and desthiobiotin had not the same influence on mild steel corrosion: dithionite had an important inhibiting effect (even with only 2 mM) and desthiobiotin had a mask effect of the active surface (dependent of concentration).
The control solution that induced the least variation relatively to the Tris–HCl (0.1 M pH 7) medium was control solution 4-B- (with 0.5 mM of dithionite and 7.5 mM desthiobiotin). The use of this con-trol solution for hydrogenase production should make it easier to progress in the understanding of the influence of hydrogenase on mild steel corrosion.
Fig. 11. Impedance diagrams of S235JR mild steel electrodes plotted at Eocat t = 0 (just before the injection), t = 5 h and t = 24 h in a 0.1 M Tris–HCl medium, pH 7. Injection at
t = 0+of 300 μL control solution 4-A. (a) Nyquist plot, (b) Nyquist zoom-in, (c) log imaginary modulus vs log frequency, (d) bode phase angle vs frequency.
Table 5
Evolution in time of impedance parameters for S235JR mild steel electrodes. Injection at t = 0+of control solution 4-A- fromFig. 11at E
ocmeasurement. HF MF t(h) Rs(Ω·cm²) R1 (Ω·cm²) Q1(F·sα − 1) α1 C1(μF/cm²) δ (nm) R2(Ω·cm²) Q2(F·sα − 1) α2 C2(μF/cm²) 0 58 44 1.7 · 10−4 0.8 14 78 1083 1.2 · 10−3 0.8 146 5 54 25 1.3 · 10−4 0.9 14 79 13518 4.0 · 10−4 0.8 47 24 44 23 1.4 · 10−4 0.8 10 110 16744 3.8 · 10−4 0.9 53
With Rs= solution resistance; R1and R2= resistances corresponding to the circle diameters at HF and MF respectively; Q1,α1; Q2, α2= characteristic parameters of CPE at HF and MF
respectively; C1and C2capacitances calculated at HF and MF respectively; δ thickness of oxide film.
Table 6
Composition of control solutions 4 (without DTT).
Tris/HCl Dithionite Desthiobiotin
Concentration 0.1 M pH 8 2 mM 0.5 mM 2.5 mM 7.5 mM 10 mM
Control solution 4 -A- × × ×
-B- × × ×
Fig. 12. (a) Open-circuit potential (Eoc) versus time, (b) potential ennoblement ΔE (E − Eoc) versus time for S235JR mild steel electrodes in a 0.1 M Tris–HCl pH 7 medium. Injection at
t = 0+of 300 μL of different compositions of eluents:
Tris–HCl medium, control solution 4-A, control solution 4-B, control solution 4-C.
Fig. 13. 1/Rp (slope of polarization curve) versus time for S235JR mild steel electrodes in a 0.1 M Tris–HCl medium pH 7. Injection at t = 0 of 300 μL of control solutions 4 of different
4. Conclusion
The usual process used to produce and purify [Fe–Fe]-hydrogenase from C. acetobutylicum leads to pure enzyme solubilized in a medium containing three additional molecules to maintain its activity: DTT, dithionite, and desthiobiotin. When these three molecules were present, the response to corrosion tests on mild steel in the presence of hydrogenase was ‘contaminated’ and antagonistic effects were re-corded. On the one hand, hydrogenase seemed to increase the corrosion process. When 50 μL of the hydrogenase solution was injected, there was a jump of Eocup to 44 mV after 24 h and 1/Rpincreased after
a time lapse of 2 h to reach 4.0 · 10−41/(Ω·cm²) after 24 h of
immer-sion. On the other hand, without hydrogenase, there was a potential jump up to 27 mV after 24 h and a simultaneous fall of 1/Rpto reach
5 · 10−51/(Ω·cm²) after 24 h. Additional molecules in solution with
hydrogenase are in competition with hydrogenase as far as the corro-sion that occurs at the surface of S235JR is concerned.
The electrochemical study on additional molecules showed that this antagonistic effect was mainly due to DTT. Without this molecule, the control solution induced a decrease of the corrosion process (decrease of Eocand 1/Rpand increase of Rct). Therefore, tests on hydrogenase
activity with or without DTT were carried out and, as the activity was maintained even in the absence of DTT, the DTT was now removed from the hydrogenase recovery and purification process.
To improve the yield of the purification process, the concentration of desthiobiotin was increased to 7.5 and 10 mM. At the same time, the concentration of dithionite was decreased to 0.5 mM because of its com-petition with hydrogenase during activity tests. These changes did not impair the enzyme activity. Electrochemically, the better option was also to use a lower dithionite concentration. With a dithionite
desthiobiotinratio of 0.8, the corrosion rate fell and the Eocalways stayed under the Eocof
the Tris/HCl (0.1 M pH 7) medium. Of the two control solutions with only 0.5 mM dithionite, the one that induced less variation with respect to the Tris–HCl (0.1 M pH 7) medium was the control solution with 7.5 mM desthiobiotin. These results let us think that the presence of dithionite (0.5 mM) and destiobiotin (7.5 mM) will not pollute too much the potential evolution due to the hydrogenase. Work is in prog-ress to test hydrogenase in these new conditions.
Acknowledgments
This work was financially supported by the French “Ministère de l’Enseignement Supérieur”.
The authors would like to thank Susan Becker, freelance translator, for her help in the redaction of English.
References
[1] T. Walsh, Continuous on-line weld corrosion monitoring for the oil and gas industry, Int. Conf. Pipeline Reliab., 1992.
[2] I.B. Beech, J. Sunner, Biocorrosion: towards understanding interactions between biofilms and metals, Curr. Opin. Biotechnol. 15 (3) (Jun. 2004) 181–186.
[3] D. Haras, Biofilms et altérations des matériaux: de l’analyse du phénomène aux stratégies de préventionBiofilms and deteriorations of materials: From analysis of the phenomenon to prevention strategies, Mater. Tech. 93 (2005) s.27–s.41 Matériaux Tech.
[4] H.A. Videla, Prevention and control of biocorrosion, Int. Biodeterior. Biodegrad. 49 (4) (Jun. 2002) 259–270.
[5] C. Xu, Y. Zhang, G. Cheng, W. Zhu, Localized corrosion behavior of 316L stainless steel in the presence of sulfate-reducing and iron-oxidizing bacteria, Mater. Sci. Eng. A 443 (1–2) (Jan. 2007) 235–241.
[6] R. Javaherdashti, R.K. Singh Raman, C. Panter, E.V. Pereloma, Microbiologically assisted stress corrosion cracking of carbon steel in mixed and pure cultures of sul-fate reducing bacteria, Int. Biodeterior. Biodegrad. 58 (1) (Jul. 2006) 27–35.
[7] M. Mehanna, R. Basseguy, M.-L. Delia, L. Girbal, M. Demuez, A. Bergel, New hypothe-ses for hydrogenase implication in the corrosion of mild steel, Electrochim. Acta 54 (1) (Dec. 2008) 140–147.
[8] S. Da Silva, R. Basséguy, A. Bergel, Electron transfer between hydrogenase and 316L stainless steel: identification of a hydrogenase-catalyzed cathodic reaction in anaer-obic mic, J. Electroanal. Chem. 561 (0) (Jan. 2004) 93–102.
[10] Y. Nicolet, C. Cavazza, J.C. Fontecilla-Camps, Fe-only hydrogenases: structure, func-tion and evolufunc-tion, J. Inorg. Biochem. 91 (1) (Jul. 2002) 1–8.
[11] P.M. Vignais, A. Colbeau, Molecular biology of microbial hydrogenases, Curr. Issues Mol. Biol. 6 (2) (Jul. 2004) 159–188.
[12] F.A. Armstrong, Hydrogenases: active site puzzles and progress, Curr. Opin. Chem. Biol. 8 (2) (Apr. 2004) 133–140.
[13] A. Volbeda, J. Fontecillacamps, Structure–function relationships of nickel–iron sites in hydrogenase and a comparison with the active sites of other nickel–iron enzymes, Coord. Chem. Rev. 249 (15–16) (Aug. 2005) 1609–1619.
[14] R.D. Bryant, W. Jansen, J. Boivin, E.J. Laishley, J.W. Costerton, Effect of hydrogenase and mixed sulfate-reducing bacterial populations on the corrosion of steel, Appl. Environ. Microbiol. 57 (10) (Oct. 1991) 2804–2809.
[15] B. Soni, P. Soucaille, G. Goma, Coninuous acetone–butanol fermentation — influence of vitamins on the metabolic-activity of Clostridium acetobutilicum, Appl. Microbiol. Biotechnol. 27 (1) (1987) 1–5.
[16] L. Girbal, G. von Abendroth, M. Winkler, P.M.C. Benton, I. Meynial-Salles, C. Croux, J.W. Peters, T. Happe, P. Soucaille, Homologous and heterologous overexpression in Clostridium acetobutylicum and characterization of purified clostridial and algal Fe-only hydrogenases with high specific activities, Appl. Environ. Microbiol. 71 (5) (Jan. 2005) 2777–2781.
[17] T. Hemmingsen, F. Fusek, E. Skavås, Monitoring of the corrosion process on sulphide film formation with electrochemical and optical measurements, Electrochim. Acta 51 (14) (Mar. 2006) 2919–2925.
[18] T. Hemmingsen, The electrochemical reaction of sulphur—oxygen compounds—part I. A review of literature on the electrochemical properties of sulphur/sulphur– oxygen compounds, Electrochim. Acta 37 (15) (Dec. 1992) 2775–2784.
[19] F. Camacho Rubio, M.P. Paez Dueñas, G. Blazquez Garcia, J.M. Garrido Martin, Oxygen absorption in alkaline sodium dithionite solutions, Chem. Eng. Sci. 47 (17–18) (Dec. 1992) 4309–4314.
[20] A.A. Shaikh, S.M.J. Zaidi, Kinetics of oxygen absorption in aqueous sodium dithionite solutions, J. Chem. Technol. Biotechnol. 56 (2) (Apr. 2007) 139–145.
[21] F. Camacho, M.P. Páez, M.C. Jiménez, M. Fernández, Application of the sodium dithionite oxidation to measure oxygen transfer parameters, Chem. Eng. Sci. 52 (8) (Apr. 1997) 1387–1391.
[22] L. SZEKERES, Analytical chemistry of the sulphur acids*1, Talanta 21 (1) (Jan. 1974) 1–44.
[23] L.M. de Carvalho, G. Schwedt, Sulfur speciation by capillary zone electrophoresis. Determination of dithionite and its decomposition products sulfite, sulfate and thio-sulfate in commercial bleaching agents, J. Chromatogr. A 1099 (1–2) (Dec. 2005) 185–190.
[24] M. Nakatsu, S. Yonezawa, M. Takashima, Effects of dithionite ion on corrosion of type 304 stainless steel in sulphuric acid solution, Corros. Sci. 49 (8) (Aug. 2007) 3185–3199.
[25] Y. Wang, P. Singh, Corrosion behavior of austenitic and duplex stainless steels in thiosulfate and chloride containing environments, Corrosion (Apr. 2015) (p. 150428063617007).
[26] D. Nakhaie, M. Zakeri, M. Naghizadeh, M.H. Moayed, Effect of Thiosulfate on pitting corrosion of 316SS: II. Metastable pitting and transition to stability, J. Electrochem. Soc. 162 (4) (Jan. 2015) C121–C127.
[27] M. Naghizadeh, D. Nakhaie, M. Zakeri, M.H. Moayed, Effect of thiosulfate on pitting corrosion of 316SS: I. Critical pitting temperature and pit chemistry, J. Electrochem. Soc. 162 (1) (Nov. 2014) C71–C77.
[28] T. Laitinen, Localized corrosion of stainless steel in chloride, sulfate and thiosulfate containing environments, Corros. Sci. 42 (3) (Mar. 2000) 421–441.
[29] W.W. Cleland, Dithiothreitol, a new protective reagent for SH groups*, Biochemistry 3 (4) (Apr. 1964) 480–482.
[30] G. von Abendroth, S. Stripp, A. Silakov, C. Croux, P. Soucaille, L. Girbal, T. Happe, Optimized over-expression of [FeFe] hydrogenases with high specific activity in Clostridium acetobutylicum, Int. J. Hydrog. Energy 33 (21) (Nov. 2008) 6076–6081.
[31] T. Maier, N. Drapal, M. Thanbichler, A. Böck, Strep-tag II affinity purification: an approach to study intermediates of metalloenzyme biosynthesis, Anal. Biochem. 259 (1) (May 1998) 68–73.
[32] T.G.M. Schmidt, L. Batz, L. Bonet, U. Carl, G. Holzapfel, K. Kiem, K. Matulewicz, D. Niermeier, I. Schuchardt, K. Stanar, Development of the Twin-Strep-tag® and its ap-plication for purification of recombinant proteins from cell culture supernatants, Protein Expr. Purif. 92 (1) (Dec. 2013) 54–61.
[33] A. Skerra, T.G. Schmidt, Applications of a peptide ligand for streptavidin: the Strep-tag, Biomol. Eng. 16 (1–4) (Dec. 1999) 79–86.
[34] S. Voss, A. Skerra, Mutagenesis of a flexible loop in streptavidin leads to higher af-finity for the Strep-tag II peptide and improved performance in recombinant pro-tein purification, Propro-tein Eng. Des. Sel. 10 (8) (Aug. 1997) 975–982.
[35] J.D. Hirsch, L. Eslamizar, B.J. Filanoski, N. Malekzadeh, R.P. Haugland, J.M. Beechem, R.P. Haugland, Easily reversible desthiobiotin binding to streptavidin, avidin, and other biotin-binding proteins: uses for protein labeling, detection, and isolation, Anal. Biochem. 308 (2) (Sep. 2002) 343–357.
[36] T. Lautier, P. Ezanno, C. Baffert, V. Fourmond, L. Cournac, J.C. Fontecilla-Camps, P. Soucaille, P. Bertrand, I. Meynial-Salles, C. Léger, The quest for a functional substrate access tunnel in FeFe hydrogenase, Faraday Discuss. 148 (2011) 385–407.
[37] M. Adams, L. Mortenson, The physical and catalytic properties of hydrogenase II of Clostridium pasteurianum. A comparison with hydrogenase I, J. Biol. Chem. 259 (11) (Jun. 1984) 7045–7055.
[38] C. Wagner, W. Traud, Über die Deutung von Korrosionsvorgängen durch Überlagerung von elektrochemischen Teilvorgängen und über die Potentialbildung an Mischelektroden, Z. Elektrochem. Angew. Phys. Chem. 44 (7) (Jul. 1938) 391–402.
[9] D.J. Evans, C.J. Pickett, Chemistry and the hydrogenases, Chem. Soc. Rev. 32 (5) (Aug. 2003) 268–275.
[39] M. Stern, A.L. Geary, Electrochemical polarization, J. Electrochem. Soc. 104 (1) (Jan. 1957) 56.
[40] R. Basseguy, M.-L. Délia, B. Erable, A. Bergel, Understanding Biocorrosion, Woodhead publishing LTd, 2014.
[41]M. Urquidi-Macdonald, D.D. Macdonald, Understanding Biocorrosion, Woodhead publishing LTd, 2014.
[42]V.M.-W. Huang, V. Vivier, I. Frateur, M.E. Orazem, B. Tribollet, The global and local impedance response of a blocking disk electrode with local constant-phase-element behavior, J. Electrochem. Soc. 154 (2) (Feb. 2007) C89.
[43]B. Hirschorn, M.E. Orazem, B. Tribollet, V. Vivier, I. Frateur, M. Musiani, Constant-phase-element behavior caused by resistivity distributions in films, J. Electrochem. Soc. 157 (12) (Dec. 2010) C452.
[44]B. Hirschorn, M.E. Orazem, B. Tribollet, V. Vivier, I. Frateur, M. Musiani, Constant-phase-element behavior caused by resistivity distributions in films, J. Electrochem. Soc. 157 (12) (Dec. 2010) C458.
[45] M.E. Orazem, I. Frateur, B. Tribollet, V. Vivier, S. Marcelin, N. Pebere, A.L. Bunge, E.A. White, D.P. Riemer, M. Musiani, Dielectric properties of materials showing
constant-phase-element (CPE) impedance response, J. Electrochem. Soc. 160 (6) (Mar. 2013) C215–C225.
[46] W.M. Haynes (Ed.), CRC Handbook of Chemistry and Physics, 95th ed.CRC Press Inc, Taylor et Francis group, Boca Raton London New York, 2014.
[47] M.E. Orazem, B. Tribollet, Electrochemical Impedance Spectroscopy, John Wiley & Sons, Inc., Hoboken, NJ, USA, 2008.
[48] M.E. Orazem, N. Pébère, B. Tribollet, Enhanced graphical representation of electro-chemical impedance data, J. Electrochem. Soc. 153 (4) (Apr. 2006) B129.
[49]C.H. Hsu, F. Mansfeld, Technical note: concerning the conversion of the constant phase element parameter Y0 into a capacitance, Corrosion 57 (09) (01-Sep-2001) (NACE International).
[50] G.J. Brug, A.L.G. van den Eeden, M. Sluyters-Rehbach, J.H. Sluyters, The analysis of electrode impedances complicated by the presence of a constant phase element, J. Electroanal. Chem. Interfacial Electrochem. 176 (1–2) (Sep. 1984) 275–295.
![Exacerbation of the mild steel corrosion process by direct electron transfer between [Fe-Fe]-hydrogenase and material surface](data:image/gif;base64,R0lGODlhAQABAIAAAP///wAAACH5BAEAAAAALAAAAAABAAEAAAICRAEAOw==)