OATAO is an open access repository that collects the work of Toulouse
researchers and makes it freely available over the web where possible
Any correspondence concerning this service should be sent
to the repository administrator:
[email protected]
This is an author’s version published in:
https://oatao.univ-toulouse.fr/26155
To cite this version:
Hoang, Thi Bich Ngoc and Moriceau, Véronique and Mothe,
Josiane Can we Predict Locations in Tweets? A Machine Learning
Approach. (2018) International Journal of Computational
Linguistics and Applications, 9. ISSN 0976-0962
Open Archive Toulouse Archive Ouverte
Can we Predict Locations in Tweets?
A Machine Learning Approach
Thi Bich Ngoc Hoang1,2, V´eronique Moriceau3, and Josiane Mothe1
1IRIT, CNRS UMR5505, UT2J, Universit´e de Toulouse, France 2University of Economics, The University of Danang, Vietnam 3LIMSI, CNRS, Univ. Paris-Sud, Universit´e Paris-Saclay, France
Abstract. Five hundred millions of tweets are posted daily, mak-ing Twitter a major social media from which topical information on events can be extracted. Events are represented by time, tion and entity-related information. This paper focuses on loca-tion which is an important clue for both users and geo-spatial ap-plications. We address the problem of predicting whether a tweet contains a location or not. Location prediction is a useful pre-processing step for location extraction. We defined a number of features to represent tweets and conducted intensive evaluation of machine learning parameters. We found that: (1) not only words appearing in a geography gazetteer are important but the occur-rence of a preposition right before a proper noun also is. (2) it is possible to improve precision on location extraction if the occur-rence of a location is predicted.
Keywords: Location extraction; location prediction; tweets; so-cial media
1 Introduction
According to statista1, Twitter is one of the leading worldwide so-cial networks (based on active users) which is expected to attract 2.5 billion users by 2018. The wide use, speed and coverage of
1http://www.statista.com/topics/1164/
Twitter makes it a major source for detecting new events and to gather social information on events.
As defined in Message Understanding Conference (MUC) cam-paigns2, an event has three main dimensions that are important and need specific attentions:
– Location information that indicates where the event takes place; – Temporal information that indicates when the event takes place; – Entity-related information which indicates what the event is
about or the participants.
This paper focuses on locations in tweets which are very vi-tal for many applications, specifically for geo-spatial applications [18], [20]. One of the first pieces of information broad-casted in disaster support systems is where the disaster happened [18]. A location within the text of a crisis message makes that message more valuable than the ones that do not contain a location [20]. In addition, Twitter users are more likely to pass along tweets with lo-cation and situation updates than other tweets, stating that Twitter users themselves find location is very important [22].
As mentioned previously, social media and microblogs are be-coming widely shared means of communication. As a result, there is a huge amount of tweets posted but a very little proportion of tweets contains a location. For example, in the Ritter’s data set [21] which was collected during September 2010, only about 9% of the tweets contain a location. It would thus be helpful to filter out tweets that do not contain locations, prior to extracting locations, in order to improve efficiency. We also target precision improve-ment of Named Entity Recognition (NER) tools since precision is meaningful and crucial in systems where the location extraction needs to be very precise such as disaster supporting systems and rescues systems.
More precisely, this paper tackles the following research ques-tions:
2http://www.itl.nist.gov/iaui/894.02/related_
1. Is it possible to predict location occurrence in a tweet?
2. How do the various machine learning parameters affect the re-sults? What are the most important tweet features?
3. Is location extraction precision improved when location occur-rence in tweets is predicted?
The rest of the paper is organized as follows: Section 2 focuses on related work. Section 3 presents the predictive model we devel-oped. Section 4 is devoted to the location extraction on predicted tweets while section 5 discusses the results and concludes the pa-per.
2 Related Works
Prior works related to ours are divided into two groups: location extraction and location prediction.
2.1 Location Extraction
A location is either explicitly mentioned or should be inferred from content. Conventional NER systems have addressed the problem of retrieving location specified in documents; however they do not perform very well on informal texts [14].
The literature proposes some methods to tackle the problem of lack of information in microblogs. Bellot et al. introduced the notion of tweet contextualization that aims at providing context, typically a short summary, associate to any tweet [2]. Liu et al. [19] combined a K-Nearest Neighbors classifier with a linear Con-ditional Random Fields model under a semi-supervised learning framework to find named entities in tweets. By aggregating infor-mation the Web to build local and global contexts from tweets, Li et al.[17] targeted the error-prone and short nature challenges. Another location estimation approach is to rely on analyzing geo-location by content analysis either with terms in gazetteer [8], with probabilistic model [6], or users’ networking [5]. Recently, Ritter et al. [21] tackled the problem of NER in tweets by re-building
the NLP pipeline beginning with part-of-speech (POS) tagging, through chunking. They applied LabelledLDA probabilistic model to exploit Freebase as a source of distant supervision. As a re-sult, they got 77% in F-measure in identification of locations which has not been outperformed yet. Besides, Gate NLP framework [3] used a gazetteer-based lookup and finite state machines to identify and type location names in microblog. Being adapted from a sys-tem used for news which got 60% in F-measure when applied on tweets, they can increase precision and F-measure, but mainly re-spect to person, organization and time, not location. Hoang et al. proposed a model to predict whether a tweet contains a location or not. They showed that this prediction is a useful step prior to location extraction [13].
2.2 Prediction of Locations
Location prediction in tweets has been little studied. Wing et al. [23] present a user geo-location prediction in terms of latitude and longitude coordinates by analyzing raw texts. They apply several supervised methods and predict location effectively using Wikipedia articles with a median error of 11.8 kilometers; however, the method does not perform well on tweets since the median error is 479 km.
Lee et al. [16] developed a geo-social event detection system by monitoring posts by Twitter users. They predict the occurrence of events depending on geographical regularities inferred from the usual behavior patterns of crowds with geo-tag tweets. Ikawa et al. [15] predicted the location where a message is generated by learn-ing associations between each location and its relevant keywords from past messages during the training. Bo et al. [11] predicted the geo-location of a message or user by identifying location indica-tive words that implicitly or explicitly encode an association with a particular location. Backstrom et al. also predicted the location of a user based on the users’ friends. The authors model the re-lation between geographical distance and friendship and calculate the probability of a user located at a specific place [1].
Related works focus on predicting either locations of users or locations in the text at the token level while we propose a method of prediction at the sentence level. The goal is to extract the small fraction of tweets that are likely to contain locations. If we were able to correctly predict tweets in which a location is mentioned, we hypothesize that precision of NER tools could be improved as well as efficiency since a very short portion of tweets contain a location in their content.
3 Predictive model
In this section, we propose a model to predict the location occur-rence in tweets. Then, we show the effectiveness of the model by evaluating the performance of location extraction tools on the pre-dicted tweets in the next section.
3.1 Tweet features
Predicting that a tweet contains a location name is not easy since tweets are usually written in pseudo-natural language and may not correspond to grammatically correct sentences. In our work, lo-cations are adequate names or abbreviation names defining places such as regions, countries, cities, rivers and mountains. Locations can also correspond to names of man-made infrastructures such as theaters, airports or streets. For example: Europe, Hungary, Bu-dapest, Auckland Airport, and NY.
We manually analyzed some tweets from the festival tweet col-lection used in CLEF 2015 [9, 12] in order to detect clues that could be used to predict whether a location occurs in the tweet or not. We also relied on the literature related to prepositions introducing a lo-cation.
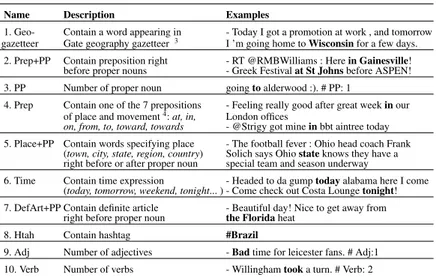
Table 1 presents the features we propose along with some ex-amples that support our choices. The features ”PP”,”Adj”,”Verb” are integers while the other ones are boolean. For POS tagging, we used Ritter’s tool [21] which is state of art POS in microblogs.
Table 1. Features used to predict location occurrence in a tweet and examples of corresponding tweets.
Name Description Examples
1. Geo- Contain a word appearing in - Today I got a promotion at work , and tomorrow gazetteer Gate geography gazetteer3 I ’m going home to Wisconsin for a few days.
2. Prep+PP Contain preposition right - RT @RMBWilliams : Here in Gainesville! before proper nouns - Greek Festival at St Johns before ASPEN! 3. PP Number of proper noun going to alderwood :). # PP: 1
4. Prep Contain one of the 7 prepositions - Feeling really good after great week in our of place and movement4: at, in, London offices
on, from, to, toward, towards - @Strigy got mine in bbt aintree today 5. Place+PP Contain words specifying place - The football fever : Ohio head coach Frank
(town, city, state, region, country) Solich says Ohio state knows they have a right before or after proper noun special team and season underway
6. Time Contain time expression - Headed to da gump today alabama here I come (today, tomorrow, weekend, tonight... ) - Come check out Costa Lounge tonight! 7. DefArt+PP Contain definite article - Beautiful day! Nice to get away from
right before proper noun the Florida heat 8. Htah Contain hashtag #Brazil
9. Adj Number of adjectives - Bad time for leicester fans. # Adj:1 10. Verb Number of verbs - Willingham took a turn. # Verb: 2
Geo-gazetteer. This feature checks if a tweet contains at least one word appearing in a geography gazetteer. We chose the Gate NLP framework’s gazetteer which includes a list of countries, cities, regions, states and their abbreviations since it is offered on line in open access and performs well in microblogs [3].
As there is usually a preposition before a place name, we pro-pose two features based on prepositions:
Prep. We defined a binary feature to capture the presence of prepositions of place and movement5(at, in, on, from, to, toward, towards).
Prep+PP. This feature checks if a tweet includes a preposition right before a proper noun (PP) recognized by Ritter POS.
Place+PP. This feature checks the presence of specific words which often appear right after or right before a proper noun of place. We use the following words: town, city, state, region, de-partment, country.
5http://grammar.ccc.commnet.edu/grammar/
Time. We assume that a text about a specific place often in-cludes time expressions. The presence of some time expressions checked includes: today, tomorrow, weekend, tonight, the days of a week, and months.
DefArt+PP. The definite article ”the” is used before country names such as the Czech Republic, the United Arab Emirates or the United Statesor before rivers, oceans, seas and mountain names. Thus, we define a binary feature that checks the presence of the following string type: ”the”+PP.
Htah. Hashtag is one of the most ubiquitous aspects of Twitter which are used to categorize tweets into topics. In events such as festival or conference, hashtags which specify place of the events are widely used. This binary feature checks if the tweet contains a hashtag.
PP, Adj, Verb. We count the number of proper nouns, adjec-tives and verbs in a tweet recognized by Ritter POS.
We use these features in a predictive model that is learned using a training/testing framework.
3.2 Data and evaluation framework
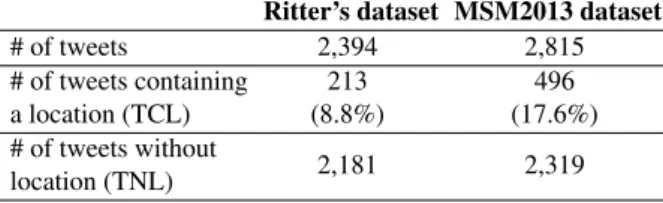
In our work, two main collections are used in order to evaluate our model: Ritter’s dataset and MSM2013 dataset. The first dataset has initially been used by Ritter et al.[21] while the second one is the training set of Making Sense of Micropost 2013 (MSM2013)[4]. These two datasets are provided along with manual annotations on locations. Details of numbers of tweets and their distribution are presented in Table 2.
We tried different machine learning algorithms: Naive Baiyes (NB), Support Vector Machine (SMO) and Random Forest (RF) using 10-fold cross validation implemented on Weka [10]. When training the model, it is possible to optimize various criteria; we consider both accuracy and true positives to be optimized.
Machine learning algorithms have also some parameters. The so called ”manual threshold” is a parameter for NB and RF classi-fiers and impacts the prediction results. It corresponds to the
statis-Table 2. Some features of the Ritter’s and MSM2013 datasets used to evaluate our location extraction and prediction models.
Ritter’s dataset MSM2013 dataset
# of tweets 2,394 2,815 # of tweets containing a location (TCL) 213 (8.8%) 496 (17.6%) # of tweets without location (TNL) 2,181 2,319
tically significant point which affects the output probability of the classifier. In our experiments, we made the manual threshold vary in (0.05, 0.20, 0.50, 0.75). On the other hand, SMO has an internal parameter called ”epsilon”. This parameter is for the round-off er-ror on this classifier method. We made epsilon vary in (0.05, 0.20, 0.50, 0.75).
Baseline. We converted the content of tweets into word vectors classified by SMO (default setting) and consider it as baseline. 3.3 Optimized Criteria
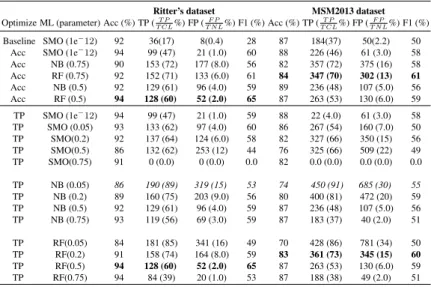
Table 3 presents the results for the various machine learning mod-els considering accuracy and true positive optimization. The lines in bold highlight the best F1-score while the line in italic highlight the highest true positive score obtained.
The best F1-score (65%) on Ritter’s dataset is obtained when using RF with threshold 0.5. Prediction accuracy is 94% with 128 true positives (TP) over 213 tweets containing a location (TCL) (60%) and 52 false positives (FP) over 2.181 tweets not containing a location (TNL) (2%) when optimizing accuracy. When optimiz-ing true positive, the same configuration gets the best results in terms of F1-score.
This configuration is second best when applied to MSM2013 dataset (F1-score 59%). Interestingly, NB with threshold 0.05 gets the impressive true positive on both collections although the num-ber of false positive increases. We get 190 TP / 213 TCL (89%) and 319 FP / 2181 TNL (15%) on the Ritter’s collection while
Table 3. Accuracy (Acc - %), true positive (TP), false positive (FP), and F1-Score (%) for TCL when optimizing either accuracy or true positives - 10-fold cross validation. The number next to the ML algorithm indicates the threshold (for NB and RF) and epsilon (for SMO). The number next to TP is the percentage of TP obtained out of the TCL while the number next to FP is the percentage of FP obtained out of TNL.
Ritter’s dataset MSM2013 dataset
Optimize ML (parameter) Acc (%) TP (T P T CL%) FP ( F P T N L%) F1 (%) Acc (%) TP ( T P T CL%) FP ( F P T N L%) F1 (%)
Baseline SMO (1e−12) 92 36(17) 8(0.4) 28 87 184(37) 50(2.2) 50
Acc SMO (1e−12) 94 99 (47) 21 (1.0) 60 88 226 (46) 61 (3.0) 58
Acc NB (0.75) 90 153 (72) 177 (8.0) 56 82 357 (72) 375 (16) 58 Acc RF (0.75) 92 152 (71) 133 (6.0) 61 84 347 (70) 302 (13) 61 Acc NB (0.5) 92 129 (61) 96 (4.0) 59 89 236 (48) 107 (5.0) 56 Acc RF (0.5) 94 128 (60) 52 (2.0) 65 87 263 (53) 130 (6.0) 59 TP SMO (1e−12) 94 99 (47) 21 (1.0) 59 88 22 (4.0) 61 (3.0) 58 TP SMO (0.05) 93 133 (62) 97 (4.0) 60 86 267 (54) 160 (7.0) 50 TP SMO(0.2) 92 137 (64) 124 (6.0) 58 82 327 (66) 350 (15) 56 TP SMO(0.5) 86 132 (62) 253 (12) 44 76 325 (66) 509 (22) 49 TP SMO(0.75) 91 0 (0.0) 0 (0.0) 0.0 82 0.0 (0.0) 0.0 (0.0) 0.0 TP NB (0.05) 86 190 (89) 319 (15) 53 74 450 (91) 685 (30) 55 TP NB (0.2) 89 160 (75) 203 (9.0) 56 80 400 (81) 472 (20) 59 TP NB (0.5) 92 129 (61) 96 (4.0) 59 87 236 (48) 107 (5.0) 56 TP NB (0.75) 93 119 (56) 69 (3.0) 59 87 183 (37) 40 (2.0) 51 TP RF(0.05) 84 181 (85) 341 (16) 49 70 428 (86) 781 (34) 50 TP RF(0.2) 91 158 (74) 164 (8.0) 59 83 361 (73) 345 (15) 60 TP RF(0.5) 94 128 (60) 52 (2.0) 65 87 263 (53) 130 (6.0) 59 TP RF(0.75) 94 84 (39) 20 (1.0) 53 87 188 (38) 49 (2.0) 51 450 TP / 496 TCL (91%) and 685 FP / 2319 TNL (30%) on the MSM2013 collection.
SMO gives the highest accuracy but does not give better F1-score (for TCL or TP) than RandomForest nor than Naive Bayes which are presented in Table 3.
For Ritter’s dataset, accuracy is from 84% to 94%; it is a little lower for MSM2013 dataset but still higher than 80% in most of the cases. When calculating accuracy, both predicted TCL and TNL are considered while we are more interested in correct prediction for TCL. This is reasonable as location names will be extracted on these predicted TCL in the next step.
Optimizing the TP criteria rather than accuracy leads to dif-ferent TP results although F-measure does not change much apart from the RF model.
To conclude, we found that when optimizing both accuracy and TP, RF with threshold 0.5 gives the highest F-measure at 65% on Ritter’s dataset. This configuration gets the second highest F-measure on MSM2013 dataset, 2% lower than the highest one us-ing RF threshold 0.75 (when optimizus-ing accuracy) and 1% lower than the highest one using RF threshold 0.2 (when optimizing TP). These achievements are much higher than the baseline which gets F-measure 28% on Ritter’s dataset and 50% on MSM2013 dataset.
3.4 Most Important Features for Training
Our predictive model uses 10 features, which are not all equally useful. We evaluate their importance by measuring the information gain attribute evaluator implemented on Weka. The most important features as well as their weight are:
– Ritter’s dataset: Geo-gazetteer (0.145), Prep + PP (0.108), PP (0.0776), Pre + Place (0.02), Place + PP (0.002).
– MSM2013 dataset: Geo-gazetteer (0.190), Prep + PP (0.093), Pre + Place (0.028), PP (0.023), DefArt + PP (0.005).
As presented above, Geo-gazetteer which specifies if a tweet contains a word appearing in GATE’s geography gazetteer is the most important feature while the Prep+PP indicating if a tweet contains a preposition right before a proper noun is the second most important one. This holds on both collections. Then the PP and Pre+Place are the next important features although the order slightly changes on the two collections.
4 Location extraction on predicted tweets
We showed in Section 3 that it is possible to learn a model to pre-dict whether a tweet contains a location or not. In this section, we show that precision of Ritter’s location extraction tool increases when applied only on tweets predicted as containing a location.
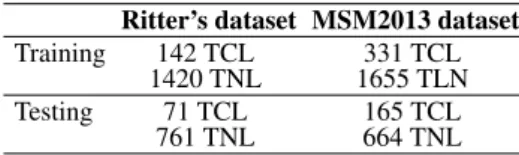
The training and testing sets are built from Ritter and MSM2013 collections using the following the principle: keeping the unbal-anced nature of the dataset, 2/3 of TCL are used for training and 1/3 for testing. Exact numbers are provided in Table 4.
Table 4. Description of data used for training and testing. Ritter’s dataset MSM2013 dataset Training 142 TCL 331 TCL
1420 TNL 1655 TLN Testing 71 TCL 165 TCL
761 TNL 664 TNL
Table 5 reports the results we obtain when extracting locations with Ritter’s location extraction tool. We present the results both on predicted TCL and the results when the whole test sets are used. We used 3 draws and report the average numbers.
Table 5. Effectiveness of Ritter’s tool on the two data collections in Recall, Pre-cision, F-measure, considering the entire test dataset, and the tweets we predict they contain a location. * indicates statistically significant differences. Number in brackets is the highest results among three draws.
Optimized Testing data Ritter’s dataset MSM2013 dataset Criteria
R P F1 R P F1
Baseline All testing dataset 69 85 75 60 80 69
Accuracy TCL predicted by RF (0.5) 45(51) 96*(98) 61(66) 37(40) 89*(92) 52(55) Accuracy TCL predicted by RF (0.75) 53(58) 92*(96) 67(68) 46(48) 86*(88) 60(61) TP TCL predicted by RF (0.2) 56(63) 91*(96) 69(71) 49(51) 87*(88) 63(64) TP TCL predicted by RF (0.5) 45(51) 96*(98) 61(66) 37(40) 89*(92) 52(55) TP TCL predicted by NB (0.05) 64(69) 88(93) 74(75) 58(61) 82(85) 68(70)
Statistical significance is marked by a * p-value 0.05. We use the t-test considering the entire testing datasets processed by Rit-ter’s location extraction tool as the baseline (first row Table 5). When several draws are used, the individual significance of each
draw is calculated and a * means the three draws are statistically significant when compared to the baseline.
As shown in Table 5, precision significantly increases on both Ritter and MSM2013 collections from 85% to 96% and from 80% to 89% respectively; although recall decreases due to the errors in prediction.
This increase in precision is meaningful and crucial in systems where the location extraction needs to be very precise such as dis-aster supporting systems and rescues systems. In addition, by run-ning NER tools only on tweets that are predicted to contain a lo-cation, we can save time and resources compared to running these tools on the whole original collections.
5 Discussions and Conclusion
In this paper, we proposed a model to predict whether a tweet con-tains a location or not. For this, we developed some new features used to represent tweets in addition to some features used in loca-tion extracloca-tion methods from the literature. We intensively evalu-ated learning settings: varying the machine learning algorithm and the machine learning parameters. We show that:
– Words appearing in a geography gazetteer and a preposition right before a proper noun are the two most important features in our predictive model.
– Our predictive model gives reasonable results on predicting lo-cation occurrence in a tweet.
– Random Forest and Naive Baiyes are the best machine learning classifiers for this problem - they perform better than Support Vector Machine (and other algorithms we tried but did not re-port).
– Changing the criteria to optimize (either accuracy or true posi-tive) does not change much F1-score while it has an impact on true positive and false positive.
– As considering location extraction, our model improves preci-sion by focusing only on tweets that are predicted as containing a location.
While our method is effective, our model leads to cases where prediction is not appropriate. Since we just consider abbreviations in GATE geography gazetteer, we did not get good results on some other cases of abbreviations on tweets such as:“@2kjdream Good morning ! We are here JPN!”. Besides, the model proposes a non-accurate prediction for the tweet “Coming to the Body Heat’s sign-ing” classified as a TCL while Body Heat is the proper noun of a movie. We think these elements could be considered in future work in order to improve our model. In next steps, we would like to deeply analyze false positives and false negatives in order to de-fine additional features that may improve the model accuracy. We would also like to evaluate our method on the CLEF festival col-lection [7].
References
1. Lars Backstrom, Eric Sun, and Cameron Marlow. Find me if you can: im-proving geographical prediction with social and spatial proximity. In Pro-ceedings of the 19th international conference on World wide web, pages 61– 70. ACM, 2010.
2. Patrice Bellot, V´eronique Moriceau, Josiane Mothe, Eric SanJuan, and Xavier Tannier. Inex tweet contextualization task: Evaluation, results and lesson learned. Information Processing & Management, 52(5):801–819, 2016.
3. Kalina Bontcheva, Leon Derczynski, Adam Funk, Mark Greenwood, Diana Maynard, and Niraj Aswani. Twitie: An open-source information extraction pipeline for microblog text. In Proceedings of the International Conference Recent Advances in Natural Language Processing RANLP 2013, pages 83– 90, 2013.
4. Amparo Elizabeth Cano Basave, Andrea Varga, Matthew Rowe, Milan Stankovic, and Aba-Sah Dadzie. Making sense of microposts (# msm2013) concept extraction challenge. 2013.
5. Swarup Chandra, Latifur Khan, and Fahad Bin Muhaya. Estimating twitter user location using social interactions–a content based approach. In Privacy, Security, Risk and Trust (PASSAT) and 2011 IEEE Third Inernational Con-ference on Social Computing (SocialCom), pages 838–843. IEEE, 2011. 6. Zhiyuan Cheng, James Caverlee, and Kyumin Lee. You are where you tweet:
a content-based approach to geo-locating twitter users. In Proceedings of the 19th ACM international conference on Information and knowledge manage-ment, pages 759–768. ACM, 2010.
7. Liana Ermakova, Lorraine Goeuriot, Josiane Mothe, Philippe Mulhem, Jian-Yun Nie, and Eric SanJuan. Clef 2017 microblog cultural contextualization lab overview. In International Conference of the Cross-Language Evaluation Forum for European Languages, pages 304–314. Springer, 2017.
8. Clayton Fink, Christine D Piatko, James Mayfield, Tim Finin, and Justin Martineau. Geolocating blogs from their textual content. In AAAI Spring Symposium: Social Semantic Web: Where Web 2.0 Meets Web 3.0, pages 25– 26, 2009.
9. Lorraine Goeuriot, Josiane Mothe, Philippe Mulhem, Fionn Murtagh, and Eric SanJuan. Overview of the clef 2016 cultural micro-blog contextualiza-tion workshop. In Internacontextualiza-tional Conference of the Cross-Language Evalua-tion Forum for European Languages, pages 371–378. Springer, 2016. 10. Mark Hall, Eibe Frank, Geoffrey Holmes, Bernhard Pfahringer, Peter
Reute-mann, and Ian H Witten. The weka data mining software: an update. ACM SIGKDD explorations newsletter, 11(1):10–18, 2009.
11. Bo Han, Paul Cook, and Timothy Baldwin. Geolocation prediction in social media data by finding location indicative words. Proceedings of COLING 2012, pages 1045–1062, 2012.
12. Thi Bich Ngoc Hoang and Josiane Mothe. Building a knowledge base us-ing microblogs: the case of cultural microblog contextualization collection. CEUR Workshop Proceedings, 2016.
13. Thi Bich Ngoc Hoang and Josiane Mothe. Location extraction from tweets. Information Processing and Management, 54(2):129–144, 2018.
14. Yan Huang, Zhi Liu, and Phuc Nguyen. Location-based event search in social texts. In Computing, Networking and Communications (ICNC), 2015 International Conference on, pages 668–672. IEEE, 2015.
15. Yohei Ikawa, Miki Enoki, and Michiaki Tatsubori. Location inference using microblog messages. In Proceedings of the 21st International Conference on World Wide Web, pages 687–690. ACM, 2012.
16. Ryong Lee and Kazutoshi Sumiya. Measuring geographical regularities of crowd behaviors for twitter-based geo-social event detection. In Proceed-ings of the 2nd ACM SIGSPATIAL international workshop on location based social networks, pages 1–10. ACM, 2010.
17. Chenliang Li, Jianshu Weng, Qi He, Yuxia Yao, Anwitaman Datta, Aixin Sun, and Bu-Sung Lee. Twiner: named entity recognition in targeted twitter stream. In Proceedings of the 35th international ACM SIGIR conference on Research and development in information retrieval, pages 721–730. ACM, 2012.
18. John Lingad, Sarvnaz Karimi, and Jie Yin. Location extraction from disaster-related microblogs. In Proceedings of the 22nd international conference on world wide web, pages 1017–1020. ACM, 2013.
19. Xiaohua Liu, Shaodian Zhang, Furu Wei, and Ming Zhou. Recognizing named entities in tweets. In Proceedings of the 49th Annual Meeting of the
Association for Computational Linguistics: Human Language Technologies-Volume 1, pages 359–367. Association for Computational Linguistics, 2011. 20. Robert Munro. Subword and spatiotemporal models for identifying action-able information in haitian kreyol. In Proceedings of the fifteenth conference on computational natural language learning, pages 68–77. Association for Computational Linguistics, 2011.
21. Alan Ritter, Sam Clark, Oren Etzioni, et al. Named entity recognition in tweets: an experimental study. In Proceedings of the conference on empirical methods in natural language processing, pages 1524–1534. Association for Computational Linguistics, 2011.
22. Sarah Vieweg, Amanda L Hughes, Kate Starbird, and Leysia Palen. Mi-croblogging during two natural hazards events: what twitter may contribute to situational awareness. In Proceedings of the SIGCHI conference on hu-man factors in computing systems, pages 1079–1088. ACM, 2010.
23. Benjamin P Wing and Jason Baldridge. Simple supervised document geolo-cation with geodesic grids. In Proceedings of the 49th Annual Meeting of the Association for Computational Linguistics: Human Language Technologies-Volume 1, pages 955–964. Association for Computational Linguistics, 2011.